[Preprint]. 2024 Apr 7:2024.04.06.24305415.
doi: 10.1101/2024.04.06.24305415.

Leveraging large-scale biobank EHRs to enhance pharmacogenetics of cardiometabolic disease medications

Affiliations

Leveraging large-scale biobank EHRs to enhance pharmacogenetics of cardiometabolic disease medications

Marie C Sadler et al. medRxiv. .

Update in

Abstract

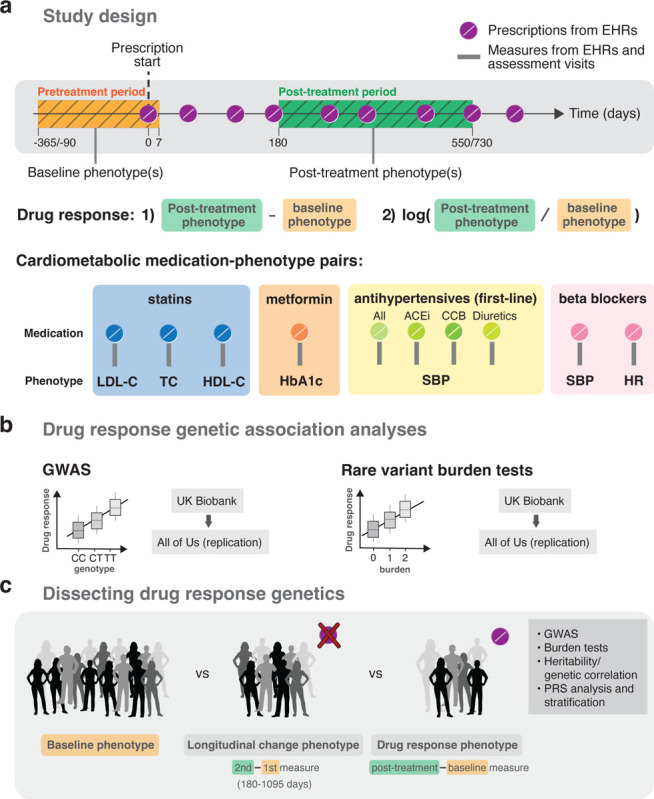
Electronic health records (EHRs) coupled with large-scale biobanks offer great promises to unravel the genetic underpinnings of treatment efficacy. However, medication-induced biomarker trajectories stemming from such records remain poorly studied. Here, we extract clinical and medication prescription data from EHRs and conduct GWAS and rare variant burden tests in the UK Biobank (discovery) and the All of Us program (replication) on ten cardiometabolic drug response outcomes including lipid response to statins, HbA1c response to metformin and blood pressure response to antihypertensives (N = 740-26,669). Our findings at genome-wide significance level recover previously reported pharmacogenetic signals and also include novel associations for lipid response to statins (N = 26,669) near LDLR and ZNF800. Importantly, these associations are treatment-specific and not associated with biomarker progression in medication-naive individuals. Furthermore, we demonstrate that individuals with higher genetically determined low-density and total cholesterol baseline levels experience increased absolute, albeit lower relative biomarker reduction following statin treatment. In summary, we systematically investigated the common and rare pharmacogenetic contribution to cardiometabolic drug response phenotypes in over 50,000 UK Biobank and All of Us participants with EHR and identified clinically relevant genetic predictors for improved personalized treatment strategies.


Conflict of interest statement

Competing interests The authors declare that they have no competing interests.

Figures

Figure 1:
Figure 1:
Study design. a Drug response study design using electronic health records (EHRs) from the UK and All of Us biobanks. Baseline and post-treatment phenotypes were extracted from EHRs or biobank assessment visits before and after the first recorded prescription, respectively. Different timings relative to the first prescription were tested as well as the use of single and average values over multiple baseline and post-treatment measures if available. Drug response phenotypes defined by the 1) absolute and 2) relative logarithmic difference in post-treatment and baseline biomarker measures were tested for ten cardiometabolic medication-phenotype pairs. b Discovery genetic association analyses were conducted in the UK Biobank and replicated in the All of Us research program on common variants (GWAS analysis) and rare variants through burden tests. c Follow-up analyses compared the genetics of baseline, longitudinal change and drug response genetics.
Figure 2:
Figure 2:
EHR drug response phenotypes and PGx GWAS results derived from the UKBB. a Baseline and post-treatment biomarker levels of statin (blue), metformin (orange), first-line antihypertensives (green) and beta blocker (purple) medication users as well as first and second measures of controls who do not take any related medications. b Manhattan plots of LDL-C and TC response to statins. GWAS association results of the top and bottom show the absolute and logarithmic relative biomarker differences, respectively. Loci with genome-wide significant signals (p-value < 5e-8) for either the absolute or relative difference are highlighted in red. Loci with genome-wide significant signals in other settings and with p-values < 1e-7 are highlighted in brown. All loci are annotated with the closest gene and the horizontal line denotes genome-wide significance (p-value < 5e-8). Results in a and b correspond to the lenient filtering setting with average values over multiple measures, if available.
Figure 3:
Figure 3:
Modelling longitudinal changes of biomarker levels with (or without) treatment effect. a Biomarker levels Y at time t can be influenced by genetics G0, environment E, gene-environment interactions (GE · E), drug status D and pharmacogenetic interactions (GD · D). Drug response phenotypes modelled as the difference of post-treatment (t1) and baseline (t0) levels allow the estimation of the pharmacogenetic effect γD through genetic regression analyses (Note S1). b-d Stratification at genetic variants that harbour pharmacogenetic γD (b, c) and/or baseline β0 (b, d) genetic effects. Adjusting drug response or longitudinal change phenotypes for baseline induces a bias that scales with β0 (Note S1). Thus, variants with significant baseline effects spuriously associate with drug response phenotypes even if γD is zero (d). Such measure of change, however, shows association in drug-naive individuals too. The baseline panel (t0) groups statin-free controls and statin users (simvastatin 40mg corresponding to the largest starting statin type-dose group), and shows their sex and age-adjusted standardized baseline level stratified by genotype. The following four panels (t1) show standardized longitudinal change (drug-naive individuals) and drug response phenotypes (statin users) adjusted for sex and age, once unadjusted (correct model) and adjusted (biased model) for baseline levels. Genotype regression co-efficients (denoted with b) with baseline lipid levels, longitudinal change and drug response phenotypes were derived through regression of the standardized outcome measures on the genotype dosage adjusted for sex and age as well as baseline levels if indicated. The significance level of the slope (b) is indicated by colour and stars where grey indicates a p-value > 0.05, blue a p-value ≤ 0.05, 2 stars a p-value < 1e-3 and 3 stars a p-value < 5e-8. Dots correspond to the mean and error bars to the standard deviation of covariate-adjusted baseline levels and drug response/longitudinal change phenotypes in each stratified group.
Figure 4:
Figure 4:
Drug response phenotype associations with PRS. a Drug response associations with PRS calculated for the absolute (post-base) and logarithmic relative (log(post)-log(base)) biomarker difference colour-coded by the drug. Standardized effect sizes (biomarker/PRS effect) correspond to an SD change for 1SD increase in PRS. A negative sign means that increased PRS increases treatment efficacy (i.e., larger biomarker difference compared to low PRS). All associations are adjusted for sex, age and drug-specific covariates. b Statin users stratified by 1) LDL-C baseline levels adjusted for LDL-C PRS and 2) LDL-C PRS quintiles with each tile showing the average LDL-C biomarker response (top: absolute, bottom: relative difference). Darker blue values correspond to stronger biomarker reductions. c Statin users stratified by 1) LDL-C baseline levels, 2) LDL-C PRS and 3) rs7412 genotype (individuals with the TT genotype are omitted as their sample size was too low). Boxes bound the 25th, 50th (median, centre), and the 75th quantile of LDL-C post-treatment measures. Whiskers range from minima (Q1 – 1.5*IQR) to maxima (Q3 + 1.5*IQR) with points above or below representing potential outliers.

References

    1. McInnes Gregory, Yee Sook Wah, Pershad Yash, and Altman Russ B. Genomewide association studies in pharmacogenomics. Clinical Pharmacology & Therapeutics, 110(3):637–648, 2021. - PMC - PubMed
    1. Nelson Matthew R, Johnson Toby, Warren Liling, Hughes Arlene R, Chissoe Stephanie L, Xu Chun-Fang, and Waterworth Dawn M. The genetics of drug efficacy: opportunities and challenges. Nature Reviews Genetics, 17(4):197–206, 2016. - PubMed
    1. Pirmohamed Munir. Pharmacogenomics: Current status and future perspectives. Nature Reviews Genetics, pages 1–13, 2023. - PubMed
    1. Postmus Iris, Trompet Stella, Deshmukh Harshal A, Barnes Michael R, Li Xiaohui, Warren Helen R, Chasman Daniel I, Zhou Kaixin, Arsenault Benoit J, Donnelly Louise A, et al. Pharmacogenetic meta-analysis of genome-wide association studies of ldl cholesterol response to statins. Nature communications, 5(1):5068, 2014. - PMC - PubMed
    1. Zhou Kaixin, Yee Sook Wah, Seiser Eric L, Van Leeuwen Nienke, Tavendale Roger, Bennett Amanda J, Groves Christopher J, Coleman Ruth L, Van Der Heijden Amber A, Beulens Joline W, et al. Variation in the glucose transporter gene slc2a2 is associated with glycemic response to metformin. Nature genetics, 48(9):1055–1059, 2016. - PMC - PubMed

Publication types