[Preprint]. 2024 Apr 3:2024.04.02.24305196.
doi: 10.1101/2024.04.02.24305196.

Persistent Mycobacterium tuberculosis bioaerosol release in a tuberculosis-endemic setting

Affiliations

Persistent Mycobacterium tuberculosis bioaerosol release in a tuberculosis-endemic setting

Ryan Dinkele et al. medRxiv. .

Update in

Abstract

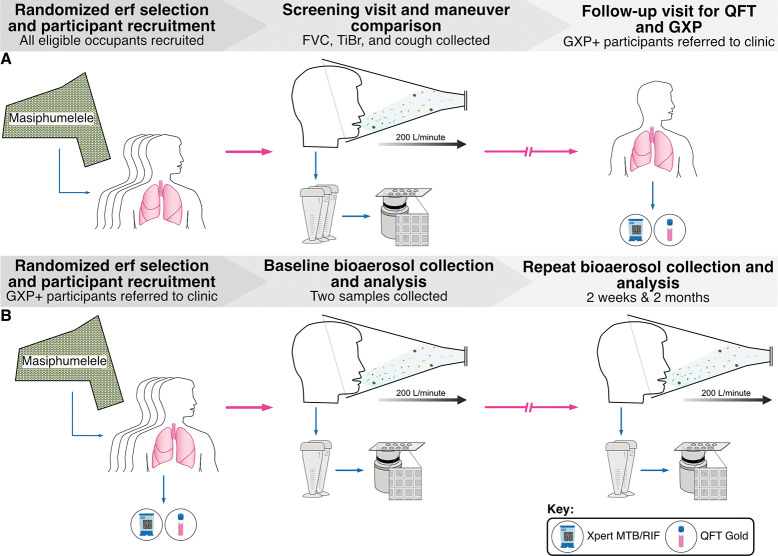
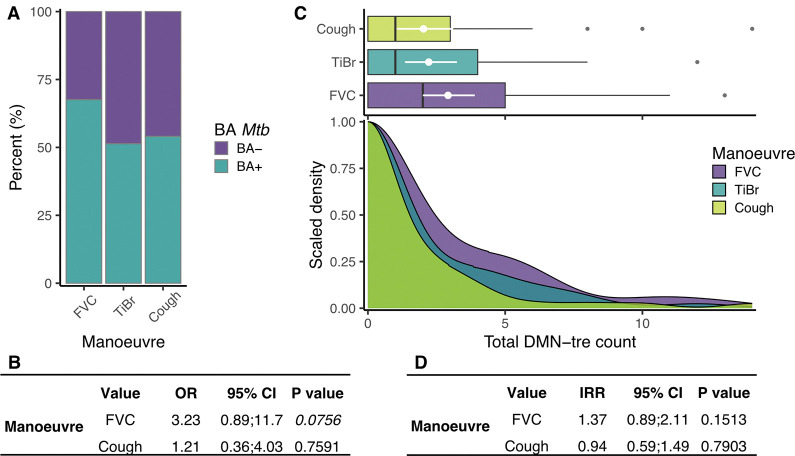
Pioneering studies linking symptomatic disease and cough-mediated release of Mycobacterium tuberculosis (Mtb) established the infectious origin of tuberculosis (TB), simultaneously informing the pervasive notion that pathology is a prerequisite for Mtb transmission. Our prior work has challenged this assumption: by sampling TB clinic attendees, we detected equivalent release of Mtb-containing bioaerosols by confirmed TB patients and individuals not receiving a TB diagnosis, and we demonstrated a time-dependent reduction in Mtb bioaerosol positivity during six-months' follow-up, irrespective of anti-TB chemotherapy. Now, by extending bioaerosol sampling to a randomly selected community cohort, we show that Mtb release is common in a TB-endemic setting: of 89 participants, 79.8% (71/89) produced Mtb bioaerosols independently of QuantiFERON-TB Gold status, a standard test for Mtb infection; moreover, during two-months' longitudinal sampling, only 2% (1/50) were serially Mtb bioaerosol negative. These results necessitate a reframing of the prevailing paradigm of Mtb transmission and infection, and may explain the current inability to elucidate Mtb transmission networks in TB-endemic regions.


Conflict of interest statement

The authors have no conflicting interests to declare.

Figures

Figure 1:
Figure 1:. Participant recruitment and bioaerosol sampling algorithms for the two cohorts.
(A) 39 participants were recruited from randomly selected erfs in Masiphumelele. At a first screening visit, participants produced bioaerosol samples from three respiratory maneuvers; forced vital capacity (FVC), tidal breathing (TiBr), and induced cough. Samples were processed and visualized independently by microscopists blinded to all sample information. Owing to the high prevalence of Mtb bioaerosol positivity, all participants were brought back for a follow-up visit during which blood and sputum were collected for QFT and GXP analysis, respectively. (B) 50 participants were recruited into a longitudinal observational study of Mtb release. Blood and sputum samples were collected at baseline for QFT and GXP analyses, respectively. Two equivalent bioaerosol samples were collected during ten minutes of tidal breathing with deep breaths taken at 30-second intervals. These samples were processed and imaged independently on nanowell-arrayed microscope slides by microscopists blinded to all sample information. This process was repeated at two weeks and two months post initial recruitment.
Figure 2:
Figure 2:. The production of aerosolized Mtb during all three respiratory maneuvers in the first cohort.
(A) The percentage of samples in which putative Mtb were detected (turquoise) or absent (purple) from forced vital capacity [FVC (67.6%)], tidal breathing [TiBr (51.4%)], and cough (51.1%). (B) Results of a logistic regression comparing the odds of a positive bioaerosol result compared to TiBr. (C) Box and density plots comparing the total number of Mtb detected between the three respiratory maneuvers. (D) Results of a negative binomial regression comparing the number of Mtb detected between the three respiratory maneuvers. OR = odds ratio, IRR = incident rate ratio, CI = confidence interval, BA = bioaerosol.
Figure 3:
Figure 3:. The production of aerosolized Mtb between the two cohorts.
(A) The percentage of samples in which putative Mtb were detected (green) or absent (purple). The odds of a positive bioaerosol sample were equivalent between the two groups (OR = 1.03, 95% CI = 0.36;2.92, p = 0.952) (B) Box and whisker and (C) equivalent density plots comparing the total number of Mtb detected between the two cohorts. The rates at which Mtb were produced during the two samplings were equivalent (IRR = 0.797, 95% CI = 0.47;1.33, p = 0.386). OR = odds ratio, IRR = incident rate ratio, CI = confidence interval, BA = bioaerosol.
Figure 4:
Figure 4:. The production of aerosolized Mtb during two equivalent respiratory maneuvers in the second cohort.
(A) Plot of the mean Mtb (DMN-tre positive) count from two samples, with error bars representing the range. No lines indicate equal counts, green lines indicate one count = 0, blue lines indicate two counts > 0. (B) Plot of the Mtb (DMN-tre positive) counts of the first and second samples at baseline (r = 0.810, p < 0.0001) with a fitted line representing a 1:1 correlation. (C) A Bland-Altman plot indicating the level of agreement between the first and second samples, with a (D) histogram showing the frequency of each count difference. Most samples differed by either 0 or ±1 (60%) and 94% of the samples differed by four or less.
Figure 5:
Figure 5:. The production of aerosolized Mtb through time in the second cohort.
(A) Total Mtb (DMN-tre positive) counts (sum of the two samples) through time, stratified by time trend. (B) The percentage of samples in which putative Mtb were detected (turquoise) or absent (purple) at each of the visits. (C) Results of a logistic regression comparing the odds of a negative BA result compared to T0. (D) Box and density plots comparing the total number of Mtb bacilli (DMN-tre positive) detected at each visit. (E) Results of a negative binomial regression comparing the number of Mtb bacilli (DMN-tre positive) detected at each visit. OR = odds ratio, IRR = incident rate ratio, CI = confidence interval, BA = bioaerosol.

References

    1. BARRY C. E., BOSHOFF H. I., DARTOIS V., DICK T., EHRT S., FLYNN J., SCHNAPPINGER D., WILKINSON R. J. & YOUNG D. 2009. The spectrum of latent tuberculosis: rethinking the biology and intervention strategies. Nat Rev Micro, 7, 845–855. - PMC - PubMed
    1. COHEN A., MATHIASEN V. D., SCHÖN T. & WEJSE C. 2019. The global prevalence of latent tuberculosis: a systematic review and meta-analysis. Eur Respir J, 54. - PubMed
    1. COUSSENS A. K., ZAIDI S. M. A., ALLWOOD B. W., DEWAN P. K., GRAY G., KOHLI M., KREDO T., MARAIS B. J., MARKS G. B., MARTINEZ L., RUHWALD M., SCRIBA T. J., SEDDON J. A., TISILE P., WARNER D. F., WILKINSON R. J., ESMAIL H., HOUBEN R. M. G. J., ALLAND D., BEHR M. A., BEKO B. B., BURHAN E., CHURCHYARD G., COBELENS F., DENHOLM J. T., DINKELE R., ELLNER J. J., FATIMA R., HAIGH K. A., HATHERILL M., HORTON K. C., KENDALL E. A., KHAN P. Y., MACPHERSON P., MALHERBE S. T., MAVE V., MENDELSOHN S. C., MUSVOSVI M., NEMES E., PENN-NICHOLSON A., RAMAMURTHY D., RANGAKA M. X., SAHU S., SCHWALB A., SHAH D. K., SHEERIN D., SIMON D., STEYN A. J. C., THU ANH N., WALZL G., WELLER C. L., WILLIAMS C. M. L., WONG E. B., WOOD R., XIE Y. L. & YI S. 2024. Classification of early tuberculosis states to guide research for improved care and prevention: an international Delphi consensus exercise. The Lancet Respiratory Medicine. - PMC - PubMed
    1. CRAMPIN A. C., GLYNN J. R., TRAORE H., YATES M. D., MWAUNGULU L., MWENEBABU M., CHAGULUKA S. D., FLOYD S., DROBNIEWSKI F. & FINE P. E. 2006. Tuberculosis transmission attributable to close contacts and HIV status, Malawi. Emerg Infect Dis, 12, 729–35. - PMC - PubMed
    1. DINKELE R., GESSNER S., MCKERRY A., LEONARD B., LEUKES J., SELDON R., WARNER D. F. & WOOD R. 2022. Aerosolization of Mycobacterium tuberculosis by Tidal Breathing. American Journal of Respiratory and Critical Care Medicine, 206, 206–216. - PMC - PubMed

Publication types