. 2024 Apr;13(4):e12434.
doi: 10.1002/jev2.12434.

Functional diversity of apoptotic vesicle subpopulations from bone marrow mesenchymal stem cells in tissue regeneration

Affiliations

Functional diversity of apoptotic vesicle subpopulations from bone marrow mesenchymal stem cells in tissue regeneration

Xuanhao Zhang et al. J Extracell Vesicles. 2024 Apr.

Abstract

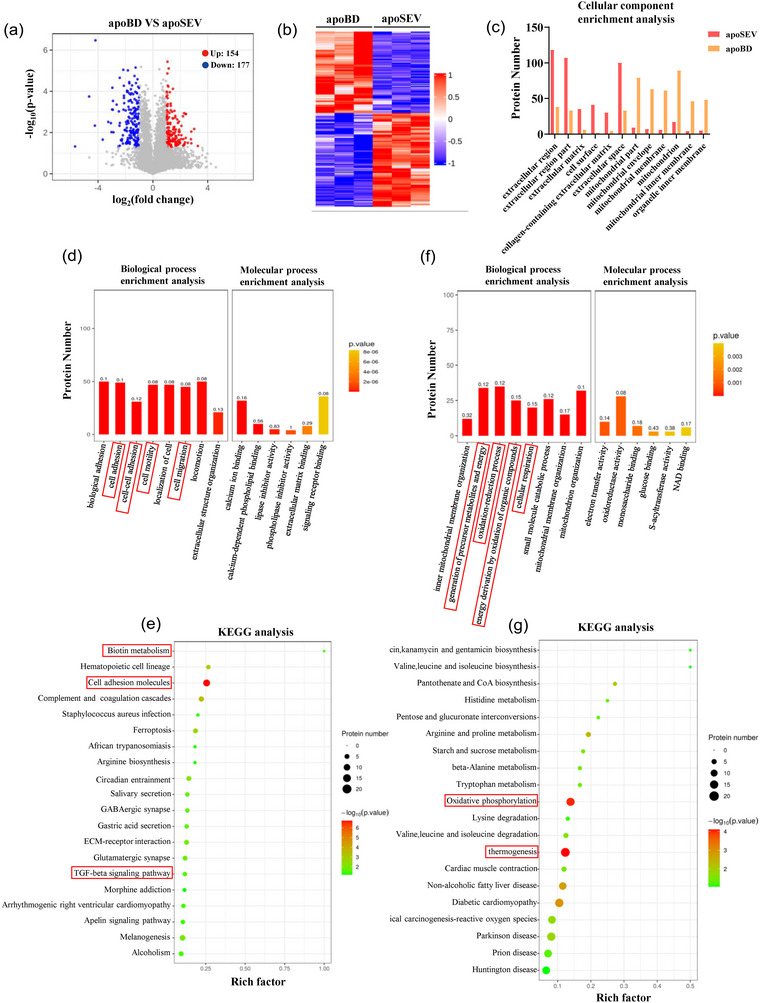
Apoptosis releases numerous apoptotic vesicles that regulate processes such as cell proliferation, immunity, and tissue regeneration and repair. Now, it has also emerged as an attractive candidate for biotherapeutics. However, apoptotic vesicles encompass a diverse range of subtypes, and it remains unclear which specific subtypes play a pivotal role. In this study, we successfully isolated different apoptotic vesicle subtypes based on their sizes and characterized them using NTA and TEM techniques, respectively. We compared the functional variances among the distinct subtypes of apoptotic vesicles in terms of stem cell proliferation, migration, and differentiation, as well as for endothelial cell and macrophage function, effectively identifying subtypes that exhibit discernible functional differences. ApoSEV (with diameter <1000 nm) promoted stem cell proliferation, migration, and multi-potent differentiation, and accelerated skin wound healing of diabetes mouse model, while apoBD (with diameter >1000 nm) played the opposite effect on cell function and tissue regeneration. Lastly, employing protein analysis and gene sequencing techniques, we elucidated the intrinsic mechanisms underlying these differences between different subtypes of apoEVs. Collectively, this study identified that apoptotic vesicle subtypes possessed distinct bio-functions in regulating stem cell function and behaviour and modulating tissue regeneration, which primarily attribute to the distinct profiling of protein and mRNA in different subtypes. This comprehensive analysis of specific subtypes of apoEVs would provide novel insights for potential therapeutic applications in cell biology and tissue regeneration.

Keywords: apoptosis; apoptotic bodies; apoptotic vesicle subtypes; mesenchymal stem cells; vesicle biogenesis.


Conflict of interest statement

The authors declare no conflicts of interest.

Figures

FIGURE 1
FIGURE 1
Induction of apoptosis in rat MSCs and characterization of apoptotic vesicle subtypes. (a) Schematic representation of the differential centrifugation method used to isolate apoptotic vesicle subtypes, apoBD and apoSEV, from apoptotic MSCs. (b) TEM images capturing the vesicle morphology of apoBD and apoSEV subtypes. Scale bar, 500 nm (c) Size distribution of apoptotic vesicles assessed through DLS, demonstrating the distinct size ranges of apoBD and apoSEV, and their average particle size was counted. (d) Exposure of Annexin V on the surface of isolated apoptotic vesicles, indicating their apoptotic nature. Scale bar, 5 μm (e) apoSEV and apoBD were co‐stained with Annexin V and PKH26, with both markers expressed on the vesicle membrane surfaces. Scale bar, 5 μm (f) Positive expression of apoptotic vesicles observed via nano‐flow cytometry. (g) Western blot analysis demonstrated the presence of Caspase‐3/Cleaved Caspase‐3 in MSC, apoSEV and apoBD. (h) PKH26‐labeled apoSEV and apoBD were both efficiently engulfed by MSCs. DLS, dynamic light scattering; MSCs, mesenchymal stem cells; TEM, transmission electron microscopy.
FIGURE 2
FIGURE 2
Functional Characteristics of Apoptotic Vesicle Subtypes (apoSEV and apoBD) in vitro. (a) Effects of apoSEV and apoBD on rat‐BMSC proliferation were assessed using the CCK‐8 colorimetric assay. (b), (c) The impact of apoSEV and apoBD on rat‐BMSC migration was evaluated using a Transwell assay, along with quantitative assessment of the cell migration area. Scale bar, 200 μm (n = 3) (d), (e) The scratch assay was conducted to assess the migration ability of rat‐BMSC following treatment with apoSEV and apoBD and quantitative assessment of closure area (n = 3) Scale bar, 200 μm (f), (g) Alizarin Red staining was performed to evaluate the impact of apoSEV and apoBD on rat‐BMSC osteogenic differentiation capability, and quantitative assessment of the Alizarin Red staining area. Scale bar, 100 μm (n = 3) (h), (i) Oil Red O staining was employed to assess the influence of apoSEV and apoBD on rat‐BMSC adipogenic differentiation capability and quantitative assessment of the number of lipid droplets in the Oil Red O staining. Scale bar, 100 μm (n = 3). Statistical analyses are performed by One‐way ANOVA with Tukey's post hoc test or Welch's ANOVA with Tamhane's T2 post hoc test. *, p < 0.05; **, p < 0.01, ***, p < 0.001, ****, p < 0.0001; NS, p > 0.05. rat‐BMSC, rat bone marrow mesenchymal stem cells; CCK, cell counting kits.
FIGURE 3
FIGURE 3
Comparing the impact of apoSEV and apoBD on endothelial cell and macrophage functions. (a) Effects of apoSEV and apoBD on HUVEC proliferation were assessed using the CCK‐8 colorimetric assay. (b), (c) The impact of apoSEV and apoBD on HUVEC migration was evaluated using a Transwell assay, along with quantitative assessment of the cell migration area. Scale bar, 200 μm (n = 3). (d), (e) The scratch assay was conducted to assess the migration ability of HUVEC following treatment with apoSEV and apoBD and quantitative assessment of closure area (n = 3) Scale bar, 200 μm. (f) Tube formation of HUVECs with apoSEV and apoBD treatment. Scale bar = 200 μm. (g), (h) Statistical analysis of the number of nodes and segments representing tube formation capacity. (i) Expression of M1 and M2 macrophage‐associated genes TNF‐α, INOS, IL‐6, IL‐1β, IL‐10, CD206, and Arg1 was detected by quantitative reverse transcription polymerase chain reaction. Statistical analyses are performed by One‐way ANOVA with Tukey's post hoc test or Welch's ANOVA with Tamhane's T2 post hoc test. *, p < 0.05; **, p < 0.01, ***, p < 0.001, ****, p < 0.0001; NS, p > 0.05. HUVEC, human umbilical vein endothelial cells.
FIGURE 4
FIGURE 4
Separation of apoSEV by membrane filtration. (a) NTA reveals the size distribution of apoSEV induced under STS, UV, and H2O2 treatments. (b) Schematic representation of the membrane filtration process used to segregate apoSEV into three subtypes based on particle size: apoSEV (<0.22 μm), apoSEV (0.22–0.45 μm), and apoSEV (0.45–1 μm). (c) TEM images depicting the morphology and particle size of the isolated four apoptotic vesicle subtypes. Scale bars, 200 nm. (d) NTA results illustrating the distribution of apoSEV subtypes based on particle size. (e) According to the NTA results, apoSEV (<0.22 μm) accounted for approximately 84% of the total apoSEV, apoSEV (0.22–0.45 μm) comprised 13.4%, and apoSEV (0.45–1 μm) constituted 2.3%. (n = 3). (f) Statistical analysis of the number of three vesicle subtypes isolated by membrane filtration based on NTA results. (n = 3). (g) Statistical analysis of the average particle size of the three vesicle subtypes isolated by membrane filtration based on NTA results (n = 3). (h) Protein quantification using BCA assay to determine the protein content within different vesicle subtypes (n = 3). Statistical analyses are performed by One‐way ANOVA with Tukey's post hoc test or Welch's ANOVA with Tamhane's T2 post hoc test. **, p < 0.01, ***, p < 0.001, ****, p < 0.0001; NS, p > 0.05. NTA, nanoparticle tracking analysis; TEM, transmission electron microscopy.
FIGURE 5
FIGURE 5
Effects of apoSEV subtypes on MSC proliferation, migration, and osteogenic and adipogenic differentiation. (a) Effects of three subtypes of apoSEV on MSC proliferation were assessed using the CCK‐8 colorimetric assay. (b), (c) The impact of three subtypes of apoSEV on MSC migration was evaluated using a Transwell assay, along with quantitative assessment of the cell migration area. Scale bar, 200 μm. (n = 3). (d), (e) The scratch assay was conducted to assess the migration ability of MSC following treatment with three subtypes of apoSEV and quantitative assessment of closure area. Scale bar, 200 μm. (n = 3). (f), (g) Alizarin Red staining was performed to evaluate the impact of three subtypes of apoSEV on MSC osteogenic differentiation capability, and quantitative assessment of the Alizarin Red staining area. Scale bar, 100 μm. (n = 3). (h), (i) Oil Red O staining was employed to assess the influence of three subtypes of apoSEV on MSC adipogenic differentiation capability and quantitative assessment of the number of lipid droplets in the Oil Red O staining. Scale bar, 100 μm. (n = 3). Statistical analyses are performed by One‐way ANOVA with Tukey's post hoc test or Welch's ANOVA with Tamhane's T2 post hoc test. **, p < 0.01, ***, p < 0.001, ****, p < 0.0001; NS, p > 0.05. MSC, mesenchymal stem cells.
FIGURE 6
FIGURE 6
In vivo effects of GelMA‐encapsulated apoSEV and apoBD in Type II Diabetic Mouse Skin Wound Healing. (a) Schematic representation of the experimental design for the in vivo application of GelMA‐encapsulated apoSEV and apoBD to circular skin wounds in a type II diabetic mouse model. (b), (c) Progression of wound healing monitored by photography at 3‐day intervals. (d) Quantitative analysis of wound closure rates. (e), (f) Observation of skin wound images after 12 days of different treatments using Hematoxylin and Eosin (H&E) staining and Masson staining. (g) Measure the content of collagen fibres based on Masson staining. (n = 3) (h) The number of follicular appendages. (n = 3). Statistical analyses are performed by one‐way ANOVA with Tukey's post hoc test or Welch's ANOVA with Tamhane's T2 post hoc test. *, p < 0.05; **, p < 0.01, ***, p < 0.001; NS, p > 0.05.
FIGURE 7
FIGURE 7
Effects of apoSEV and apoBD on cell proliferation, angiogenesis, and infiltrating macrophage phenotype in skin wounds of type 2 diabetic mice. (a) Immunofluorescence staining images of DAPI (blue), CD31 (red), Cyclin D (yellow), and Ki67 (green) at Day 12 in each group. (b) Measurement of the fluorescence intensity ratio of CD31/DAPI (n = 3). (c) Measurement of the fluorescence intensity ratio of Cyclin D/DAPI (n = 3). (d) Measurement of the fluorescence intensity ratio of Ki67/DAPI (n = 3). (e) Immunofluorescence staining images of DAPI (blue), F4/80 (green), TNFα (red) at Day 12 in each group. (f) Measurement of the fluorescence intensity ratio of TNFα/F4/80 (n = 3). (g) Immunofluorescence staining images of DAPI (blue), F4/80 (green), CD206 (yellow) at Day 12 in each group. (h) Measurement of the fluorescence intensity ratio of CD206/F4/80 (n = 3). Statistical analyses are performed by One‐way ANOVA with Tukey's post hoc test or Welch's ANOVA with Tamhane's T2 post hoc test. *, p < 0.05, **, p < 0.01, ***, p < 0.001, ****, p < 0.0001; NS, p > 0.05. DAPI, 4 ', 6‐diamidino‐2‐phenylindole.
FIGURE 8
FIGURE 8
Proteomic analysis of apoptotic vesicles derived from h‐BMSC: apoBD and apoSEV. (a) Volcano plot illustrating significantly upregulated (red dots) and downregulated (blue dots) proteins in apoBD compared to apoSEV. (b) Hierarchical clustering of DEPs (Fold change > 1.5 and Q value < 0.05) between apoBD and apoSEV, with protein abundance Z‐score normalized. Rows represent proteins, and columns represent individual replicates. (c) GO enrichment analysis of proteins in apoSEV and apoBD, categorized into ‘Cellular component’. The Y‐axis represents the number of proteins, and the X‐axis represents GO terms. (d) GO enrichment analysis of significantly upregulated proteins in apoSEV, categorized into ‘Biological Process,’ ‘Molecular process,’. The Y‐axis represents the number of proteins, and the X‐axis represents GO terms. (e) KEGG pathway analysis of significantly upregulated proteins in apoSEV. The top 20 enriched terms are presented as bubble charts. The Y‐axis represents KEGG terms, the X‐axis represents the enrichment factor. The color of the bubble represents enrichment significance, and the size of the bubble represents the number of upregulated proteins. (f) GO enrichment analysis of significantly upregulated proteins in apoBD, categorized into ‘Biological Process,’ ‘Molecular Function,’ and ‘Cellular Component.’ (g) KEGG pathway analysis of significantly upregulated proteins in apoBD. DEP, differentially expressed proteins; GO, gene ontology; h‐BMSC, human bone marrow mesenchymal stem cells; KEGG, Kyoto Encyclopedia of Genes and Genomes.
FIGURE 9
FIGURE 9
Transcriptomic analysis of apoptotic vesicles derived from h‐BMSC: apoBD and apoSEV. (a) The volcano plot displays DEGs in apoBD compared to apoSEV. Blue and red dots represent downregulated and upregulated genes, respectively. (b) Hierarchical clustering of DEGs (Fold change > 1.5 and Q value < 0.05) between apoBD and apoSEV, with gene abundance normalized by Z‐score. Rows represent genes, and columns represent individual replicates. (c) GO enrichment analysis of genes in apoSEV and apoBD, categorized into ‘Cellular component’. The Y‐axis represents the number of genes, and the X‐axis represents GO terms. (d) GO enrichment analysis of significantly upregulated genes in apoSEV, categorized into ‘Biological process,’ ‘Molecular function’. The Y‐axis represents the number of genes, and the X‐axis represents GO terms. (e) KEGG pathway analysis of significantly upregulated genes in apoSEV. The top 20 enriched terms are presented as bubble charts. The Y‐axis represents KEGG terms, and the X‐axis represents the enrichment factor. The color of the bubble indicates enrichment significance, and the size of the bubble represents the number of upregulated genes. (f) GO enrichment analysis of significantly upregulated genes in apoBD, categorized into ‘Biological process,’ ‘Molecular process,’ and ‘Cellular component.’(g) KEGG pathway analysis of significantly upregulated genes in apoBD. DEG, differentially expressed genes; GO, gene ontology; h‐BMSC, human bone marrow mesenchymal stem cells.

References

    1. Ampomah, P. B. , Cai, B. , Sukka, S. R. , Gerlach, B. D. , Yurdagul, A., Jr. , Wang, X. , Kuriakose, G. , Darville, L. N. F. , Sun, Y. , Sidoli, S. , Koomen, J. M. , Tall, A. R. , & Tabas, I. (2022). Macrophages use apoptotic cell‐derived methionine and DNMT3A during efferocytosis to promote tissue resolution. Nature Metabolism, 4(4), 444–457. - PMC - PubMed
    1. Atkin‐Smith, G. K. , & Poon, I. K. H. (2017). Disassembly of the dying: Mechanisms and functions. Trends in Cell Biology, 27(2), 151–162. - PubMed
    1. Atkin‐Smith, G. K. , Tixeira, R. , Paone, S. , Mathivanan, S. , Collins, C. , Liem, M. , Goodall, K. J. , Ravichandran, K. S. , Hulett, M. D. , & Poon, I. K. (2015). A novel mechanism of generating extracellular vesicles during apoptosis via a beads‐on‐a‐string membrane structure. Nature Communications, 6, 7439. - PMC - PubMed
    1. Battistelli, M. , & Falcieri, E. (2020). Apoptotic bodies: Particular extracellular vesicles involved in intercellular communication. Biology, 9(1), 21. - PMC - PubMed
    1. Becker, A. , Thakur, B. K. , Weiss, J. M. , Kim, H. S. , Peinado, H. , & Lyden, D. (2016). Extracellular vesicles in cancer: Cell‐to‐cell mediators of metastasis. Cancer Cell, 30(6), 836–848. - PMC - PubMed

LinkOut - more resources