Detecting Hachimoji DNA: An Eight-Building-Block Genetic System with MoS2 and Janus MoSSe Monolayers
- PMID: 38634539
- PMCID: PMC11071042
- DOI: 10.1021/acsami.3c18400
Detecting Hachimoji DNA: An Eight-Building-Block Genetic System with MoS2 and Janus MoSSe Monolayers
Abstract
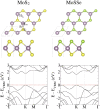
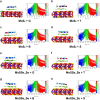
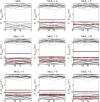
In the pursuit of personalized medicine, the development of efficient, cost-effective, and reliable DNA sequencing technology is crucial. Nanotechnology, particularly the exploration of two-dimensional materials, has opened different avenues for DNA nucleobase detection, owing to their impressive surface-to-volume ratio. This study employs density functional theory with van der Waals corrections to methodically scrutinize the adsorption behavior and electronic band structure properties of a DNA system composed of eight hachimoji nucleotide letters adsorbed on both MoS2 and MoSSe monolayers. Through a comprehensive conformational search, we pinpoint the most favorable adsorption sites, quantifying their adsorption energies and charge transfer properties. The analysis of electronic band structure unveils the emergence of flat bands in close proximity to the Fermi level post-adsorption, a departure from the pristine MoS2 and MoSSe monolayers. Furthermore, leveraging the nonequilibrium Green's function approach, we compute the current-voltage characteristics, providing valuable insights into the electronic transport properties of the system. All hachimoji bases exhibit physisorption with a horizontal orientation on both monolayers. Notably, base G demonstrates high sensitivity on both substrates. The obtained current-voltage (I-V) characteristics, both without and with base adsorption on MoS2 and the Se side of MoSSe, affirm excellent sensing performance. This research significantly advances our understanding of potential DNA sensing platforms and their electronic characteristics, thereby propelling the endeavor for personalized medicine through enhanced DNA sequencing technologies.
Keywords: 2D-materials; DNA sensing; MoS2; MoSSe; density functional theory.
Conflict of interest statement
The authors declare the following competing financial interest(s): S.S. and A.R.S. were employed by the company STEMskills Research and Education Lab Private Limited, Faridabad, Haryana, India.
Figures


Similar articles
-
Sensing Hachimoji DNA Bases with Janus MoSH Monolayer Nanodevice: Insights from Density Functional Theory (DFT) and Non-Equilibrium Green's Function Analysis.ACS Omega. 2024 Nov 26;9(49):48173-48184. doi: 10.1021/acsomega.4c05356. eCollection 2024 Dec 10. ACS Omega. 2024. PMID: 39676917 Free PMC article.
-
MoS2 and Janus (MoSSe) based 2D van der Waals heterostructures: emerging direct Z-scheme photocatalysts.Nanoscale Adv. 2021 Mar 18;3(10):2837-2845. doi: 10.1039/d1na00154j. eCollection 2021 May 18. Nanoscale Adv. 2021. PMID: 36134195 Free PMC article.
-
Nanogap-based all-electronic DNA sequencing devices using MoS2 monolayers.Phys Chem Chem Phys. 2020 Dec 7;22(46):27053-27059. doi: 10.1039/d0cp04138f. Phys Chem Chem Phys. 2020. PMID: 33215614
-
Two-dimensional MoS2: A promising building block for biosensors.Biosens Bioelectron. 2017 Mar 15;89(Pt 1):56-71. doi: 10.1016/j.bios.2016.03.042. Epub 2016 Mar 22. Biosens Bioelectron. 2017. PMID: 27037158 Review.
-
Flexible Molybdenum Disulfide (MoS2) Atomic Layers for Wearable Electronics and Optoelectronics.ACS Appl Mater Interfaces. 2019 Mar 27;11(12):11061-11105. doi: 10.1021/acsami.8b19859. Epub 2019 Mar 18. ACS Appl Mater Interfaces. 2019. PMID: 30830744 Review.
Cited by
-
Flexible Nanostructured NiS-Based Electrochemical Biosensor for Simultaneous Detection of DNA Nucleobases.ACS Omega. 2024 Dec 7;10(3):2561-2574. doi: 10.1021/acsomega.4c07106. eCollection 2025 Jan 28. ACS Omega. 2024. PMID: 39895750 Free PMC article.
-
Sensing Hachimoji DNA Bases with Janus MoSH Monolayer Nanodevice: Insights from Density Functional Theory (DFT) and Non-Equilibrium Green's Function Analysis.ACS Omega. 2024 Nov 26;9(49):48173-48184. doi: 10.1021/acsomega.4c05356. eCollection 2024 Dec 10. ACS Omega. 2024. PMID: 39676917 Free PMC article.
References
-
- He S.; Song B.; Li D.; Zhu C.; Qi W.; Wen Y.; Wang L.; Song S.; Fang H.; Fan C. A Graphene Nanoprobe for Rapid, Sensitive, and Multicolor Fluorescent DNA Analysis. Adv. Funct. Mater. 2010, 20 (3), 453–459. 10.1002/adfm.200901639. - DOI
-
- Kumar S. Epigenomics of Plant Responses to Environmental Stress. Epigenomes 2018, 2 (1), 6.10.3390/epigenomes2010006. - DOI
MeSH terms
Substances
LinkOut - more resources
Full Text Sources

