. 2024 Jul;476(7):1087-1107.
doi: 10.1007/s00424-024-02957-6. Epub 2024 Apr 18.

SubSol-HIe is an AMPK-dependent hypoxia-responsive subnucleus of the nucleus tractus solitarius that coordinates the hypoxic ventilatory response and protects against apnoea in mice

Affiliations

SubSol-HIe is an AMPK-dependent hypoxia-responsive subnucleus of the nucleus tractus solitarius that coordinates the hypoxic ventilatory response and protects against apnoea in mice

Sandy MacMillan et al. Pflugers Arch. 2024 Jul.

Abstract

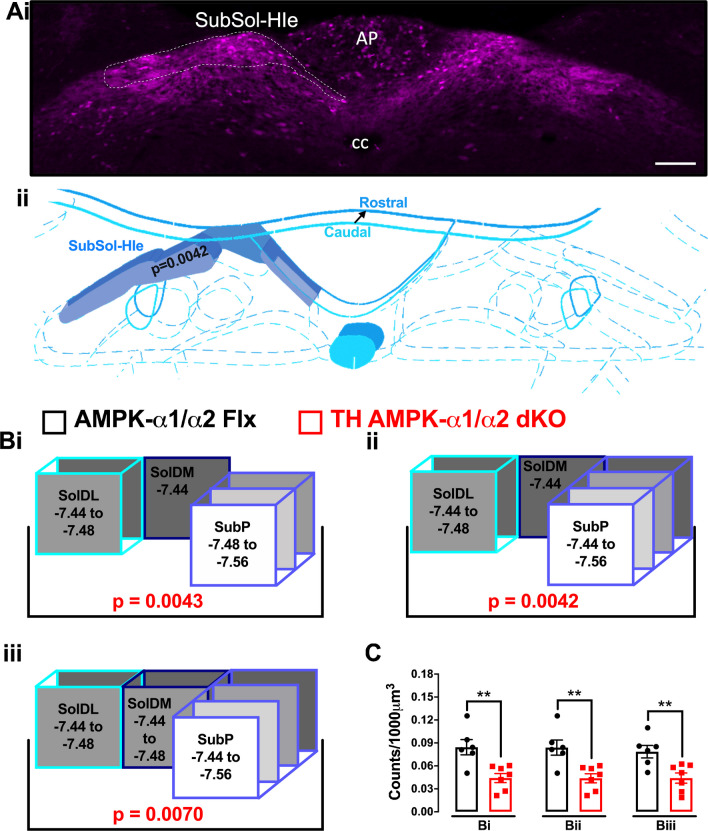
Functional magnetic resonance imaging (fMRI) suggests that the hypoxic ventilatory response is facilitated by the AMP-activated protein kinase (AMPK), not at the carotid bodies, but within a subnucleus (Bregma -7.5 to -7.1 mm) of the nucleus tractus solitarius that exhibits right-sided bilateral asymmetry. Here, we map this subnucleus using cFos expression as a surrogate for neuronal activation and mice in which the genes encoding the AMPK-α1 (Prkaa1) and AMPK-α2 (Prkaa2) catalytic subunits were deleted in catecholaminergic cells by Cre expression via the tyrosine hydroxylase promoter. Comparative analysis of brainstem sections, relative to controls, revealed that AMPK-α1/α2 deletion inhibited, with right-sided bilateral asymmetry, cFos expression in and thus activation of a neuronal cluster that partially spanned three interconnected anatomical nuclei adjacent to the area postrema: SolDL (Bregma -7.44 mm to -7.48 mm), SolDM (Bregma -7.44 mm to -7.48 mm) and SubP (Bregma -7.48 mm to -7.56 mm). This approximates the volume identified by fMRI. Moreover, these nuclei are known to be in receipt of carotid body afferent inputs, and catecholaminergic neurons of SubP and SolDL innervate aspects of the ventrolateral medulla responsible for respiratory rhythmogenesis. Accordingly, AMPK-α1/α2 deletion attenuated hypoxia-evoked increases in minute ventilation (normalised to metabolism), reductions in expiration time, and increases sigh frequency, but increased apnoea frequency during hypoxia. The metabolic response to hypoxia in AMPK-α1/α2 knockout mice and the brainstem and spinal cord catecholamine levels were equivalent to controls. We conclude that within the brainstem an AMPK-dependent, hypoxia-responsive subnucleus partially spans SubP, SolDM and SolDL, namely SubSol-HIe, and is critical to coordination of active expiration, the hypoxic ventilatory response and defence against apnoea.

Keywords: AMPK; Active expiration; Apnoea; Catecholaminergic; Hypoxia; Hypoxic ventilatory response; NTS.


Conflict of interest statement

The authors declare no competing interests.

Figures

Fig. 1
Fig. 1
The effect of deleting AMPK-α1/α2 catalytic subunits in catecholaminergic cells on the hypoxic ventilatory response and total dorsal brainstem cFos expression during hypoxia. Ai Representative photomicrographs of cFos-positive (black) nuclei in the caudal brainstem of AMPK-α1/α2 floxed mice following 60 min exposures to, upper panel, 21% O2 and, lower panel 8% O2. Approximate Bregma -7.56 mm. In this and all subsequent figures, AP = area postrema, cc = central canal, SubP, subpostrema nucleus, SolC = commissural division, SolM = medial nucleus, SolDL = dorsolateral nucleus, SolIM = intermediate nucleus, SolCe, central nucleus, SolI = interstitial nucleus, SolV = ventral nucleus, SolVL = ventrolateral nucleus, SolL = lateral nucleus. Scale bar = 100 μm. Aii Exemplar image on the left shows whole brainstem section (right, R; left, L; Scale bar, 300 μM) with the area spanning SolDL, SolDM, SolCe, SolV and SolIM. Middle and righthand panels show high-resolution images (scale bars, 50 μM) of neurons from the same section that are double labelled for cFos + nuclei and tyrosine hydroxylase, proximal to SolDL. B Means ± SEM for changes in whole NTS cFos counts (per 1000 μm3) in AMPK-α1/α2 floxed (AMPK-α1/α2 Flx, black) and TH-driven AMPK-α1/α2 double knockout mice (TH AMPK-α1/α2 dKO, red) exposed to room air (21% O2, shaded bars; controls: n = 4, knockouts: n = 4) or 60 min of 8% O2 (empty bars; controls: n = 6, knockouts: n = 7). ns = not significant, *p < 0.05, ****p < 0.0001. C Means ± SEM for the % change relative to normoxia (green dotted line) in (i) minute ventilation, (ii) breathing frequency and (iii) tidal volume during 60-min exposures to severe hypoxia (8% O2) for whole minute averages in AMPK-α1/α2 Flx mice (black, n = 5 mice) and TH AMPK-α1/α2 dKO (red, n = 4 mice). ns = not significant, *p < 0.05, **p < 0.01, ***p < 0.001, ****p < 0.0001. Significance tested for each 5-min block by Student’s t-test between genotypes
Fig. 2
Fig. 2
A map of the hypoxia-responsive subnucleus of the nucleus tractus solitarius as revealed by deficient cFOS expression following AMPK-α1/α2 deletion in catecholaminergic cells. Ai Exemplar confocal fluorescence image of brainstem section through the dorsal nucleus tractus solitarius (NTS) at the level of the area postrema (AP) and central canal (cc; approximate Bregma -7.44 mm) from a mouse line with TH-Cre driven expression of tdTomato (excitation 555 nm, emission 582 nm) from the Rosa26 locus. White dotted line indicates the approximate location of the AMPK-dependent hypoxia-responsive subnucleus of the NTS, named here as SubSol-HIe. Scale bar = 100 μm (see Supplementary Fig. 2 for whole brainstem section). Aii A 3D model of the predicted anatomical location of the hypoxia-responsive subnucleus of the NTS based on the highest degree of statistical significance obtained for comparison of cFOS counts in (BC). B Schematic caudo-rostral (front to back) squares describe the process of mapping by statistical significance different combinations of SolDL, SolDM and SubP by Bregma that may shape the hypoxia-responsive subnucleus of the nucleus tractus solitarius (SubSol-HIe) with the p values shown in red for comparison of counts for cFos positive nuclei of AMPK-α1/α2 knockouts relative to controls. C Bar charts and scatter plots show mean ± SEM of cFos counts (per 1000 μm3) for AMPK-α1/α2 floxed (AMPK-α1/α2 Flx, black, n = 6 mice) versus TH-Cre driven AMPK-α1/α2 knockout mice (TH AMPK-α1/α2 dKO, red, n = 7 mice) for each combination of SolDL, SolDM and SubP by Bregma in (B). **p < 0.01; significance tested by Student’s t-test between genotypes for each grouping
Fig. 3
Fig. 3
AMPK-α1/α2 deletion in catecholaminergic cells attenuates hypoxia-evoked cFos expression in additional nuclei of the nucleus tractus solitarius. Bar charts and scatter plots show means ± SEM for comparison of hypoxia-evoked cFos counts (per 1000 μm3) for additional nuclei of the nucleus tractus solitarius (NTS) in AMPK-α1/α2 floxed (AMPK-α1/α2 Flx, black) versus mice with AMPK-α1/α2 deletion in catecholaminergic cells (TH AMPK-α1/α2 dKO, red). Significant differences were found A for the area postrema (AP, a midline structure) at one Bregma (-7.56), B with left-sided bilateral asymmetry for SolV at two isolated Bregma (-7.64 and -7.44) and SolCe at one Bregma (-7.44) and C bilaterally for 10N at one Bregma (-7.44). AP = area postrema; SolV = ventral subnucleus; SolCe = central subnucleus; 10N = dorsal motornucleus of the vagus. *p < 0.05, **p < 0.01; significance tested by Student’s t-test between genotypes for each grouping
Fig. 4
Fig. 4
Deletion of AMPK-α1/α2 in catecholaminergic cells inhibits hypoxia-evoked reductions in expiration time and attenuates sigh frequency during the hypoxic ventilatory response. A Ratiometric changes relative to normoxia (green dotted line) of expiration time (mean ± SEM) during 10-min exposures to severe hypoxia (8% O2) at three selected time points (left) and at 2-s intervals (right) for AMPK-α1/α2 floxed mice (AMPK-α1/α2 Flx, black, n = 54 exposures from 21 mice) and for mice with AMPK-α1/α2 deletion in catecholaminergic neurons (TH-AMPK-α1/α2 dKO, red, n = 37 exposures from 15 mice). B Bar charts and scatter plots show mean ± SEM for sigh frequency during the first and second half (left) and every 60 s (right) during 10 min exposures to 8% O2 for AMPK-α1/α2 Flx (n = 58 exposures from 25 mice) and TH-AMPK-α1/α2 dKO mice (n = 46 exposures from 22 mice). ns = not significant, *p < 0.05, **p < 0.01, ***p < 0.001, ****p < 0.0001. Significance tested by two-way ANOVA with Sidak post hoc tests
Fig. 5
Fig. 5
Hypoxia induces periodic salvos of apnoeas in mice with conditional deletion of AMPK-α1/α2 in catecholaminergic cells. Bar charts and scatter plots show mean ± SEM for the A apnoeic index (apnoeas min−1), B apnoea duration (msec) and C apnoea-duration index during the first and second 5-min blocks of 10-min exposures to hypoxia (left), and (right) whole minute averages during 60-min exposures to severe hypoxia (8% O2) in AMPK-α1/α2 floxed mice (AMPK-α1/α2 Flx, black, 10 min: n = 58 exposures from 25 mice, 60 min: n = 6 mice) and in mice with AMPK-α1/α2 deletion in catecholaminergic cells (TH-AMPK-α1/α2 dKO, red, 10 min: n = 46 exposures from 22 mice, 60 min: n = 4 mice). *p < 0.05, **p < 0.01, ***p < 0.001, ****p < 0.0001. Significance tested by Student’s t-tests (left panels) and two-way ANOVA with Sidak post hoc tests (right panels)
Fig. 6
Fig. 6
Metabolic responses during hypoxia are unaffected by AMPK-α1/α2 deletion in catecholaminergic cells. Bar charts and scatter plots show means ± SEM for A oxygen consumption (VO2) and B carbon dioxide production (VCO2) during (i) normoxia (21% O2), (ii) before (0) and during 5–10 min of 8% O2 and (iii) 5-min exposures to graded hypoxia (21% O2, 18% O2, 15% O2, 12% O2, 10% O2, 8% O2) in AMPK-α1/α2 wildtype mice (WT; black, 21% O2 n = 11 mice; 8% O2 n = 9 mice; graded hypoxia, n = 11 mice) and in mice with AMPK-α1/α2 deletion in catecholaminergic cells (TH-AMPK-α1/α2 dKO, red, 21% O2 n = 12 mice; 8% O2 n = 10 mice; graded hypoxia: n = 12 mice). Significance tested by Student’s t-tests between genotypes (Ai and Bi) and two-way ANOVA with Sidak post hoc tests (all other graphs)
Fig. 7
Fig. 7
Ventilatory equivalents for oxygen and carbon dioxide during normoxia and acute exposure to hypoxia. Bar charts and scatter plots show Means ± SEM for A ventilatory equivalent for oxygen (VE/VO2) and B ventilatory equivalent for carbon dioxide (VE/VCO2) during (i) normoxia (21% O2), (ii) before (0) and during 5–10 min of 8% O2, (iii) before (21% O2) and during 8% O2 (average data for 5-10 min), (iv) change in ventilatory equivalent from baseline during minutes 5–10 of 8% O2 and (v) change in ventilatory equivalent from baseline for the average response to 8% O2 in AMPK-α1/α2 wildtype (WT; black, 21% O2 n = 11 mice; 8% O2 n = 9 mice) and in mice with AMPK-α1/α2 deletion in catecholaminergic cells (TH-AMPK-α1/α2 dKO, red, 21% O2 n = 10 mice; 8% O2 n = 9 mice. * = p < 0.05, ** = p < 0.01). Significance tested by Student’s t-tests (Ai, Bi, Av and Bv) and two-way ANOVA with Sidak post hoc tests (all other graphs)
Fig. 8
Fig. 8
Ventilatory equivalents for oxygen and carbon dioxide during normoxia and exposure to graded hypoxia. Bar charts and scatter plots show means ± SEM for A ventilatory equivalent for oxygen (VE/VO2) and B ventilatory equivalent for carbon dioxide (VE/VCO2) during (i) normoxia (21% O2; 5 min) and the final minute of a 5-min exposure to 18%, 15%, 12%, 10% and 8% O2 and (ii) change in ventilatory equivalent from baseline in AMPK-α1/α2 wildtype mice (WT; black, n = 10) and in mice with AMPK-α1/α2 deletion in catecholaminergic cells (TH-AMPK-α1/α2 dKO, red, 21% O2: n = 10 mice. *p < 0.05. Significance tested by two-way ANOVA with Sidak post hoc tests
Fig. 9
Fig. 9
Deletion of AMPK-α1/α2 catalytic subunits in catecholaminergic cells did not alter bioamine content of the brainstem or spinal cord. Bar charts and scatter plots show mean ± SEM of bioamine levels within the A brainstem and B spinal cord of AMPK-α1/α2 wildtype (WT; black, n = 11 mice) and in mice with AMPK-α1/α2 deletion in catecholaminergic cells (TH AMPK-α1/α2 dKO, red, n = 12 mice). 5-HIAA = 5-hydroxyindoleacetic acid. Significance tested by Student’s t-test between genotypes for each bioamine

Similar articles

Cited by

  • Adaptive PRKAA1 variant in Andeans is associated with improved ventilation and sleep phenotypes.
    Lawrence ES, Gu W, Kong MC, Fassardi S, Anza-Ramirez C, Moya EA, Heinrich EC, Yu JJ, Orr JE, Cao SY, Sanchez-Azofra A, Cole AM, Hall JE, Lin A, DeYoung PN, Vizcardo-Galindo G, Macarlupu JL, Figueroa-Mujíca R, Bermudez D, Corante N, Cavalleri GL, Gaio E, Evans AM, Powell FL, Malhotra A, Salem RM, Villafuerte FC, Simonson TS. Lawrence ES, et al. iScience. 2025 Jun 16;28(8):112911. doi: 10.1016/j.isci.2025.112911. eCollection 2025 Aug 15. iScience. 2025. PMID: 40703441 Free PMC article.

References

    1. Abdala AP, Rybak IA, Smith JC, Paton JF. Abdominal expiratory activity in the rat brainstem-spinal cord in situ: patterns, origins and implications for respiratory rhythm generation. J Physiol. 2009;587:3539–3559. doi: 10.1113/jphysiol.2008.167502. - DOI - PMC - PubMed
    1. Ahmadi M, Roy R. AMPK acts as a molecular trigger to coordinate glutamatergic signals and adaptive behaviours during acute starvation. Elife. 2016;5:e16349. doi: 10.7554/eLife.16349. - DOI - PMC - PubMed
    1. Alheid GF, Jiao W, McCrimmon DR. Caudal nuclei of the rat nucleus of the solitary tract differentially innervate respiratory compartments within the ventrolateral medulla. Neuroscience. 2011;190:207–227. doi: 10.1016/j.neuroscience.2011.06.005. - DOI - PMC - PubMed
    1. Altamirano AE, Wilson CG. An overview of developmental dysregulation of autonomic control in infants. Birth Defects Res. 2021 doi: 10.1002/bdr2.1855. - DOI - PubMed
    1. Andersen MN, Skibsbye L, Tang C, Petersen F, MacAulay N, Rasmussen HB, Jespersen T. PKC and AMPK regulation of Kv1.5 potassium channels. Channels. 2015;9:121–128. doi: 10.1080/19336950.2015.1036205. - DOI - PMC - PubMed

Substances

LinkOut - more resources