. 2024 Apr 23;121(17):e2317402121.
doi: 10.1073/pnas.2317402121. Epub 2024 Apr 18.

Microglia-derived extracellular vesicles trigger age-related neurodegeneration upon DNA damage

Affiliations

Microglia-derived extracellular vesicles trigger age-related neurodegeneration upon DNA damage

Ermioni S Arvanitaki et al. Proc Natl Acad Sci U S A. .

Abstract

DNA damage and neurodegenerative disorders are intimately linked but the underlying mechanism remains elusive. Here, we show that persistent DNA lesions in tissue-resident macrophages carrying an XPF-ERCC1 DNA repair defect trigger neuroinflammation and neuronal cell death in mice. We find that microglia accumulate dsDNAs and chromatin fragments in the cytosol, which are sensed thereby stimulating a viral-like immune response in Er1Cx/- and naturally aged murine brain. Cytosolic DNAs are packaged into extracellular vesicles (EVs) that are released from microglia and discharge their dsDNA cargo into IFN-responsive neurons triggering cell death. To remove cytosolic dsDNAs and prevent inflammation, we developed targeting EVs to deliver recombinant DNase I to Er1Cx/- brain microglia in vivo. We show that EV-mediated elimination of cytosolic dsDNAs is sufficient to prevent neuroinflammation, reduce neuronal apoptosis, and delay the onset of neurodegenerative symptoms in Er1Cx/- mice. Together, our findings unveil a causal mechanism leading to neuroinflammation and provide a rationalized therapeutic strategy against age-related neurodegeneration.

Keywords: DNA damage; extracellular vesicles; microglia; neurodegeneration.


Conflict of interest statement

Competing interests statement:The authors declare no competing interest.

Figures
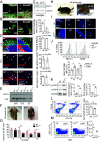
Fig. 1.
Fig. 1.
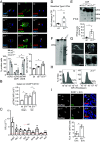
Loss of ERCC1 in tissue-resident macrophages triggers progressive ataxia in mice. Cx3cr1-Cre-driven Rosa-YFP expression in (A), brain cryosections and (B) in isolated microglia. (C) Western blotting of ERCC1 protein in whole-cell extracts from the Percoll fraction of brains for the enrichment of microglia. GAPDH was used as a loading control. The graph represents ERCC1 protein levels normalized to GAPDH in Er1Cx/−samples compared to corresponding wt controls. (D) Immunofluorescence staining of (i). ERCC1 and CALBINDIN (CALB) in mouse cerebella (indicated by the arrows). The numbers indicate the average percentage of ERCC1+ CALB+ ± SEM in Er1Cx/− and wt cerebella (n > 70 cells per genotype). (ii and iii) ERCC1 in cortex and spinal cord cryosections (indicated by the arrows). The numbers indicate the ERCC1 Mean Fluorescence Intensity (MFI) of DAPI+ nuclei (n > 5 optical fields per genotype). Arrows indicate ERCC1+ cells. Single-channel images are shown in SI Appendix, Fig. S1D. (E) Western blotting of ERCC1 protein in whole-cell extracts from different CNS areas. TUBULIN (TUB) was used as loading control. Graph is shown in SI Appendix, Fig. S1E. (F) A photograph of a 32-wk-old Er1Cx/− mouse and its control littermate depicting the hind limb paralysis developed in Er1Cx/− mice. (G) A graph depicting the latency to fall (seconds on the rotating rod) during rotarod assessment of the motor coordination of 3-, 6-, 8, and 12-mo-old Er1Cx/− mice and littermate wt controls, n = 6 mice per group (H). A photograph showing the kyphosis developed in 40-wk-old Er1Cx/− mice. (I) MAC1 immunofluorescent staining of microglia cells (indicated by arrows) in CER, CTX, HIP, and SC cryosections of Er1Cx/− and wt mice. Wider optical fields of the same pictures are shown in SI Appendix, Fig. S1F. (J) Activation status of Percoll-isolated microglia from Er1Cx/− mice and wt littermates. The histograms overlay MHC-II and CD86 expression of CD11b+CD45lo microglia cells (gating strategy shown in SI Appendix, Fig. S3A) from wt and Er1Cx/− brains. Isotype controls are indicated with a gray dotted line. The graph shows the respective MFIs. (K) Western blotting of total STAT1 and phospho-STAT1 protein in whole-cell extracts from microglia enriched Percoll fraction of brain tissue. GAPDH was used as loading control. The graph represents t-STAT1 and pSTAT1 protein levels normalized to GAPDH in Er1Cx/− samples compared to corresponding wt controls. (L) Flow cytometry analysis of Percoll-purified cells from 6-mo-old brains stained for CD11b and CD45. Representative flow cytometry plots show the gate for microglia, defined as the CD11b+CD45lo population. The graph depicts the percentage of microglia cells in wt and Er1Cx/− littermates. (gating strategy shown in SI Appendix, Fig. S3A). Statistical analysis indicated no significant differences. (M) Flow cytometry analysis of single-cell suspensions from Er1Cx/− and wt mouse brains. The graph depicts the percentage of Ly6C+ cells. Statistical analysis indicated no significant differences. Cerebellum (CER), cortex (CTX), hippocampus (HIP), spinal cord (SC). Error bars indicate SEM among n ≥ 3 replicates, unless otherwise stated. The asterisk indicates the significance set at P-value: *≤0.05, **≤0.01 (two-tailed Student’s t test). Scale bar: 10 μm, unless otherwise stated.
Fig. 2.
Fig. 2.
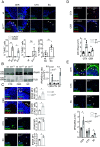
DNA damage triggers the secretion of type I interferon and EVs carrying dsDNA. (A) Immunofluorescence detection of cGAS and dsDNA in cultured untreated wt, etoposide-treated wt, and untreated Er1Cx/− microglia. The graph depicts the percentage of cells with cytoplasmic cGAS+, cGAS+/DAPI+ or dsDNA+/cGAS+ structures and the dsDNA MFI in cultured untreated and etoposide-treated wt and Er1Cx/− microglia. (B) The graph depicts the expression of pSTING (MFI) in pSTING+ microglia in the brains or spinal cords (SC) of 6-mo-old Er1Cx/− and wt mice, purified with Percoll (n = 3 to 4). Microglia gating and representative histogram plots are shown in SI Appendix, Fig. S6F. (C) Quantitative PCR evaluation of the mRNA levels of interferon signature genes in the brain lysates of 6-mo-old wt and Er1Cx/− mice (as indicated; RFU: relative fluorescent units). (D) Type I IFN bioactivity (B16 reporter assay OD fold change) in 6-mo-old Er1Cx/− and age-matched wt brain lavages (n = 4). (E) Western blotting of IFN-β protein in CSF samples. Same volumes of CSF were used in each genotype. The graph represents IFN-β protein levels in wt and Er1Cx/− samples. (F) EVs isolated from 15 μL wt and Er1Cx/− CSF were subjected to phenol-chloroform DNA extraction, acrylamide gel electrophoresis, and EtBr staining. Experiment was repeated three times. (G) Scanning (i and ii) and Transmission (iii and iv) electron microscope images of circulating EVs purified from wt and Er1Cx/− brain lavages. The energy-dispersive-X ray spectra from Er1Cx/− EVs measured by the scanning electron microscope (ii) are shown in SI Appendix, Fig. S8E. (H) Flow cytometry analysis of purified EVs stained for CD11b and PicoGreen™. EVs were gated for CD11b (n = 3). A representative graph is presented in SI Appendix, Fig. S8F. (I) Immunofluorescence detection of PicoGreen in SH-SHY neurons incubated with wt and Er1Cx/− EVs, prestained with ExoFlow and PicoGreen. The cytoplasm of SH-SHY cells was labeled with Nestin. The arrows indicate ExoFlow-stained and/or PicoGreen-stained EVs. The graph depicts the percentage of PicoGreen+ SH-SHY neuron cells. Error bars indicate SEM among n ≥ 3 replicates. Error bars indicate SEM among n ≥ 3 replicates. The asterisk indicates the significance set at P-value: *≤0.05, **≤0.01 (two-tailed Student’s t test). (Scale bar: 5 μm.)
Fig. 3.
Fig. 3.
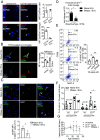
Aged microglia elicit an antiviral-like response that leads to neuronal cell death. (A) Immunofluorescence detection of TUNEL+ cells in the cerebellum (CER), cortex (CTX), and the periphery of spinal cord (SC). Arrows indicate only TUNEL+ nuclei in the corresponding CNS regions of Er1Cx/− mice. The graphs depict the percentage of TUNEL+CALB+ or TUNEL+PAX6+ cells against the total number of CALB+ or PAX6+ cells (CER) and the percentage of TUNEL+DAPI+ cells against the total number of nuclei (CTX and SC) (n = 3 animals, n > 7 optical fields per mouse). Single channel images are shown in SI Appendix, Fig. S9D. (B) Western blotting of IFNAR protein in whole-cell extracts of CNS areas. TUBULIN (TUB) was used as a loading control. The graph represents the IFNAR densitometry analysis normalized to TUB. (C) Immunofluorescence detection of IFNAR in PAX6+ and CALBINDIN+ cells from cerebellar cryosections and in cryosections of cortices and spinal cords of Er1Cx/− and wt mice. Arrows indicate the cytoplasmic and membranous localization of IFNAR signal. The graphs depict the IFNAR MFI in indicated cell populations and areas (n > 7 optical fields per genotype). Single channel images are shown in SI Appendix, Fig. S10C. (D) Immunofluorescence detection of IFN-β in cryosections of different CNS regions from Er1Cx/− and wt mice injected intraperitoneally with Brefeldin A. Arrows indicate IFN-β-positive cells in the corresponding CNS regions. The graph depicts the IFN-β MFI in indicated areas. Immunofluorescence detection of IFN-β in MAC1+ cells after Brefeldin A treatment is shown in SI Appendix, Fig. S10D. (E) Immunofluorescence detection of dsDNA in cryosections from different CNS regions of Er1Cx/− and wt mice. Arrows indicate dsDNA+ cells in the corresponding regions. The graph depicts the dsDNA MFI in indicated areas. Single channel images are shown in SI Appendix, Fig. S11A. Error bars indicate SEM among n ≥ 3 replicates. The asterisk indicates the significance set at P-value: *≤0.05, **≤0.01 (two-tailed Student’s t test). (Scale bar: 10 μm.)
Fig. 4.
Fig. 4.
CD11b-ligand decorated NIH-derived EVs loaded with DNase I preferentially target microglia cells ameliorating the antiviral-like response and neuronal cell death in Er1Cx/− mice. (A) Immunofluorescence detection of ExoFlow prestained EVs with or without CD11b-ligand decoration after intranasal administration in wt mice. Arrows indicate CD11b+ExoFlow+ or CD11b ExoFlow+ cells. Graphs depict the percentage of CD11b+ExoFlow+ or CD11bExoFlow+ cells. (n > 1,000 cells counted in at least four optical fields each derived from three mice). (B) Immunofluorescence detection of MAC1, cGAS, and dsDNA in etoposide-treated wt microglia. Microglia was cultured in the presence of CD11b-ligand decorated EVs loaded with or without DNase (naïve EVs). The graph depicts cytoplasmic cGAS and dsDNA MFI in ETO-treated microglia cultured in the presence of naïve or DNase I-loaded EVs. (C) Immunofluorescence detection of dsDNA and MAC1 in brain cryosections of Er1Cx/− mice treated with DNase I-loaded or naïve EVs (30 Units of DNase I/administration, 12 to 30 intranasal instillations, once every 3 d). (n = 3) (D) Type I IFN bioactivity in the lavage of Er1Cx/−mouse brains after intranasal administration of DNase I-loaded or naive EVs (12 intranasal instillations) (n = 4) (E) Flow cytometry analysis of brain single-cell suspensions stained for CD11b, MHC-II, and CD86. The graph depicts the percentage of MHC-II+CD86+ microglial cells of 18-wk-old wt mice treated with naïve EVs and Er1Cx/− mice treated with DNase I-loaded or naive EVs (12 intranasal instillations). Gating strategy for microglia is shown in SI Appendix, Fig. S14B. (F) The graph depicts flow cytometry analysis of brain single-cell suspensions isolated from 18-wk-old Er1Cx/− or wt mice treated with DNase I-loaded or naive EVs stained for Annexin V and PI (as indicated, 12 intranasal instillations). Representative graphs are shown in SI Appendix, Fig. S14D. (G) Line graph depicting the motor coordination ability (latency to fall from the rod during rotarod assessment) of 3-mo-old wt mice receiving naïve EVs and Er1Cx/− mice receiving DNase I-loaded or naïve EVs for a time period of 15 wk (30 intranasal instillations). The respective graph showing wt mice treated with DNase I EVs is shown in SI Appendix, Fig. S14E. (n = 4). Error bars indicate SEM among n ≥ 3 replicates. The asterisk indicates the significance set at P-value: *≤0.05, **≤0.01 (two-tailed Student’s t test).

References

    1. Adamec E., Vonsattel J. P., Nixon R. A., DNA strand breaks in Alzheimer’s disease. Brain Res. 849, 67–77 (1999). - PubMed
    1. Nunomura A., et al. , Oxidative damage is the earliest event in Alzheimer disease. J. Neuropathol. Exp. Neurol. 60, 759–767 (2001). - PubMed
    1. Alam Z. I., et al. , Oxidative DNA damage in the parkinsonian brain: An apparent selective increase in 8-hydroxyguanine levels in substantia nigra. J. Neurochem. 69, 1196–1203 (1997). - PubMed
    1. Maiuri T., et al. , DNA damage repair in huntington’s disease and other neurodegenerative diseases. Neurotherapeutics 16, 948–956 (2019). - PMC - PubMed
    1. Bogdanov M., et al. , Increased oxidative damage to DNA in ALS patients. Free Radic. Biol. Med. 29, 652–658 (2000). - PubMed

LinkOut - more resources