. 2024 Jul 15;84(14):2231-2246.
doi: 10.1158/0008-5472.CAN-23-2627.

CRISPR-Cas9 Screening Identifies KRAS-Induced COX2 as a Driver of Immunotherapy Resistance in Lung Cancer

Affiliations

CRISPR-Cas9 Screening Identifies KRAS-Induced COX2 as a Driver of Immunotherapy Resistance in Lung Cancer

Jesse Boumelha et al. Cancer Res. .

Abstract

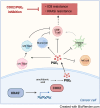
Oncogenic KRAS impairs antitumor immune responses. As effective strategies to combine KRAS inhibitors and immunotherapies have so far proven elusive, a better understanding of the mechanisms by which oncogenic KRAS drives immune evasion is needed to identify approaches that could sensitize KRAS-mutant lung cancer to immunotherapy. In vivo CRISPR-Cas9 screening in an immunogenic murine lung cancer model identified mechanisms by which oncogenic KRAS promotes immune evasion, most notably via upregulation of immunosuppressive COX2 in cancer cells. Oncogenic KRAS potently induced COX2 in both mouse and human lung cancer, which was suppressed using KRAS inhibitors. COX2 acted via prostaglandin E2 (PGE2) to promote resistance to immune checkpoint blockade (ICB) in lung adenocarcinoma. Targeting COX2/PGE2 remodeled the tumor microenvironment by inducing proinflammatory polarization of myeloid cells and influx of activated cytotoxic CD8+ T cells, which increased the efficacy of ICB. Restoration of COX2 expression contributed to tumor relapse after prolonged KRAS inhibition. These results provide the rationale for testing COX2/PGE2 pathway inhibitors in combination with KRASG12C inhibition or ICB in patients with KRAS-mutant lung cancer. Significance: COX2 signaling via prostaglandin E2 is a major mediator of immune evasion driven by oncogenic KRAS that promotes immunotherapy and KRAS-targeted therapy resistance, suggesting effective combination treatments for KRAS-mutant lung cancer.


Conflict of interest statement

S. de Carné Trécesson reports personal fees from Revolution Medicines outside the submitted work. K. Litchfield reports other support from Isomorphic Labs, personal fees from Monopteros Therapeutics, Ellipses Pharma, Kynos Therapeutics, and SAGA Diagnostics, and grants from Genesis Therapeutics and Cancer ResearchUK/ONO PHARMA/LifeArc IO Alliance outside the submitted work. J. Downward reports grants, personal fees, and nonfinancial support from AstraZeneca, personal fees from Vividion, Jubilant, Theras, and Roche, and grants and nonfinancial support from Bristol Myers Squibb and Revolution Medicines outside the submitted work. No disclosures were reported by the other authors.

Figures
None
Graphical abstract
Figure 1.
Figure 1.
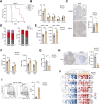
In vivo CRISPR–Cas9 screen identifies regulators of antitumor immunity. A, Schematic of pooled CRISPR–Cas9 screen. B, sgRNAs targeting genes depleted in vitro compared with nontarget controls. The CRISPR score is defined as the average log2-fold change in abundance of sgRNA reads at day 28 (in vitro) vs. day 0 (in vitro) for each gene. C, sgRNAs targeting Cflar and Zeb1 depleted in vivo in immunocompetent and immunodeficient mice. D, Average log2-fold change in abundance of sgRNA reads for all genes in immunocompetent (WT) vs. Rag2−/−;Il2rg−/− mice. E and F, Enrichment of sgRNAs targeting Ifngr2 (E) and depletion of sgRNAs targeting Ptgs2 (F) in WT vs. Rag2−/−;Il2rg−/− mice. Data are represented as mean ± SEM for C, E, and F. G and H, Kaplan–Meier survival of immunocompetent or Rag2−/−;Il2rg−/− mice following orthotopic transplantation with KPAR cells and Ifngr2−/− cells (G) or Ptgs2−/− cells ( n = 5–10 per group; H). Analysis of survival curves was carried out using the log-rank (Mantel–Cox) test. ***, P < 0.001; ****, P < 0.0001.
Figure 2.
Figure 2.
Tumor-intrinsic COX2 suppresses antitumor immunity. A, Kaplan–Meier survival of mice treated with 200 μg anti-NK1.1 and/or 200 μg anti-CD8 or corresponding isotype control (n = 5–7 per group) after orthotopic transplantation of Ptgs2/ cells. Treatment was initiated 3 days before transplantation and was administered once weekly until endpoint. Analysis of survival curves was carried out using the log-rank (Mantel–Cox) test. B, Frequency of tumor-infiltrating T-cell populations and NK cells in KPAR and Ptgs2/ orthotopic tumors. C, Quantification and representative IHC staining for NKp46+ NK cells. Scale bar, 100 μm. D, Stacked bar plots showing frequency of central memory (Tcm—CD44+CD62L+), effector memory (Tem—CD44+CD62L), and naïve (CD44CD62L+) CD8+ (left) and CD4+ (right) T cells. E, Surface expression (mean fluorescence intensity, MFI) of CD44 on CD8+ (left) and CD4+ (right) T cells. F, Surface expression (mean fluorescence intensity) of CD86 (left) and MHC II (right) on CD11b+ macrophages and CD11c+ macrophages. G, Percentage of Arg1+ CD11b+ macrophages. H, Quantification and representative IHC staining for the immunosuppressive macrophage marker Arg1. Scale bar, 100 μm. I, Representative flow cytometry plots of CD206 and MHC II surface expression on CD11b+ macrophages (left) and quantification of the M1/M2 ratio based on the gated populations (right). J, Heatmap showing hierarchical clustering of KPAR and Ptgs2−/− tumors based on mRNA expression of antitumor immunity genes assessed by qPCR. Data are represented as mean ± SEM for B–I, n = 6–9 per group. Symbols represent pooled tumors from individual mice. Statistics were calculated by paired, two-tailed Student t test (B, C, and E–I) or two-way ANOVA, FDR 0.05 (D). *, P < 0.05; **, P < 0.01; ***, P < 0.001; ****, P < 0.0001.
Figure 3.
Figure 3.
COX2/PGE2 signaling hinders response to ICB in mouse and human lung adenocarcinoma. A, Kaplan–Meier survival of mice treated intraperitoneally with 200 μg anti-PD1 after orthotopic transplantation of KPAR or Ptgs2/ cells, n = 6–8 per group. Analysis of survival curves was carried out using the log-rank (Mantel–Cox) test. B, Quantification and representative IHC staining of CD8+ T cells in KPAR or Ptgs2/ orthotopic tumors on day 7 after treatment with anti-PD1 or corresponding isotype control (IgG). Scale bar, 100 μm. C, Percentage of CD69+ CD8+ T cells in KPAR or Ptgs2/ tumors treated as shown in B. D, Frequency of PD1+, LAG3+, and TIM3+ CD8+ T cells in KPAR or Ptgs2/ tumors treated as shown in B. E, Heatmap showing hierarchical clustering of KPAR or Ptgs2/ tumors treated as shown in B based on mRNA expression of antitumor immunity genes assessed by qPCR. F, Baseline COX-IS levels in responder (R) and nonresponder (NR) ICB-treated patients with lung adenocarcinoma. G, Progression-free survival of patients with lung adenocarcinoma treated with ICB, stratified into highest and lowest quartile based on COX-IS expression. H, Multivariate Cox regression analysis for the indicated variables in patients with lung adenocarcinoma following ICB treatment. CTx, chemotherapy. Error bars represent 95% confidence interval (CI) boundaries. Data are represented as mean ± SEM for B–D, n = 5–9 per group. Statistics were calculated using two-tailed Student t test (F) or one-way ANOVA, FDR 0.05 (B–D). ns, not significant; *, P < 0.05; **, P < 0.01; ***, P < 0.001; ****, P < 0.0001.
Figure 4.
Figure 4.
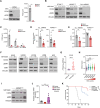
COX2 inhibition enhances the efficacy of immunotherapy. A, Surface expression [mean fluorescence intensity (MFI)] of CD86 (left) and MHC II (right) on CD11b+ macrophages and CD11c+ macrophages in KPAR tumors treated for 7 days with 30 mg/kg celecoxib. B–D, Percentage of Arg1+ CD11b+ macrophages (B), quantification of M1/M2 macrophages (C), and frequency of CD69+ CD8+ T cells (D) in KPAR tumors treated as shown in A. E, Kaplan–Meier survival of mice treated intraperitoneally with 200 μg anti-PD1 and/or daily oral gavage of 30 mg/kg celecoxib after orthotopic transplantation of KPAR cells. Daily celecoxib treatment was initiated on day 7 and anti-PD1 began on day 10 and was administered twice weekly for a maximum of 3 weeks. Data from two independent experiments, n = 15–16 per group. Analysis of survival curves was carried out using the log-rank (Mantel–Cox) test. F, Quantification of CD8+ T cells by IHC in KPAR tumors treated for 7 days with celecoxib and/or anti-PD1. G, CD8+ T-cell phenotypes in KPAR tumors treated as shown in F. Tcm, central memory CD8+ T cells (CD44+CD62L+); Tem, effector memory CD8+ T cells (CD44+CD62L). H, mRNA expression by qPCR of antitumor immunity genes in KPAR tumors treated as shown in F. Data are represented as mean ± SEM (A–D and F–H), n = 5–10 per group. Samples were analyzed using unpaired, two-tailed Student t test (A–D), one-way ANOVA, FDR 0.05 (F and H), or two-way ANOVA, FDR 0.05 (G). ns, not significant; *, P < 0.05; **, P < 0.01; ***, P < 0.001; ****, P < 0.0001.
Figure 5.
Figure 5.
Dual inhibition of EP2 and EP4 synergizes with ICB. A–C, M1/M2 macrophage ratio (A), percentage of Arg1+ CD11b+ TAMs (B), and percentage of CD69+ CD8+ T cells (C) in KPAR tumors treated twice daily for 7 days with 100 mg/kg TPST-1495. D, Kaplan–Meier survival of mice treated intraperitoneally with 200 μg anti-PD1 and/or twice daily oral gavage of 100 mg/kg TPST-1495 after orthotopic transplantation of KPAR cells, n = 8–12 mice per group. TPST-1495 treatment was initiated on day 7 and anti-PD1 began on day 10 and was administered twice weekly for a maximum of 3 weeks. Analysis of survival curves was carried out using the log-rank (Mantel–Cox) test. E, Heatmap showing hierarchical clustering of KPAR tumors treated for 7 days with TPST-1495 and/or anti-PD1 based on mRNA expression of antitumor immunity genes assessed by qPCR. F, mRNA expression by qPCR of immune-related genes in KPAR tumors treated as shown in E. Data are represented as mean ± SEM for A–C and F, n = 7–8 mice per group. Statistics were calculated using unpaired, two-tailed Student t test (A–C) or one-way ANOVA, FDR 0.05 (F). ns, not significant; *, P < 0.05; **, P < 0.01; ***, P < 0.001; ****, P < 0.0001.
Figure 6.
Figure 6.
Oncogenic KRAS drives immunosuppressive COX2 expression in lung adenocarcinoma. A, Immunoblot for COX2 (left) and ELISA analysis for PGE2 concentration (right) in KPAR cells treated with 10 nmol/L trametinib (MEKi) for 24 hours or 48 hours. B and C, Immunoblot for COX2 (B) and ELISA analysis for PGE2 concentration (C) in KRASG12C mouse cancer cell lines treated with 100 nmol/L MRTX849 for 24 hours or 48 hours. D, COX2 mRNA expression in 3LL ΔNRAS and KPARG12C orthotopic tumors treated for 7 days with 50 mg/kg MRTX849. E, COX2-associated inflammatory signature (COX-IS) assessed by qPCR in 3LL ΔNRAS and KPARG12C orthotopic tumors treated as shown in D. F, Immunoblot for COX2 in human KRASG12C lung cancer cell lines treated with MRTX849 for 24 hours. A549 (KRASG12S) cells were used as the negative control. G, COX2 expression in RAS-low and RAS-high human lung cancer cell lines from the CCLE database. RPKM, reads per kilobase per million mapped reads. H, COX-IS in lung adenocarcinoma samples from TCGA stratified by RAS activity into five different groups, which are associated with specific co-occurring mutations (RAG0, KRAS wild-type; RAG1, KRAS/LKB1; RAG2, KRAS; RAG3, KRAS/TP53; RAG4, KRAS/CDKN2A). I, Immunoblot for COX2 in KPARG12C cells treated for 2, 3, or 5 days with 100 nmol/L MRTX849. J, COX2 mRNA expression in MRTX849 on-treatment and relapsed KPARG12C tumors. K, Kaplan–Meier survival of mice treated with daily oral gavage of 50 mg/kg MRTX849 alone or in combination with 30 mg/kg celecoxib, n = 8–20 per group. Analysis of survival curves was carried out using the log-rank (Mantel–Cox) test. Data are represented as mean ± SEM for A, C–E, and J, n = 8–9 per group. Groups were compared using unpaired, two-tailed Student t test (A, CE, and G) or one-way ANOVA, FDR 0.05 (H and J). *, P < 0.05; **, P < 0.01; ***, P < 0.001; ****, P < 0.0001.

References

    1. Siegel RL, Miller KD, Fuchs HE, Jemal A. Cancer statistics, 2022. CA Cancer J Clin 2022;72:7–33. - PubMed
    1. Wei SC, Duffy CR, Allison JP. Fundamental mechanisms of immune checkpoint blockade therapy. Cancer Discov 2018;8:1069–86. - PubMed
    1. Borghaei H, Paz-Ares L, Horn L, Spigel DR, Steins M, Ready NE, et al. . Nivolumab versus docetaxel in advanced nonsquamous non-small-cell lung cancer. N Engl J Med 2015;373:1627–39. - PMC - PubMed
    1. Reck M, Rodriguez-Abreu D, Robinson AG, Hui R, Csöszi T, Fülöp A, et al. . Pembrolizumab versus chemotherapy for PD-L1-positive non-small-cell lung cancer. N Engl J Med 2016;375:1823–33. - PubMed
    1. Gandhi L, Rodríguez-Abreu D, Gadgeel S, Esteban E, Felip E, De Angelis F, et al. . Pembrolizumab plus chemotherapy in metastatic non-small-cell lung cancer. N Engl J Med 2018;378:2078–92. - PubMed

MeSH terms