. 2024 May 28;43(5):114102.
doi: 10.1016/j.celrep.2024.114102. Epub 2024 Apr 17.

LXR/CD38 activation drives cholesterol-induced macrophage senescence and neurodegeneration via NAD+ depletion

Affiliations

LXR/CD38 activation drives cholesterol-induced macrophage senescence and neurodegeneration via NAD+ depletion

Ryo Terao et al. Cell Rep. .

Abstract

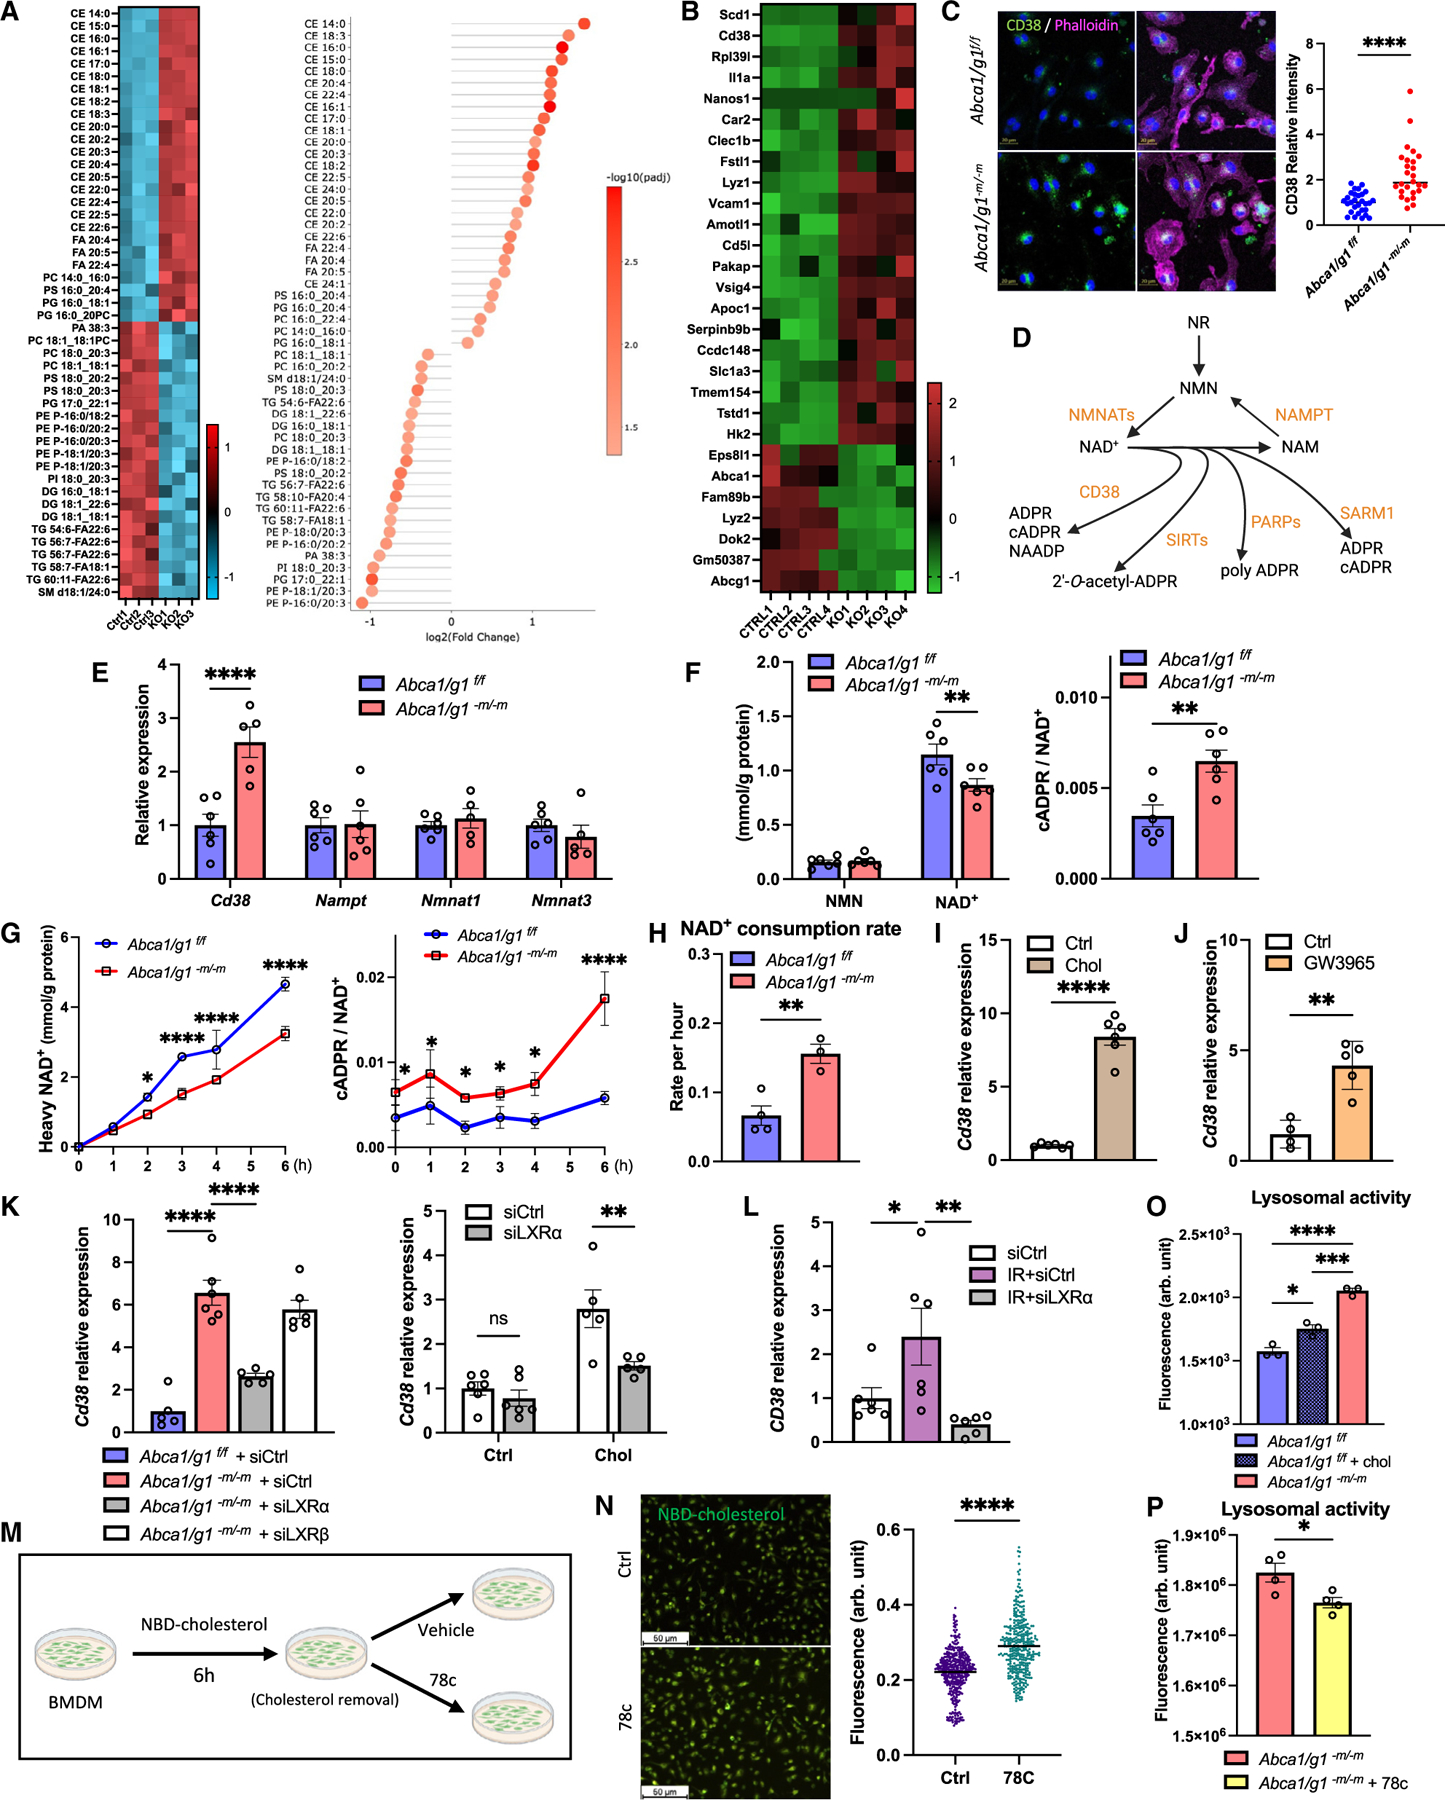
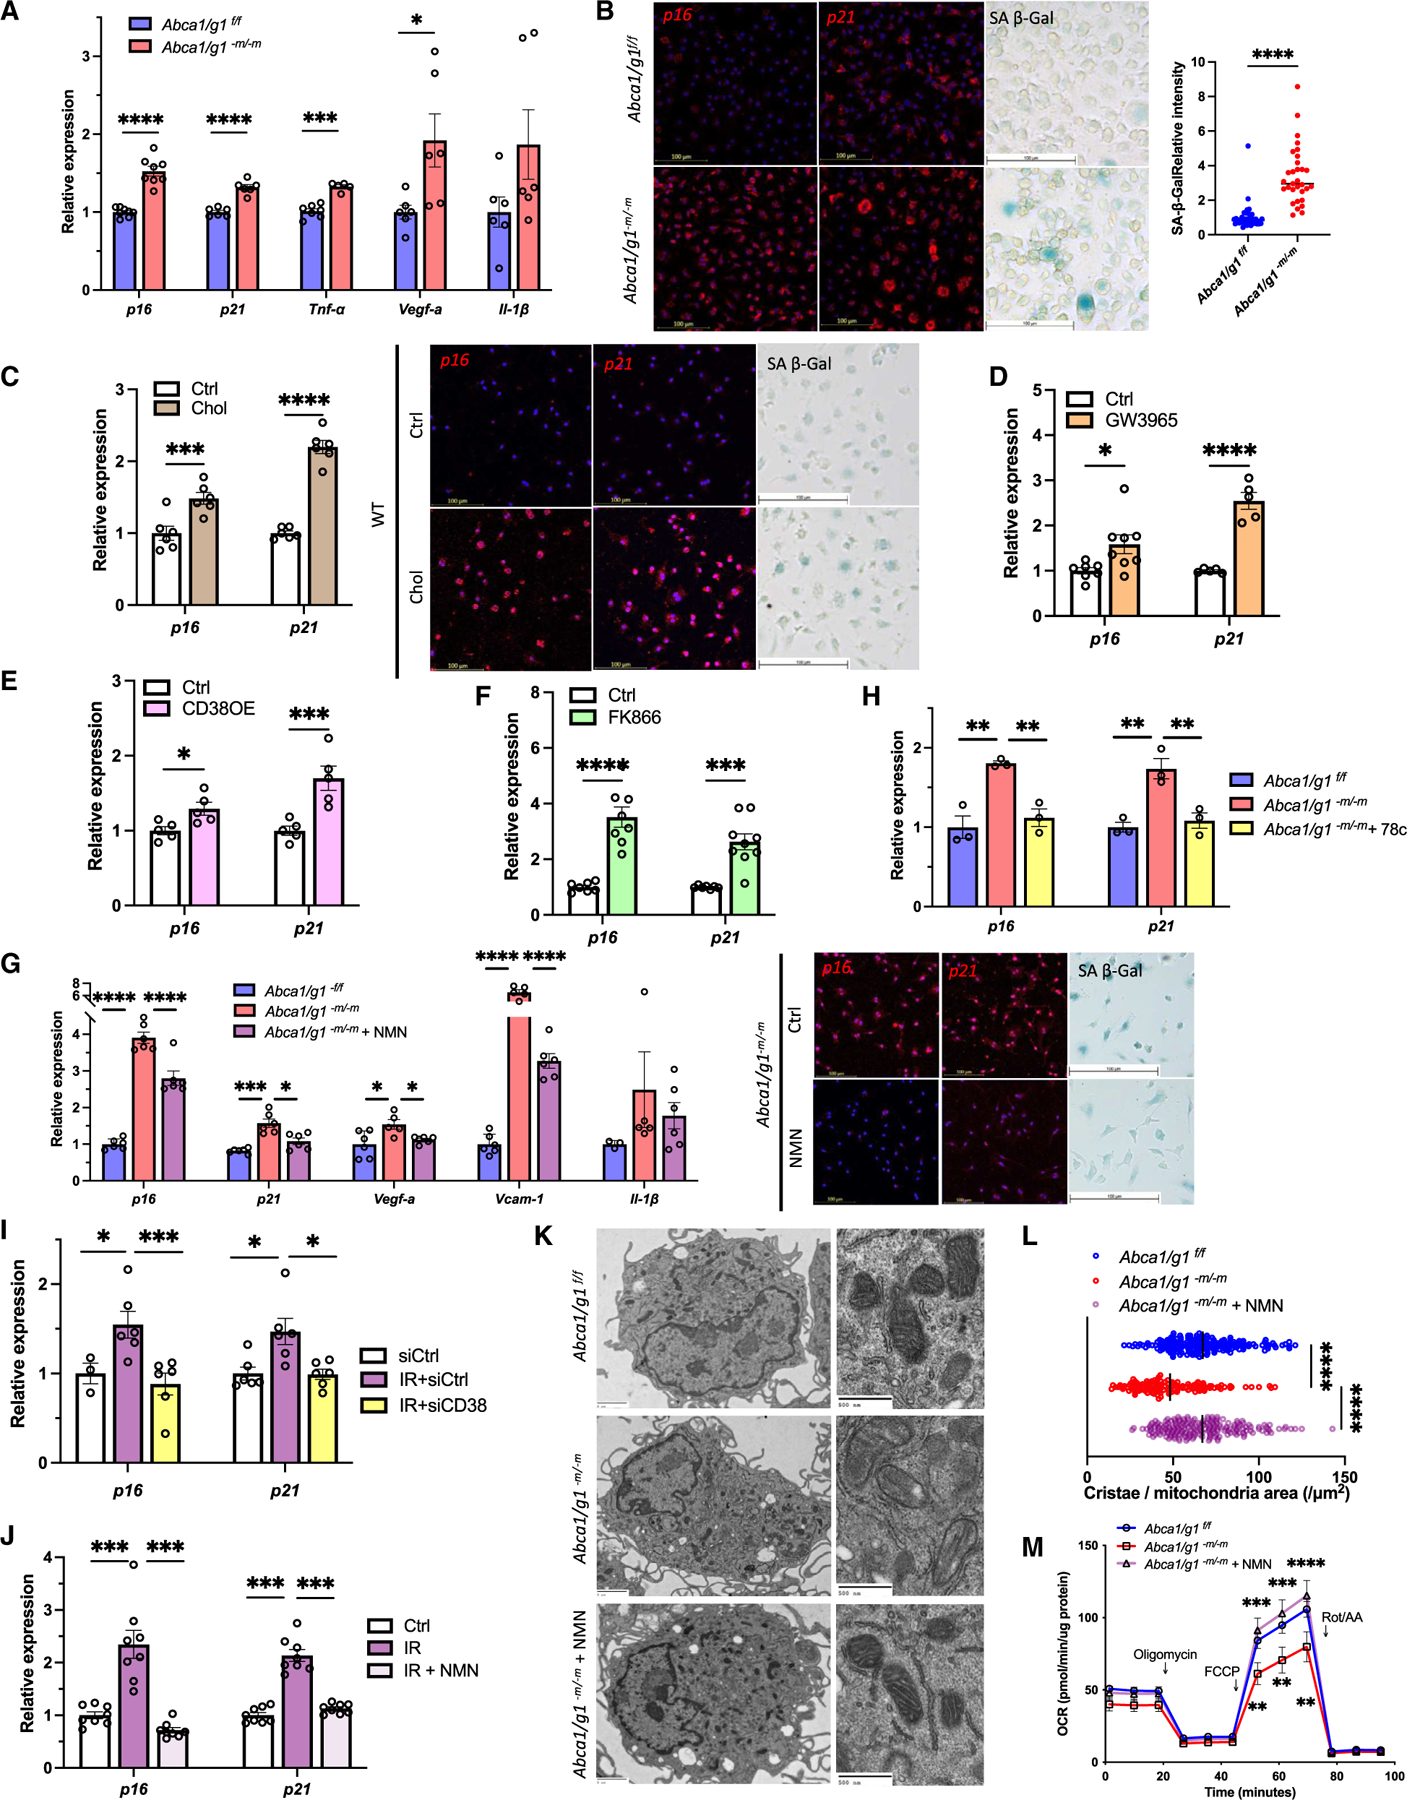
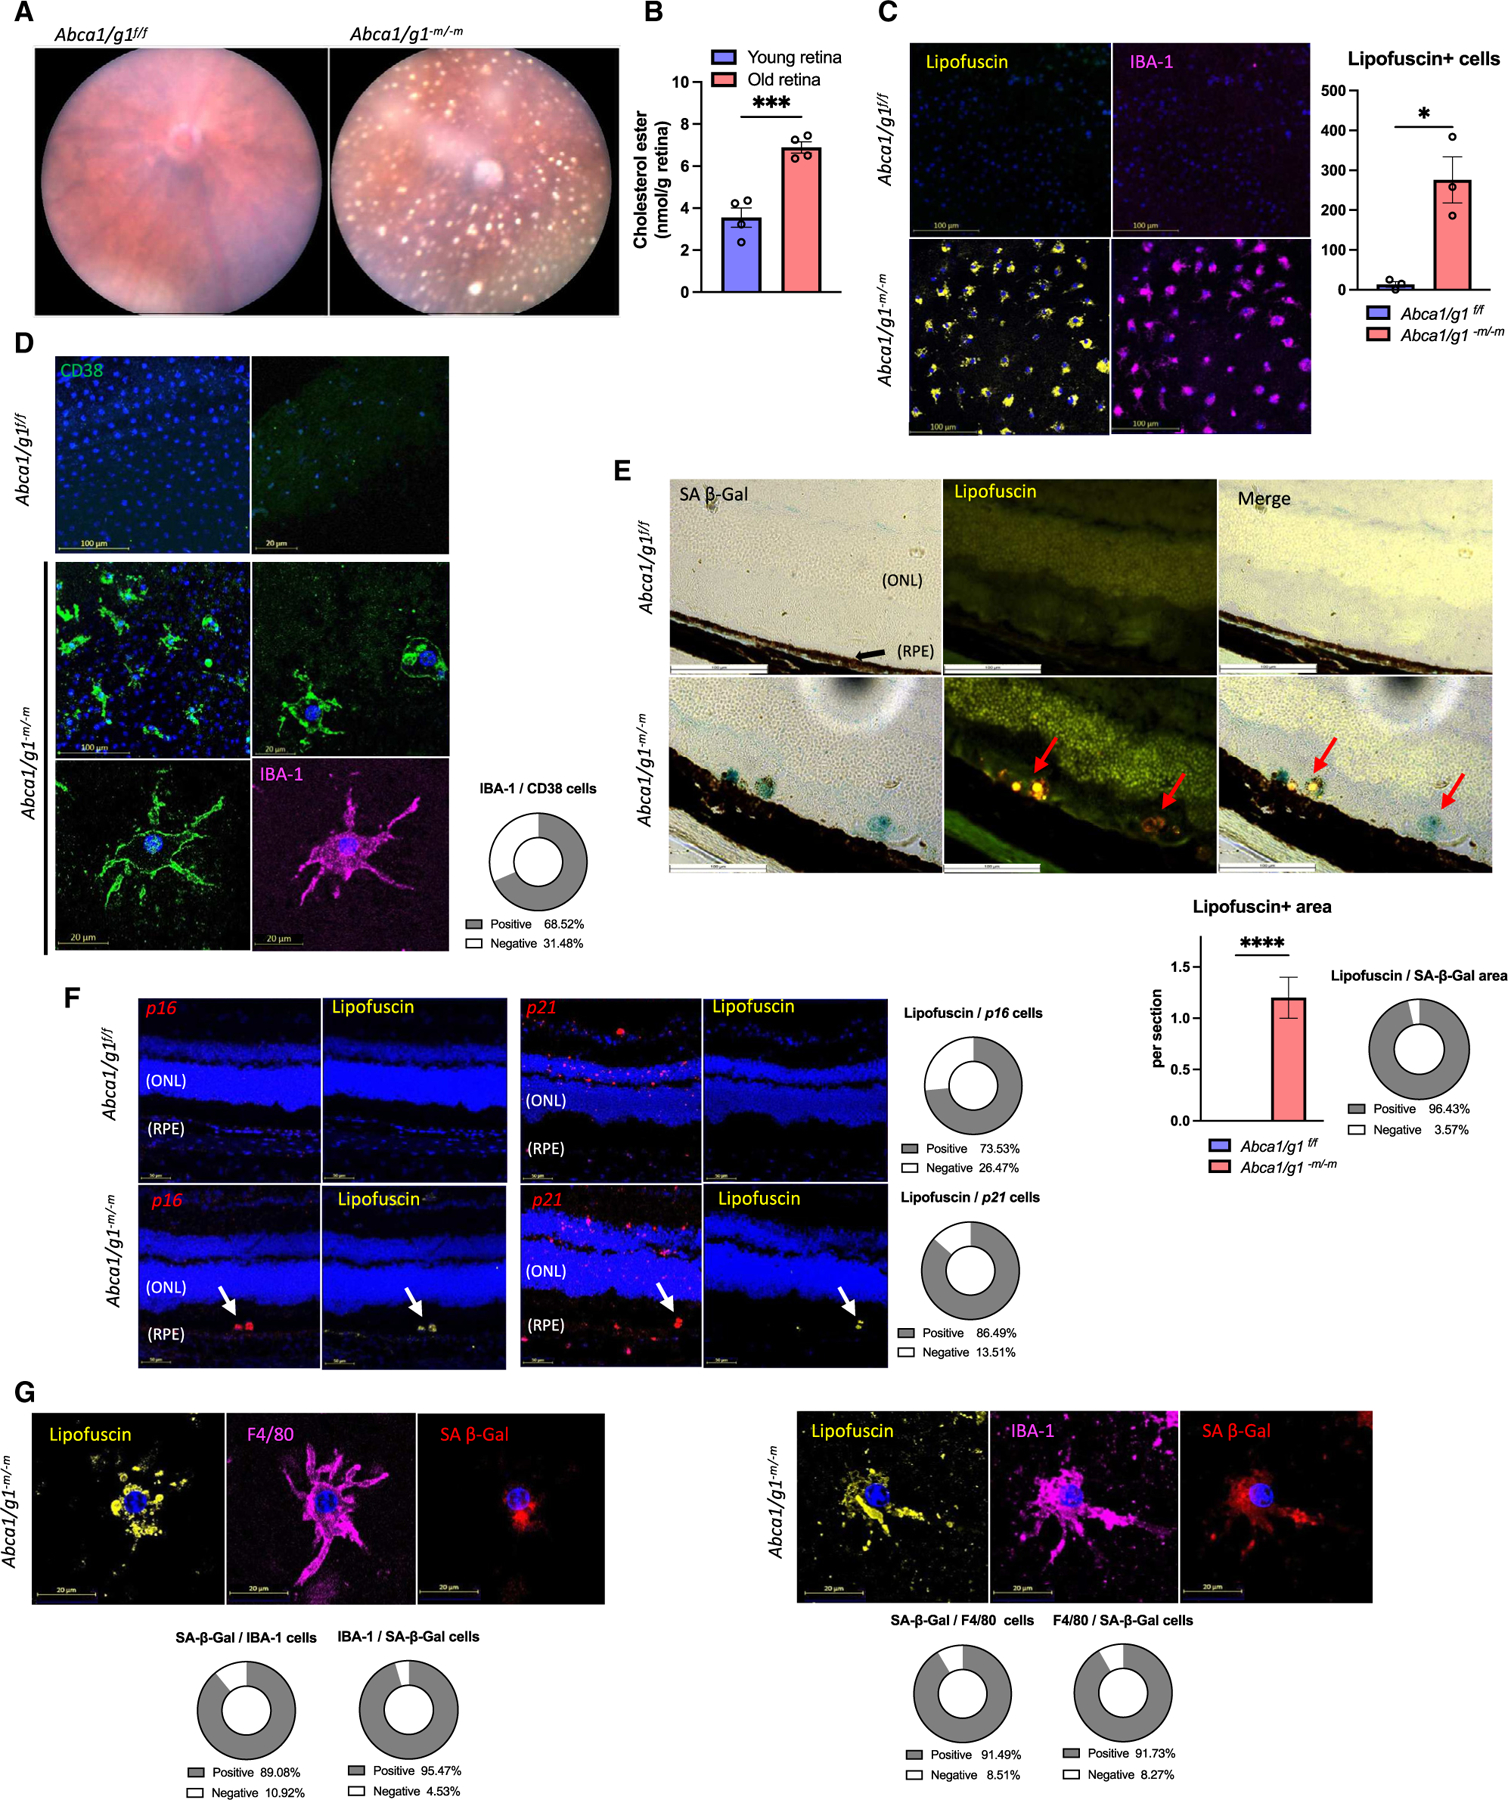
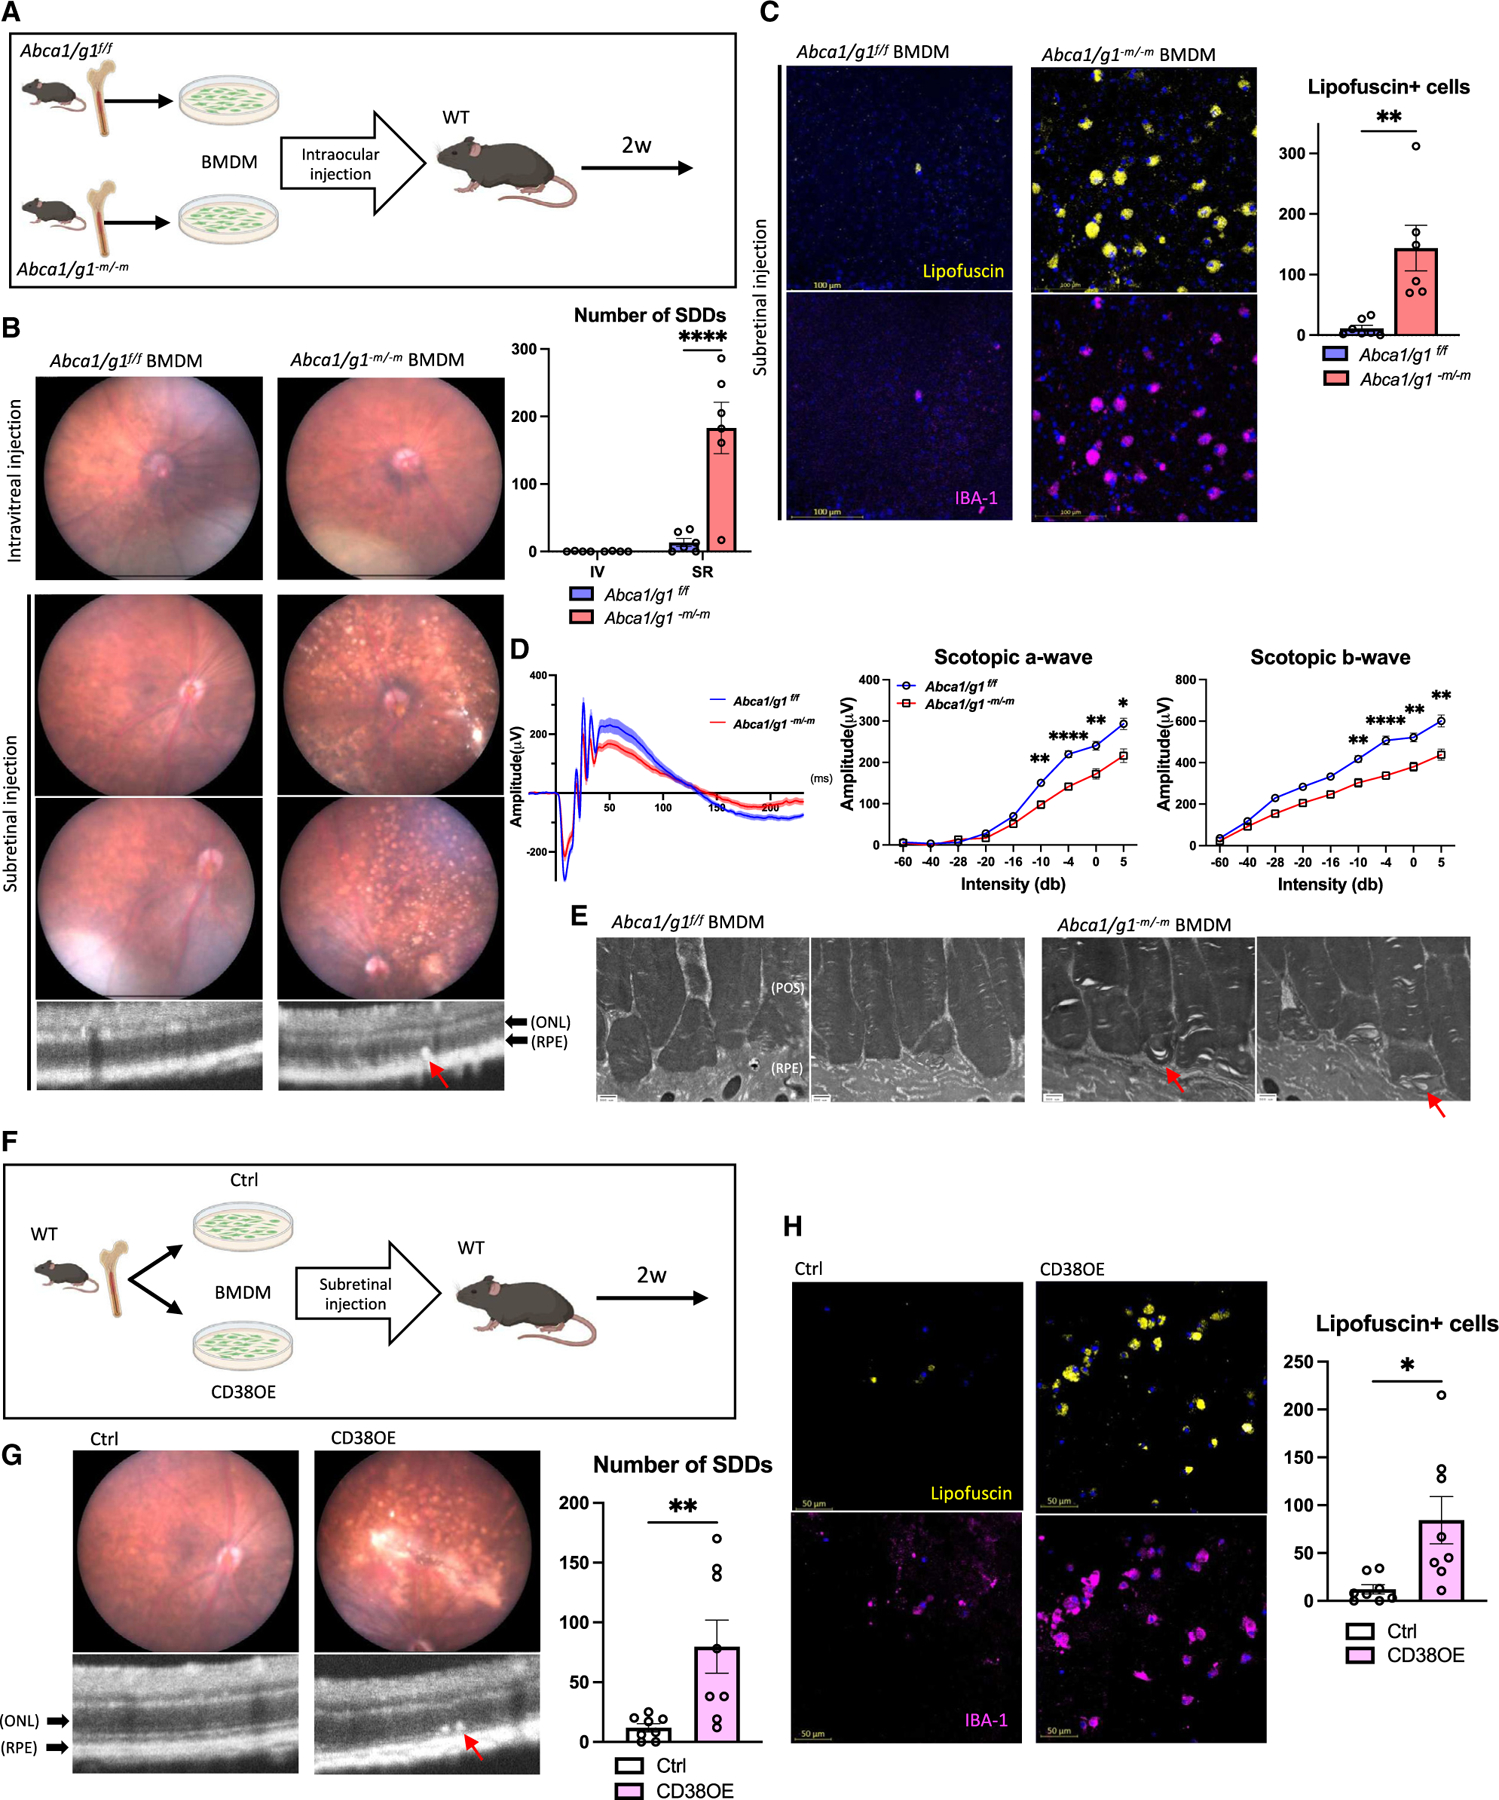
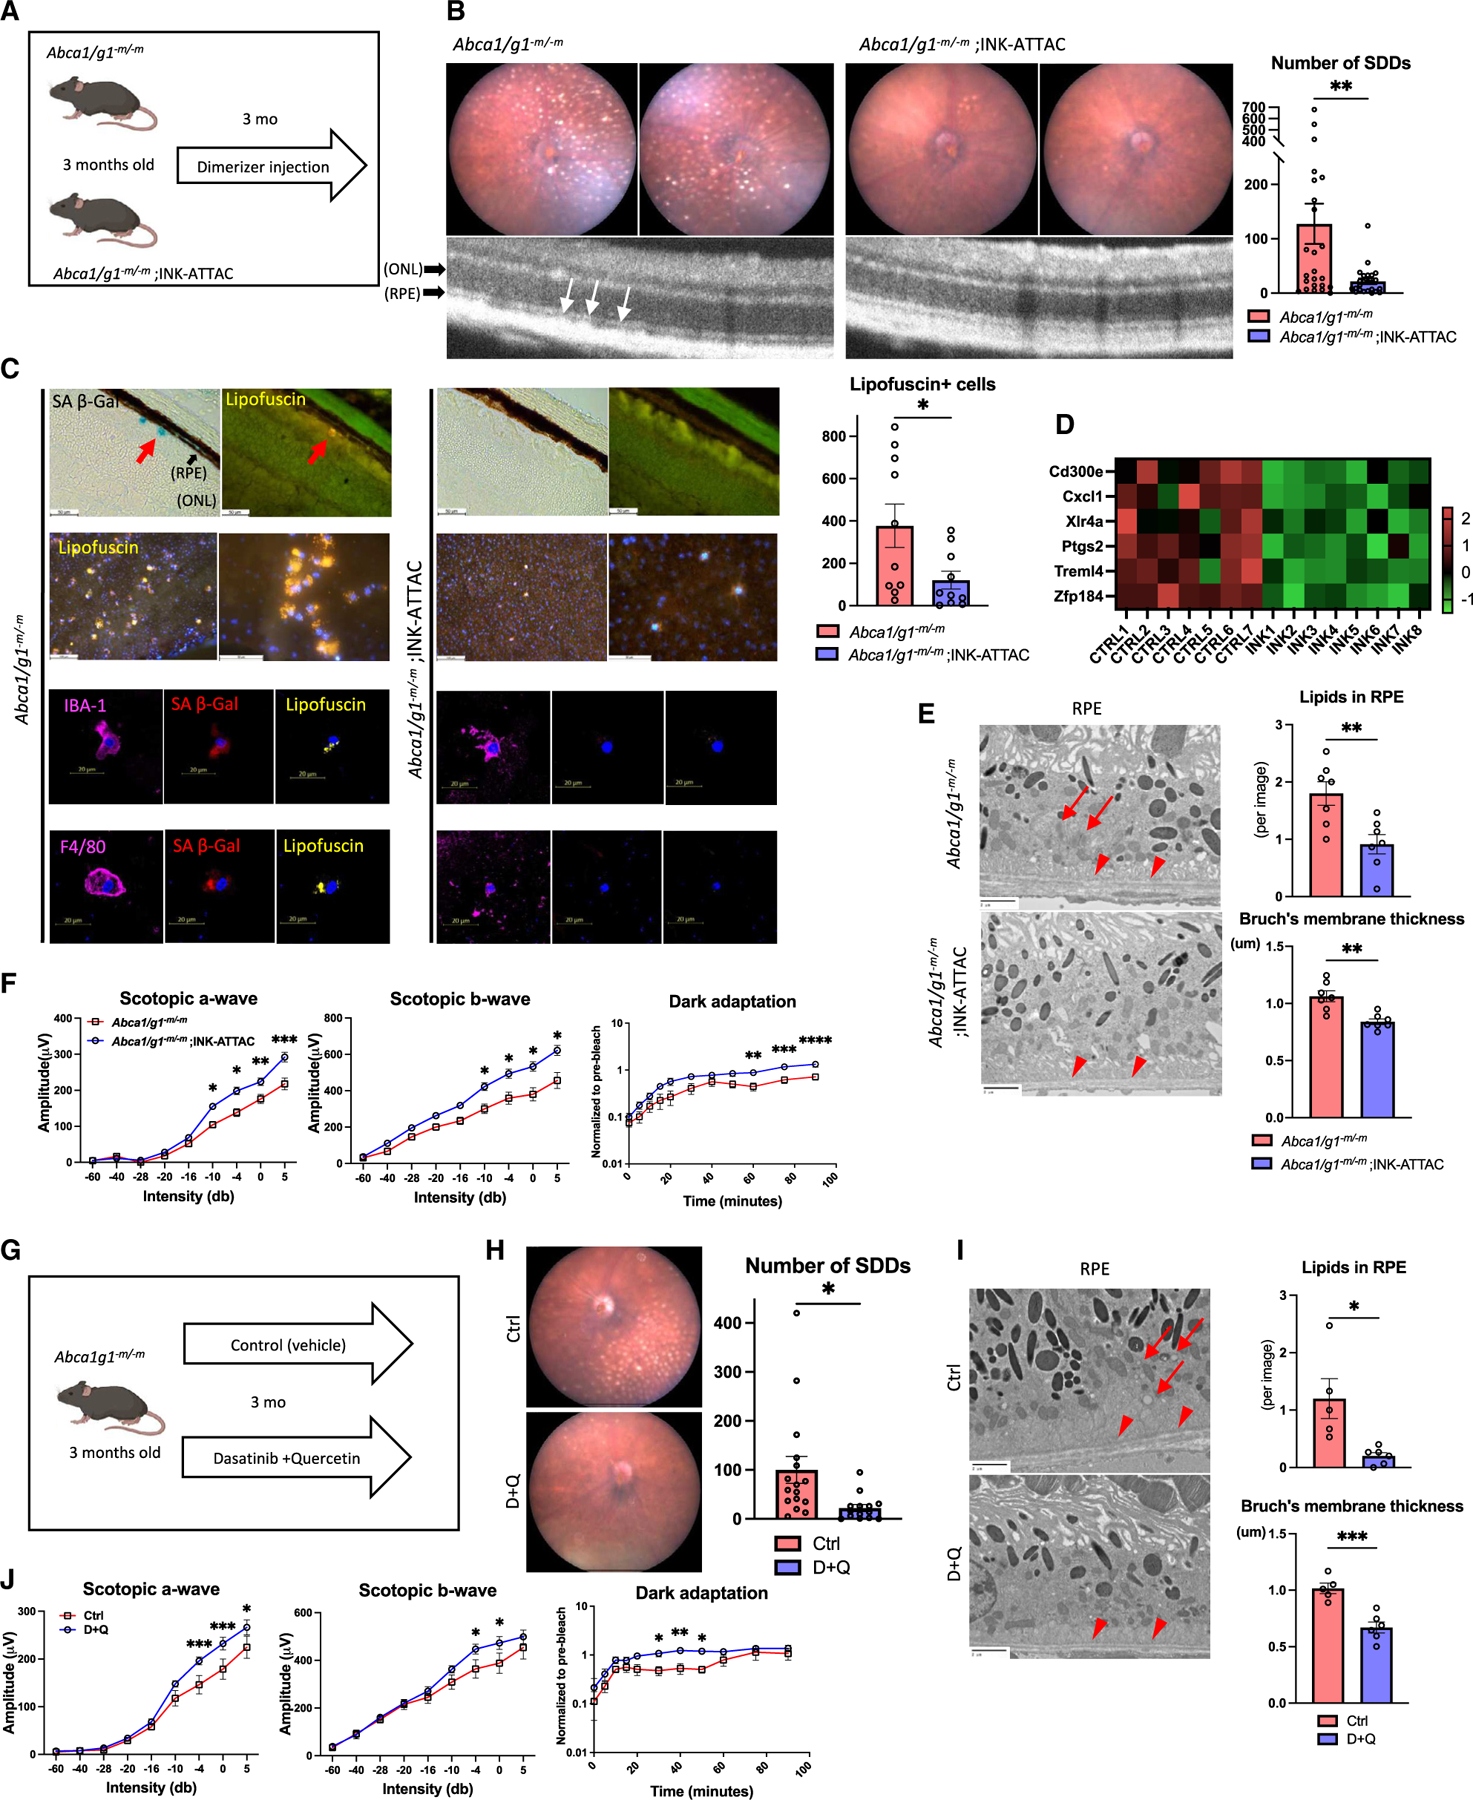
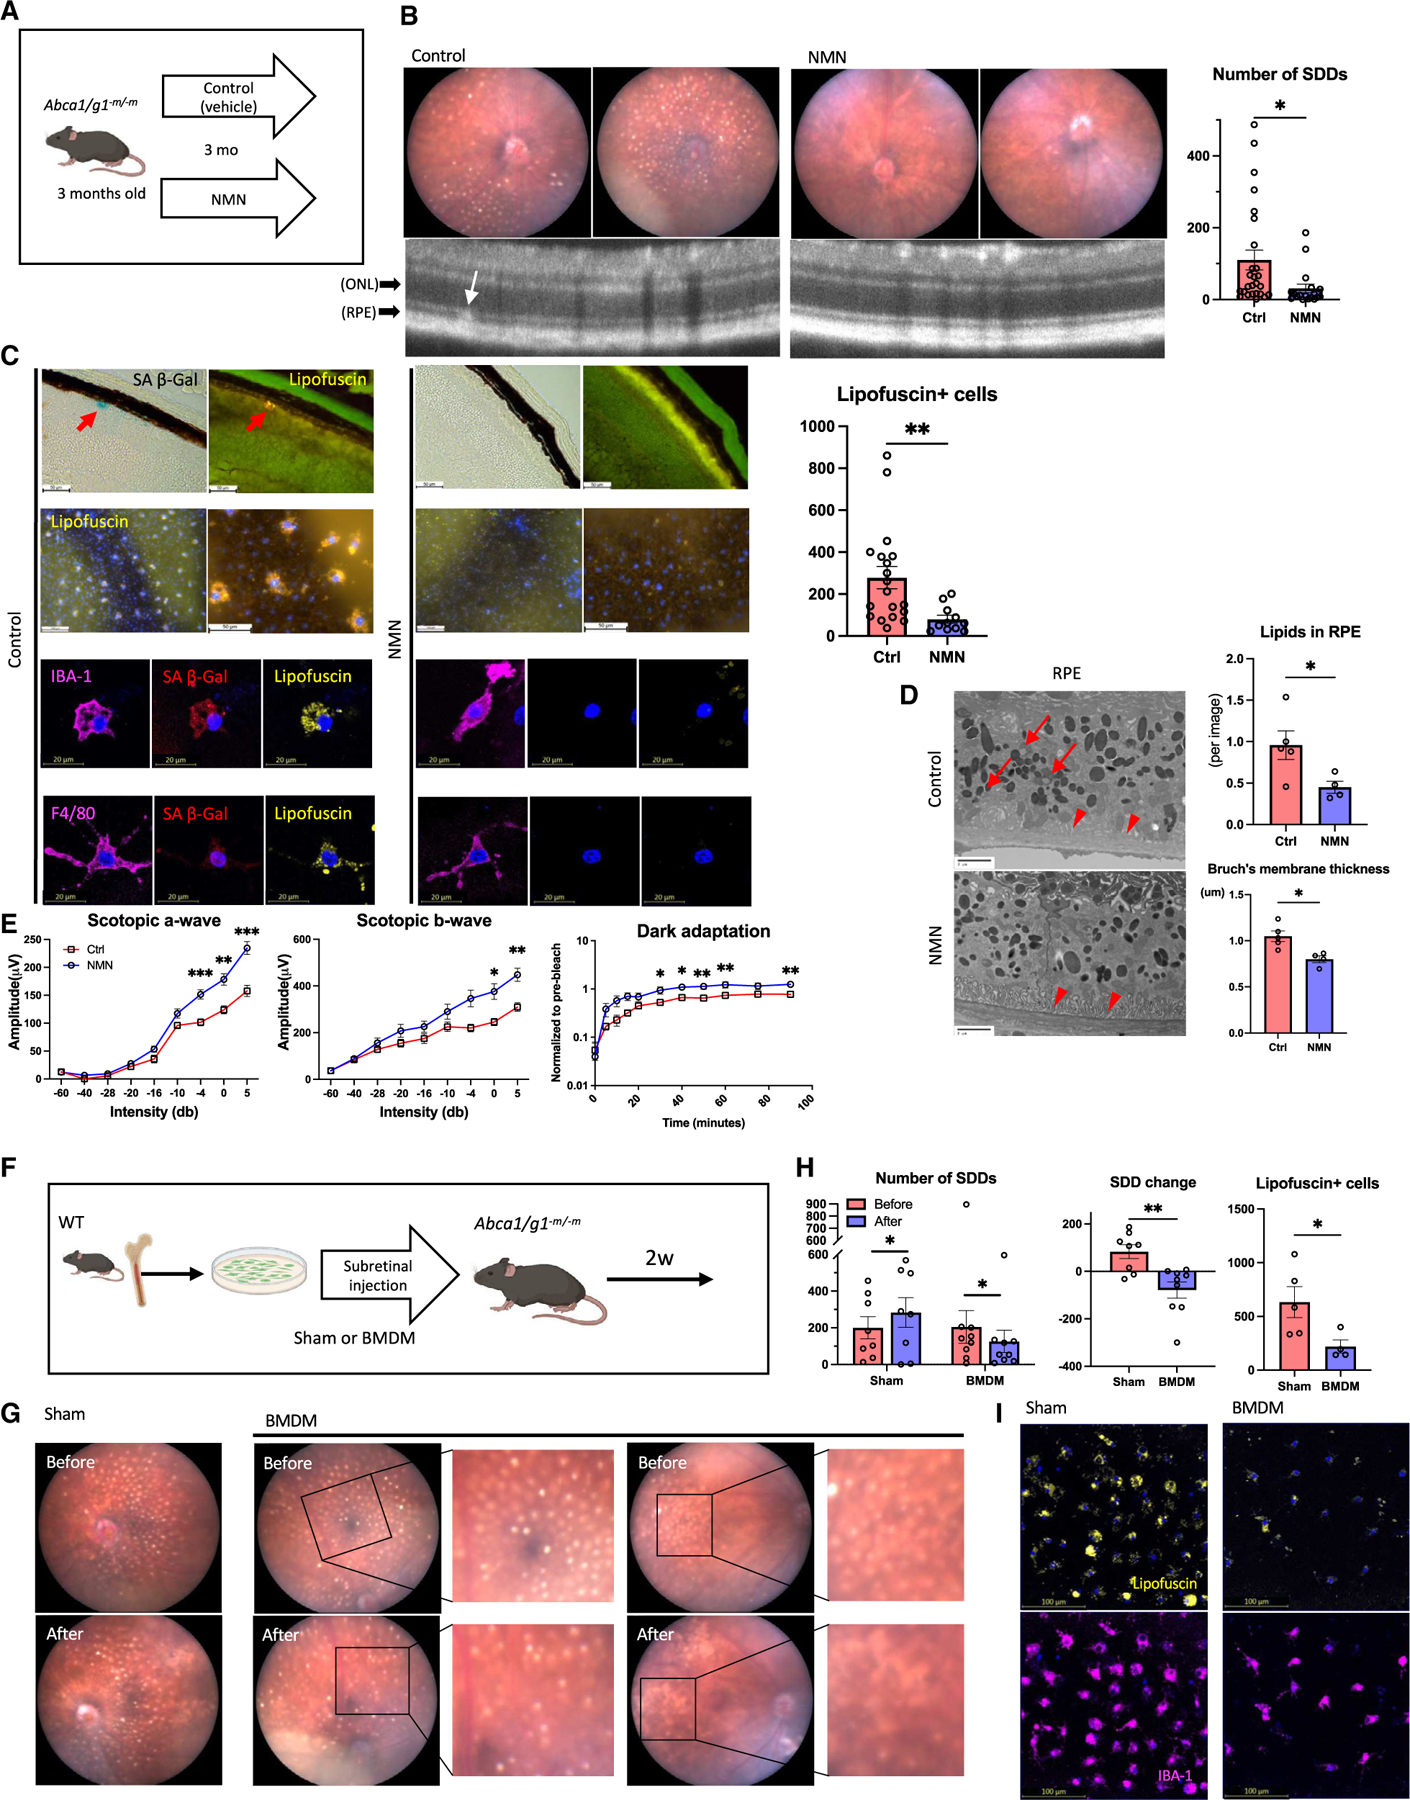
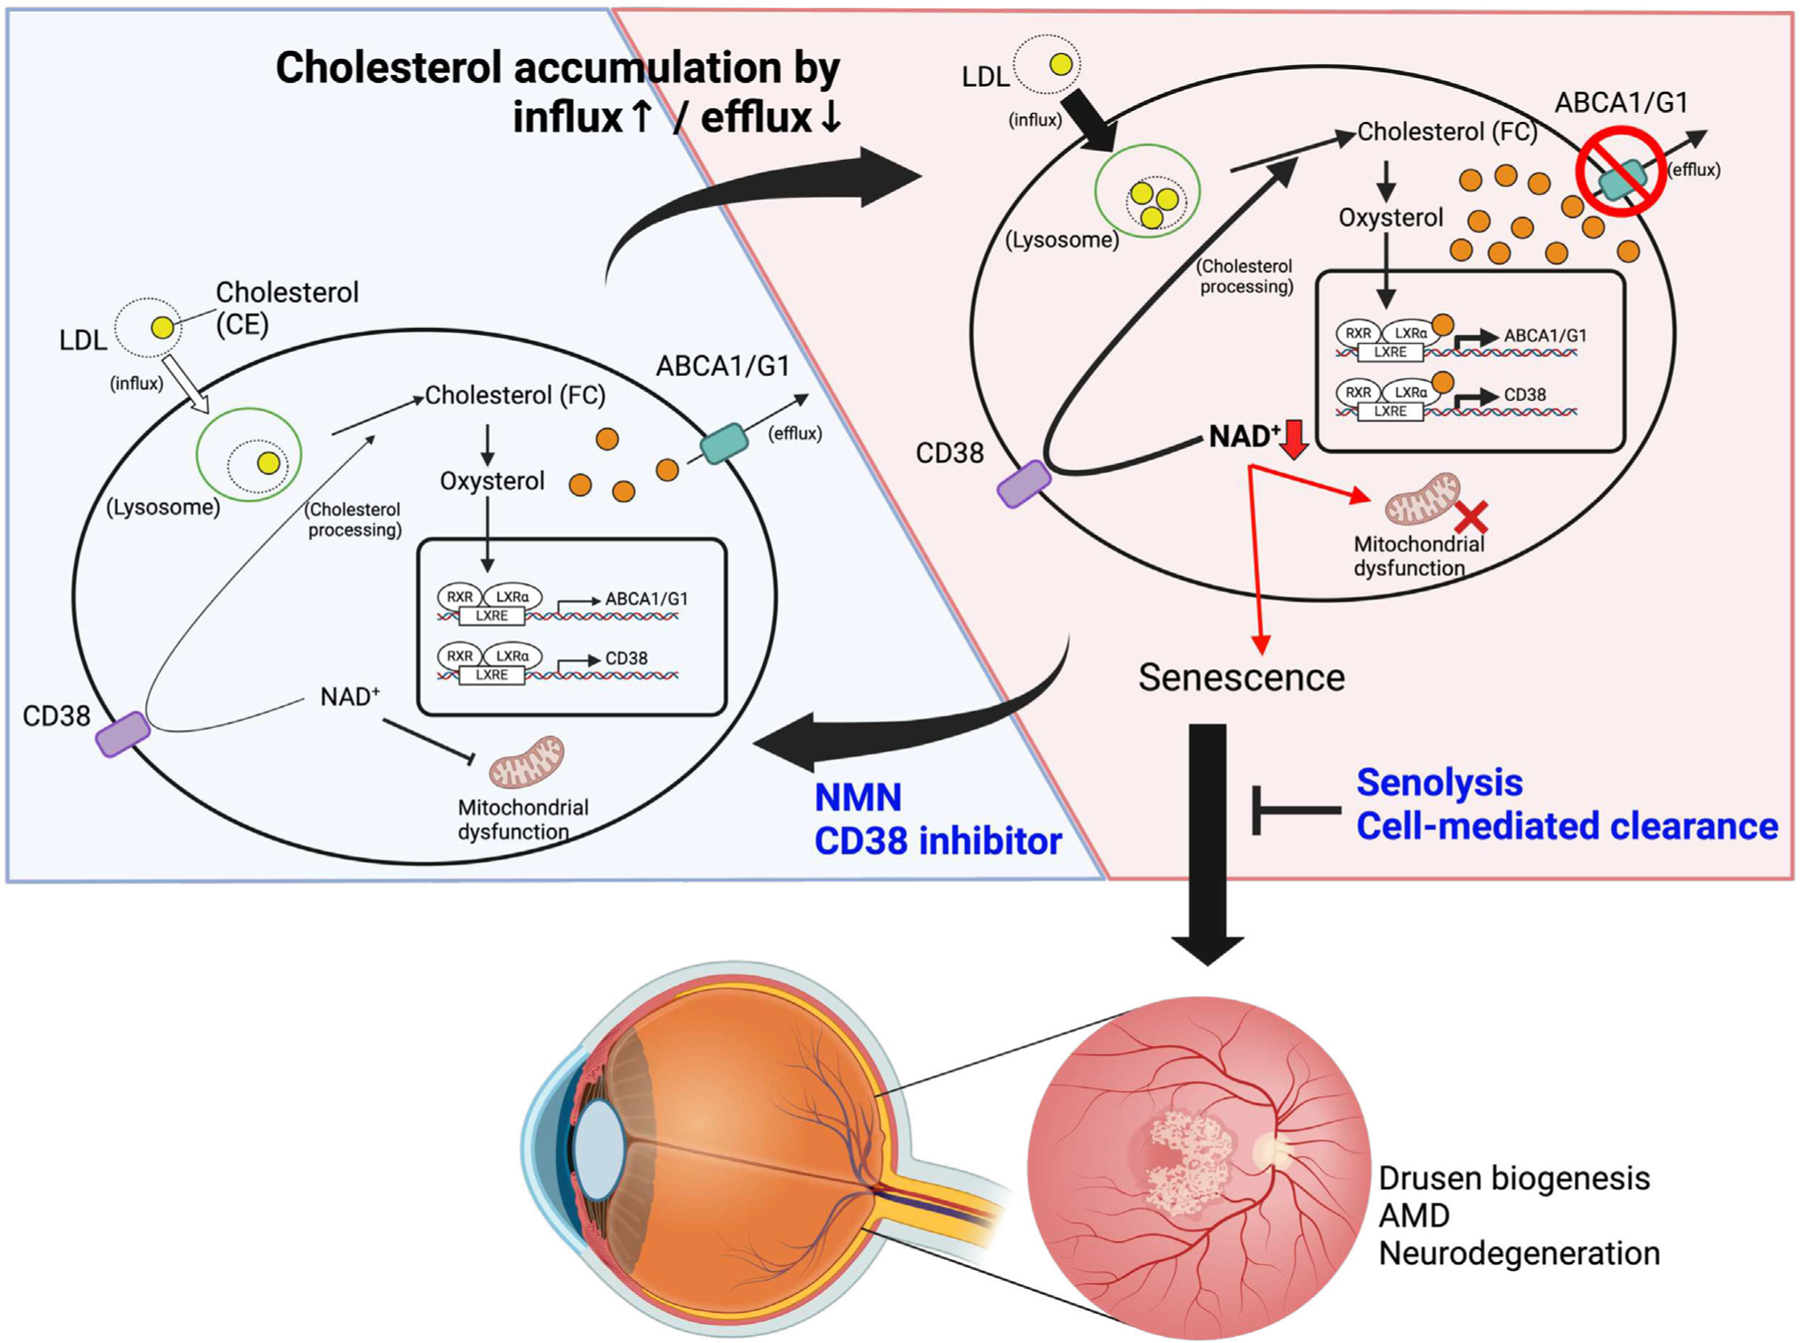
Although dysregulated cholesterol metabolism predisposes aging tissues to inflammation and a plethora of diseases, the underlying molecular mechanism remains poorly defined. Here, we show that metabolic and genotoxic stresses, convergently acting through liver X nuclear receptor, upregulate CD38 to promote lysosomal cholesterol efflux, leading to nicotinamide adenine dinucleotide (NAD+) depletion in macrophages. Cholesterol-mediated NAD+ depletion induces macrophage senescence, promoting key features of age-related macular degeneration (AMD), including subretinal lipid deposition and neurodegeneration. NAD+ augmentation reverses cellular senescence and macrophage dysfunction, preventing the development of AMD phenotype. Genetic and pharmacological senolysis protect against the development of AMD and neurodegeneration. Subretinal administration of healthy macrophages promotes the clearance of senescent macrophages, reversing the AMD disease burden. Thus, NAD+ deficit induced by excess intracellular cholesterol is the converging mechanism of macrophage senescence and a causal process underlying age-related neurodegeneration.

Keywords: CD38; CP: Immunology; CP: Metabolism; NAD(+); NMN; age-related macular degeneration; cellular senescence; cholesterol efflux; neurodegeneration; nicotinamide adenine dinucleotide; nicotinamide mononucleotide.


Conflict of interest statement

Declaration of interests R.S.A. is a co-founder of Metro Midwest Biotech. M.Y. receives patent-licensing fees from Institute for Research on Productive Aging.

Figures

Figure 1.
Figure 1.. Disruption of cholesterol metabolism reduces macrophage NAD+ availability via CD38 upregulation
(A) LC/MS lipidomics data (heatmap and lollipop chart) comparing BMDMs isolated from Abca1/g1f/f (control [Ctrl]) and Abca1/g1-m/-m (knockout [KO]). (B) Heatmap of upregulated and downregulated genes in bulk RNA-seq of BMDMs. (C) Immunofluorescence images of BMDMs stained for CD38 and phalloidin and the quantification of CD38. (D) Schematic representation of NAD+ metabolism. (E) mRNA expression of genes synthesizing and consuming NAD+ in BMDMs. (F) Intracellular NMN, NAD+, and cADPR/NAD+ ratio in BMDMs. (G) NAD+ flux assay evaluating synthesized (heavy) NAD+ and cADPR/NAD+ ratio. (H) The consumption rate of NAD+ in BMDMs calculated by NAD+ flux assay. (I and J) (I) mRNA expression of CD38 in WT BMDMs treated with cholesterol and (J) an LXR agonist (GW3965). (K) mRNA expression of CD38 in Abca1/g1-m/-m BMDMs transfected with Nr1h3 (siLXRα) and Nr1h2 (siLXRβ) siRNA and WT BMDMs treated with cholesterol while transfected with siLXRα. (L) mRNA expression of Cd38 in BMDMs treated with irradiation under siRNA knockdown of LXRα. (M) Experimental design of cholesterol flux assay using NBD cholesterol on BMDMs. (N) Representative images of BMDMs treated with a selective CD38 inhibitor (78c) and the quantification of fluorescence intensity of each cell. (O and P) (O) Lysosomal activity of BMDMs comparing among Abca1/g1f/f treated with/without cholesterol and Abca1/g1-m/-m and (P) between Abca1/g1-m/-m treated with/without 78c. NR, nicotinamide riboside; NMN, nicotinamide mononucleotide; NAD+, nicotinamide adenine dinucleotide; NAM, nicotinamide; cADPR, cyclic adenosine diphosphate ribose; NAADP, nicotinic acid adenine dinucleotide phosphate; ADPR, adenosine diphosphate ribose; NMNAT, nicotinamide mononucleotide adenylyltransferase; NAMPT, nicotinamide phosphoribosyltransferase; SIRT, sirtuin; PARP, poly ADP-ribose polymerase; SARM1, sterile α and TIR motif-containing 1. *p < 0.05; **p < 0.01; ***p < 0.001; ****p < 0.0001, t test for comparison between two groups, one-way ANOVA followed by Bonferroni correction for multiple comparison, and two-way ANOVA followed by Bonferroni correction for comparison with multiple time points. Data are represented as mean ± SEM. The length of scale bar is indicated in each image. See also Figure S1.
Figure 2.
Figure 2.. Reduced NAD+ availability induces macrophage senescence and dysfunction
(A) mRNA expression of senescence markers (p16 and p21) and SASP factors (Tnf-α, Vegf-a, and Il-1β) in BMDMs isolated from Abca1/g1f/f and Abca1/g1-m/-m. (B) Images of in situ hybridization (ISH; p16 and p21) and SA-β-Gal staining and the quantification of SA-β-Gal. (C) mRNA expression and ISH of p16 and p21, and SA-β-Gal staining of WT BMDMs treated with cholesterol. (D–F) (D) mRNA expression of p16 and p21 in WT BMDMs treated with an LXR agonist (GW3965), (E) CD38-overexpression, and (F) a selective NAMPT inhibitor (FK866). (G) mRNA expression of senescence markers (p16 and p21) and SASP factors (Vegf-a, Vcam1, and Il-1β), representative images of ISH (p16 and p21), and SA-β-Gal staining of Abca1/g1-m/-m BMDMs treated with NMN. (H) mRNA expression of p16 and p21 in Abca1/g1-m/-m BMDMs treated with the CD38 inhibitor (78c). (J) (I and J) (I) mRNA expression of p16 and p21 in irradiation-induced senescent BMDMs transfected with siCD38 and (J) treated with NMN. (K and L) (K) Representative EM images and (L) the quantification of the number of cristae in Abca1/g1f/f and Abca1/g1-m/-m BMDMs treated with or without NMN. (M) Seahorse assay evaluating the oxygen consumption rate (OCR) of BMDMs. *p < 0.05; **p < 0.01; ***p < 0.001; ****p < 0.0001, t test for comparison between two groups, one-way ANOVA followed by Bonferroni correction for multiple comparison, and two-way ANOVA followed by Bonferroni correction for comparison with multiple time points. Data are represented as mean ± SEM. The length of scale bar is indicated in each image. See also Figure S2.
Figure 3.
Figure 3.. Cholesterol efflux defect causes macrophage senescence and lipofuscin accumulation in eye
(A) Representative fundus photography images of Abca1/g1-m/-m presenting with SDD. (B) Quantification of cholesterol ester in retinal samples from young (2 months old) and old (27 months old) measured by LC/MS. (C) Immunofluorescence of RPE flat mount showing lipofuscin- and IBA-1-positive cells and the quantification of lipofuscin-positive cells. (D) Immunofluorescence images of RPE flat mount for CD38 and IBA-1. The circle graph shows the percentage of CD38-positive cells in IBA-1-positive cells. (E) SA-β-Gal staining of retinal sections. Note that the SA-β-Gal-positive areas merge with lipofuscin (arrow) in Abca1/g1-m/-m retinal sections. The bar graph shows the number of lipofuscin-positive areas and the circle graph shows the percentage of SA-β-Gal-positive areas within lipofuscin-positive areas in the subretinal space. (F) ISH (p16 and p21) of retinal sections and the quantification of the number of ISH-positive areas in lipofuscin-positive areas. Note that the lipofuscin-positive area merges with the p16/p21-expressing area (arrows in each image). (G) Co-staining images of SPIDER-β-Gal and immunofluorescence (lipofuscin, F4/80, and IBA-1) in RPE flat mount. The circle graph shows the percentage of myeloid cell marker-positive cells in SPIDER-β-Gal-positive cells and SA-β-Gal-positive cells in myeloid cells. ONL, outer nuclear layer; RPE, retinal pigment epithelium. *p < 0.05; ***p < 0.001; ****p < 0.0001, t test for comparison between two groups. Data are represented as mean ± SEM. The length of scale bar is indicated in each image. See also Figure S3.
Figure 4.
Figure 4.. Accumulation of subretinal senescent macrophages is responsible for drusenoid deposits and neurodegeneration in an AMD model
(A) Experimental design of the subretinal administration of BMDMs into eyes of WT mice. (B) Fundus and optical coherence tomography (OCT) images and the quantification of SDD. Note a subretinal deposit in subretinal space of retina treated with subretinal injection of Abca1/g1-m/-m BMDMs (arrow). (C) Representative images of RPE flat mount showing lipofuscin- and IBA-1-positive cells and the quantification of lipofuscin-positive cells. (D) Electroretinography waveform of mice treated with Abca1/g1f/f and Abca1/g1-m/-m BMDMs, and the quantification of amplitude of scotopic a and b wave. Each waveform and graph indicate the mean ± SEM. (E) Representative EM images of retinal sections. Note that outer segment disc membranes were disrupted in retinal sections treated with subretinal administration of Abca1/g1-m/-m BMDMs. (F) Experimental design of the subretinal administration of CD38-overexpressing BMDMs into WT retina. (G) Fundus and OCT images and the quantification of SDD. Note a subretinal deposit in subretinal space of retina treated with subretinal injection of CD38-overexpressing BMDMs (arrow). (H) Representative images of RPE flat mount showing lipofuscin- and IBA-1-positive cells and the quantification of lipofuscin-positive cells. POS, photoreceptor outer segment. *p < 0.05; **p < 0.01; ****p < 0.0001, t test for comparison between two groups and two-way ANOVA followed by Bonferroni correction for comparison with multiple time points. Data are represented as mean ± SEM. The length of scale bar is indicated in each image. See also Figure S4.
Figure 5.
Figure 5.. Senescence clearance prevents the development of subretinal drusenoid deposits
(A) Experimental design using Abca1/g1-m/-m;INK-ATTAC. (B) Representative fundus images and OCT and the quantification of the number of SDD. (C) Representative SA-β-Gal staining images of retinal section, immunofluorescence of RPE flat mount showing lipofuscin-, myeloid cell marker-, and SPiDER β-Gal-positive cells, and the quantification of lipofuscin-positive cells on RPE flat mount. Note SA-β-Gal- and lipofuscin-positive area (arrow) in Abca1/g1-m/-m indicating SDD. (D) Heatmap of the bulk RNA-seq representing downregulated expression in RPE/choroid complex samples. (E) Representative EM images showing RPE cells and Bruch’s membrane, and the quantification of the number of intracellular lipids in RPE cells and Bruch’s membrane thickness. Note intracellular lipids in RPE cells (arrow) and thickened Bruch’s membrane (arrowhead) in Abca1/g1-m/-m. (F) The quantification of electroretinography (scotopic a-wave, b-wave, and dark-adaptation electroretinography) amplitudes. (G) Experimental design of the experiment using senolytic drugs (dasatinib and quercetin [D + Q]) for Abca1/g1-m/-m. (H) Representative fundus images and the quantification of SDD. (I) Representative EM images showing RPE cells and Bruch’s membrane and the quantification of the number of intracellular lipids in RPE cells and Bruch’s membrane thickness. Note intracellular lipids in RPE cells (arrow) and thickened Bruch’s membrane (arrowhead) in Abca1/g1-m/-m treated with vehicle. (J) The quantification of electroretinography amplitudes. *p < 0.05; **p < 0.01; ****p < 0.0001, t test for comparison between two groups and two-way ANOVA followed by Bonferroni correction for comparison with multiple time points. Data are represented as mean ± SEM. The length of scale bar is indicated in each image. See also Figure S5.
Figure 6.
Figure 6.. NAD+ augmentation promotes the clearance of subretinal senescent macrophages and drusenoid deposits
(A) Experimental design for the treatment with NMN. (B) Representative fundus images and OCT images of eyes the treatment with NMN and the quantification of SDD. (C) Representative SA-β-Gal staining images of retinal section, immunofluorescence of RPE flat mount showing lipofuscin-, myeloid cell marker-, and SPiDER β-Gal-positive cells, and the quantification of lipofuscin-positive cells on RPE flat mount. Note SA-β-Gal- and lipofuscin-positive area (arrow) in Abca1/g1-m/-m indicating SDD. (D) Representative EM images showing RPE cells and Bruch’s membrane, and the quantification of the number of intracellular lipids in RPE cells and Bruch’s membrane thickness. Note intracellular lipids in RPE cells (arrow) and thickened Bruch’s membrane (arrowhead) in Abca1/g1-m/-m. (E) The quantification of electroretinography (scotopic a-wave, b-wave, and dark-adaptation electroretinography) amplitudes. (F) Experimental design of subretinal administration of healthy BMDMs into Abca1/g1-m/-m mice with SDD. (G) Representative fundus images of eyes before and after subretinal injection of BMDMs or vehicle. Before and after images were taken in identical eyes. (H) The quantification of SDD and lipofuscin-positive cells. (I) Representative images of RPE flat mount showing lipofuscin-positive cells. *p < 0.05; **p < 0.01, t test for comparison between two groups. Data are represented as mean ± SEM. The length of scale bar is indicated in each image.
Figure 7.
Figure 7.. Models of NAD+-mediated induction of senescence and cholesterol metabolism
Intracellular cholesterol accumulation activates LXR-mediated expression of ABCA1/G1 and CD38 to maintain cholesterol homeostasis. During aging and in patients with genetic susceptibility, excessive intracellular cholesterol levels drive the cholesterol/LXR/CD38 axis, thereby inducing macrophage senescence by NAD+ depletion. Accumulation of subretinal senescent macrophages with lipofuscin leads to the pathogenic SDD phenotype and the development of dry AMD. Senolysis and cell-mediated clearance of senescent macrophages prevent or reverse AMD pathology. NAD+ repletion by NMN and CD38 inhibition suppresses macrophage senescence and is a viable therapeutic approach against age-related neurodegeneration.

References

    1. Zhang L, Pitcher LE, Yousefzadeh MJ, Niedernhofer LJ, Robbins PD, and Zhu Y (2022). Cellular senescence: a key therapeutic target in aging and diseases. J. Clin. Invest. 132, e158450. 10.1172/JCI158450. - DOI - PMC - PubMed
    1. Zindy F, Quelle DE, Roussel MF, and Sherr CJ (1997). Expression of the p16INK4a tumor suppressor versus other INK4 family members during mouse development and aging. Oncogene 15, 203–211. 10.1038/sj.onc.1201178. - DOI - PubMed
    1. Coppé JP, Patil CK, Rodier F, Sun Y, Muñoz DP, Goldstein J, Nelson PS, Desprez PY, and Campisi J (2008). Senescence-associated secretory phenotypes reveal cell-nonautonomous functions of oncogenic RAS and the p53 tumor suppressor. PLoS Biol. 6, 2853–2868. 10.1371/journal.pbio.0060301. - DOI - PMC - PubMed
    1. Krtolica A, Parrinello S, Lockett S, Desprez PY, and Campisi J (2001). Senescent fibroblasts promote epithelial cell growth and tumorigenesis: a link between cancer and aging. Proc. Natl. Acad. Sci. USA. 98, 12072–12077. 10.1073/pnas.211053698. - DOI - PMC - PubMed
    1. Krtolica A, and Campisi J (2002). Cancer and aging: a model for the cancer promoting effects of the aging stroma. Int. J. Biochem. Cell Biol. 34, 1401–1414. 10.1016/s1357-2725(02)00053-5. - DOI - PubMed

Publication types