. 2024 Apr 18;44(1):36.
doi: 10.1007/s10571-024-01470-9.

Neutrophil Extracellular Traps Regulate Surgical Brain Injury by Activating the cGAS-STING Pathway

Affiliations

Neutrophil Extracellular Traps Regulate Surgical Brain Injury by Activating the cGAS-STING Pathway

Bingbing Li et al. Cell Mol Neurobiol. .

Abstract

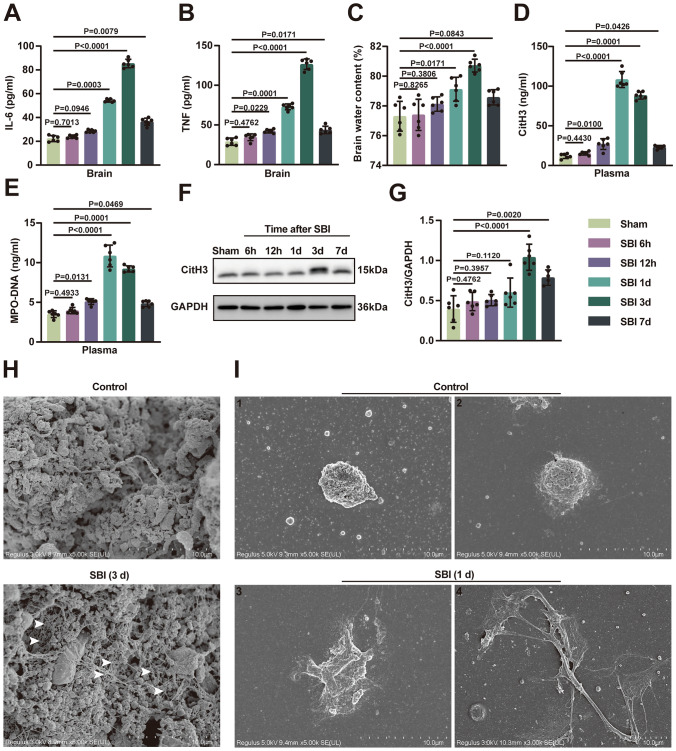
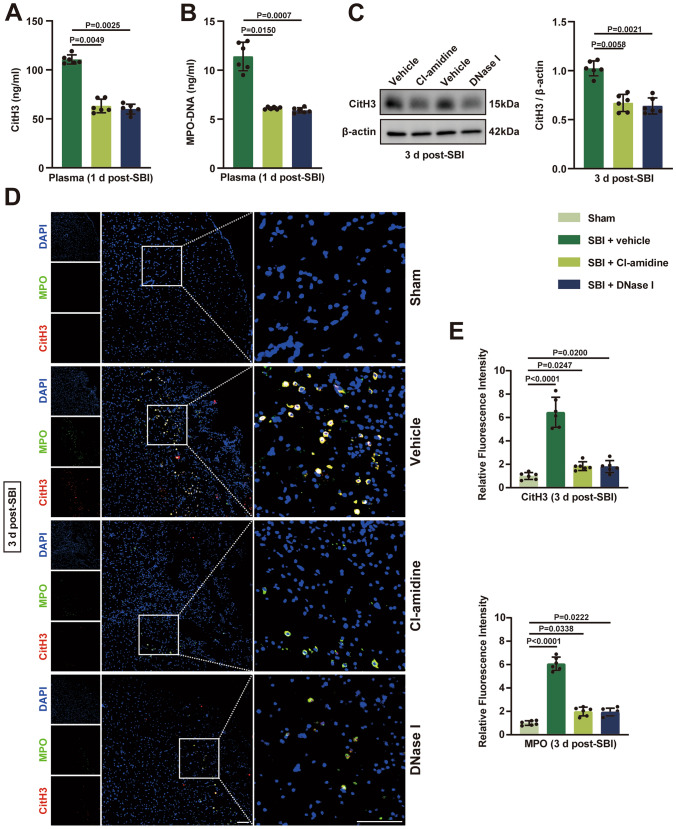
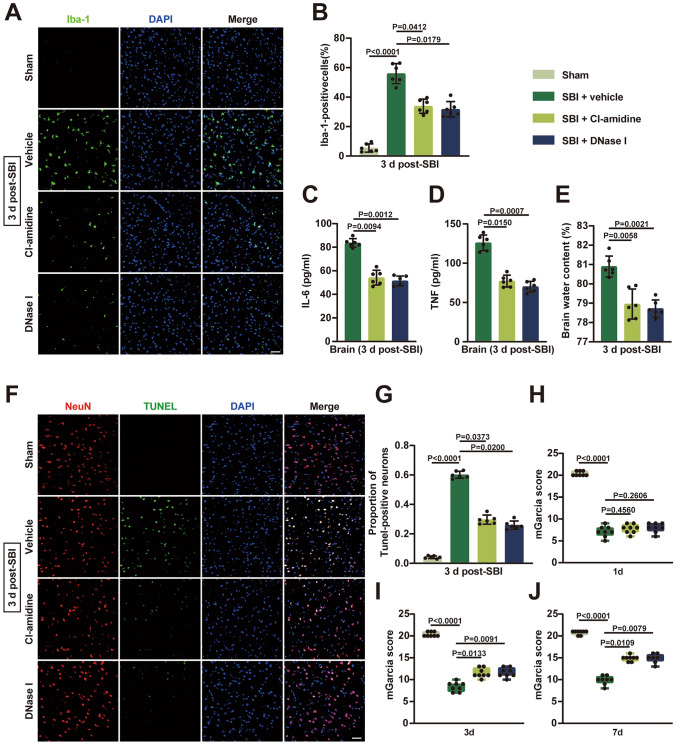
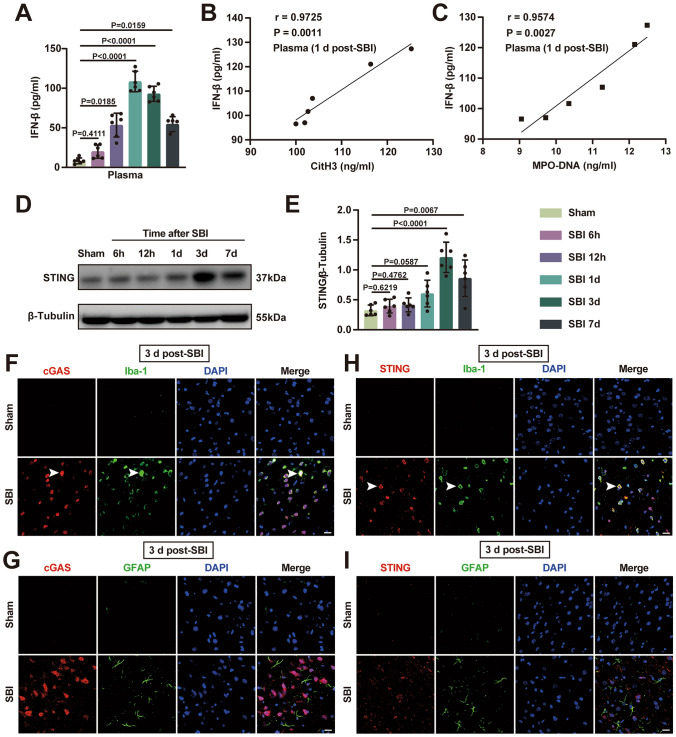
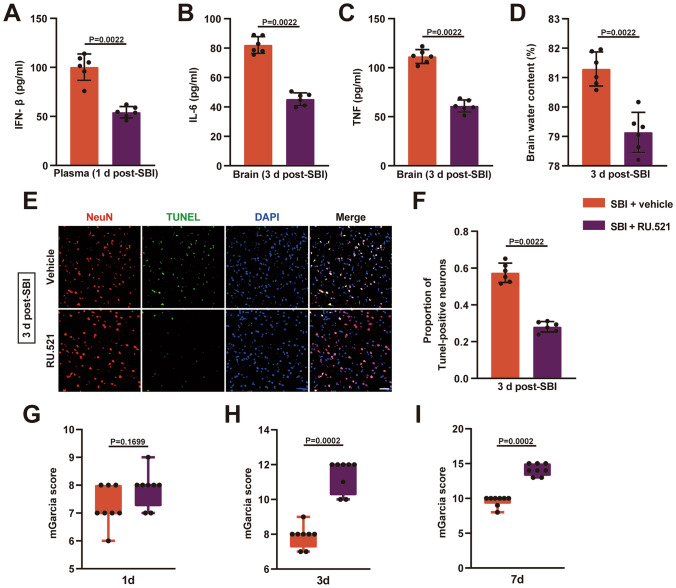
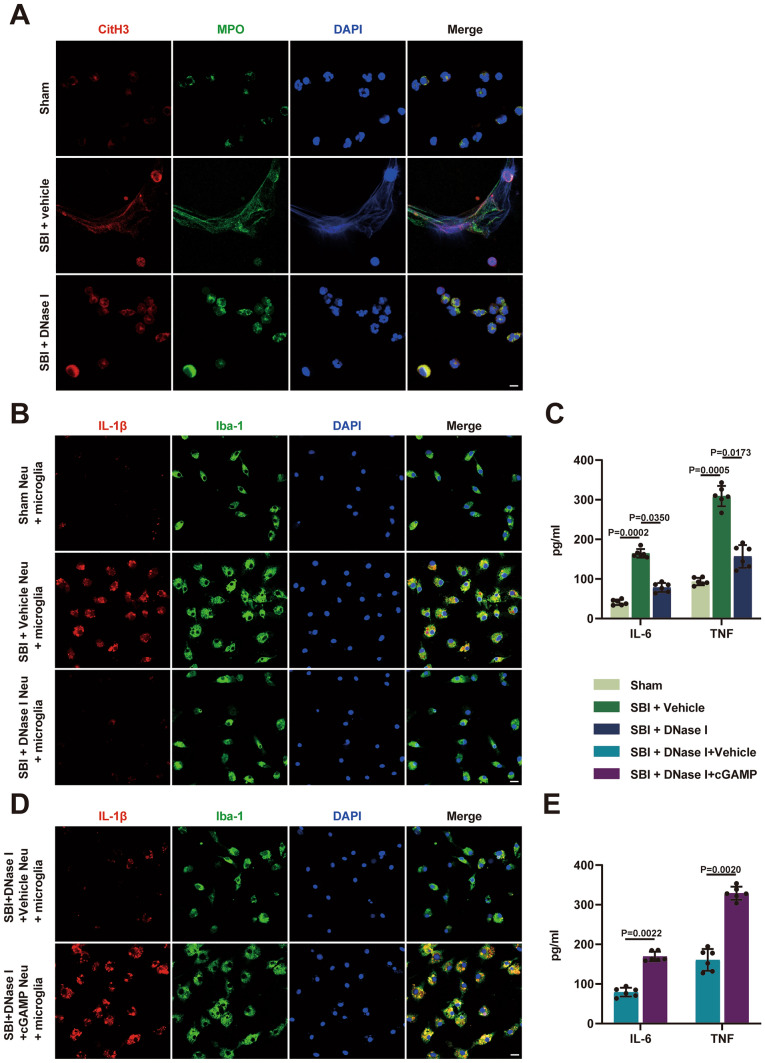
Surgical brain injury (SBI), induced by neurosurgical procedures or instruments, has not attracted adequate attention. The pathophysiological process of SBI remains sparse compared to that of other central nervous system diseases thus far. Therefore, novel and effective therapies for SBI are urgently needed. In this study, we found that neutrophil extracellular traps (NETs) were present in the circulation and brain tissues of rats after SBI, which promoted neuroinflammation, cerebral edema, neuronal cell death, and aggravated neurological dysfunction. Inhibition of NETs formation by peptidylarginine deiminase (PAD) inhibitor or disruption of NETs with deoxyribonuclease I (DNase I) attenuated SBI-induced damages and improved the recovery of neurological function. We show that SBI triggered the activation of cyclic guanosine monophosphate-adenosine monophosphate synthase stimulator of interferon genes (cGAS-STING), and that inhibition of the cGAS-STING pathway could be beneficial. It is worth noting that DNase I markedly suppressed the activation of cGAS-STING, which was reversed by the cGAS product cyclic guanosine monophosphate-adenosine monophosphate (cGMP-AMP, cGAMP). Furthermore, the neuroprotective effect of DNase I in SBI was also abolished by cGAMP. NETs may participate in the pathophysiological regulation of SBI by acting through the cGAS-STING pathway. We also found that high-dose vitamin C administration could effectively inhibit the formation of NETs post-SBI. Thus, targeting NETs may provide a novel therapeutic strategy for SBI treatment, and high-dose vitamin C intervention may be a promising translational therapy with an excellent safety profile and low cost.

Keywords: Neutrophil extracellular traps; STING; Surgical brain injury; Vitamin C; cGAS.


Conflict of interest statement

The authors declare no conflict of interest.

Figures

Fig. 1
Fig. 1
NETs were found in peripheral circulating blood and injured brain tissues after SBI. A, B Detection of inflammatory factor (IL-6, TNF) levels in rat brain tissues using ELISA at sham, 6 h, 12 h, 1 d, 3 d, and 7 d post-SBI (n = 6). C Brain water contents of the sham group and SBI group were measured at 1 d, 3 d, and 7 d post-SBI to assess brain edema (n = 6). D, E Detection of the levels of CitH3 and MPO-DNA, which are biomarkers of plasma NETs, using ELISA at sham, 6 h, 12 h, 1 d, 3 d, and 7 d post-SBI (n = 6). F, G Representative immunoblots (F) and quantification of CitH3 levels (G) in brain tissues of rats from the sham group and SBI group at 6 h, 12 h, 1 d, 3 d, and 7 d post-SBI (n =6). H Representative scanning electron micrographs of brain tissues in the control group and SBI 3d group, NET-like structures (white arrows) could be seen after SBI. Scale bar = 10 μm. I Neutrophils isolated from the control group (I1, I2) and SBI 1d group (I3, I4) were observed by scanning electron microscopy in vitro. Scale bar = 10 μm. The Kruskal–Wallis tests were used for statistical analysis. Data are presented as the mean ± SD. Details of statistical analysis are provided in the Supplementary Information
Fig. 2
Fig. 2
PAD4 inhibitor (Cl-amidine) and DNase I can significantly reduce the level of NETs after SBI. A, B Detection of plasma NETs levels in sham-operated and SBI rats after administration of Cl-amidine and DNase I using ELISA (n = 6). C Representative immunoblots and quantitative analyses of CitH3 in rat brain tissue after different interventions (n =6). D Representative immunofluorescence images of CitH3 (red) and MPO (green) double-positive cells in rat brain tissue from different groups at 3 days after SBI. Nuclei were stained with DAPI (blue). Scale bar = 100 μm. E Quantitative analyses of CitH3 and MPO in diverse groups (n = 6). The Kruskal–Wallis tests were used for statistical analysis. Data are presented as the mean ± SD. Details of statistical analysis are provided in the Supplementary Information
Fig. 3
Fig. 3
Restricting NETs attenuated neuroinflammation, and brain edema, alleviated neuronal cell death, and improved neurological function after SBI. A Representative immunofluorescence images of microglial activation in injured brain tissues of each group at 3 days after SBI (sham, SBI+vehicle, SBI+ Cl-amidine, SBI+ DNase I). Green, Iba-1; blue, DAPI; Scale bar = 50 μm. B Quantitative analyses of Iba-1 positive cells in each group (n = 6). C, D Detection of inflammatory factor (IL-6, TNF) levels in rat brain tissues of each group using ELISA at 3 days after SBI (n = 6). E Brain water contents were measured at 3 days post-SBI to assess brain edema (n = 6). F Representative immunofluorescence images of NeuN (neurons, red) and TUNEL (green) in rat brain tissues of each group at 3 days after SBI. Scale bar = 50 μm. G Quantification of the percentage of TUNEL-positive neurons (n = 6). H, I, J The modified Garcia scores were used to assess neurological deficits in each group at 1 day, 3 days, and 7 days (n = 8). The Kruskal–Wallis tests were used for statistical analysis. Data are presented as the mean ± SD (B, C, D, E, and G) or median (interquartile range) (H, I, and J). Details of statistical analysis are provided in the Supplementary Information
Fig. 4
Fig. 4
The cGAS-STING pathway is activated after SBI. A Quantification of the levels of plasma IFN-β using ELISA at sham, 6 h, 12 h, 1 d, 3 d, and 7 d post-SBI (n = 6). B Plasma CitH3 correlated with plasma IFN-β, r = 0.9725, P = 0.0011 (n = 6). C Plasma MPO-DNA correlated with plasma IFN-β, r = 0.9574, P = 0.0027 (n = 6). D, E Representative immunoblots and quantitative analyses of STING expression in injured brain tissues of rats from the sham group and SBI group at 3 days post-modeling (n = 6). F–I Representative images of immunofluorescence double staining showing the localization of cGAS (red) and STING (red) with Iba-1 (green) and GFAP(green) respectively, in the brain tissues of sham-operated and SBI rats. Scale bar = 20 μm. The Kruskal–Wallis tests were used for statistical analysis (A, E). Spearman correlation was used to analyze the correlation between the levels of plasma CitH3, plasma MPO-DNA and the level of IFN-β in SBI rats (B, C). Data are presented as the mean ± SD. Details of statistical analysis are provided in the Supplementary Information
Fig. 5
Fig. 5
Blockade of cGAS-STING using RU.521 can be neuroprotective after SBI. A Quantification of the levels of plasma IFN-β using ELISA in the SBI + vehicle group and SBI + RU.521 group on day 1 post-SBI (n = 6). B, C Detection of inflammatory factor (IL-6, TNF) levels in rat brain tissues of the two groups using ELISA at 3 days after SBI (n = 6). D Quantification of brain water content at 3 days after SBI (n = 6). E Representative immunofluorescence images of NeuN (red) and TUNEL (green) in the two groups at 3 days after SBI. F Quantitative analysis of the percentage of TUNEL-positive neurons (n = 6). G–I Quantification of neurological function using modified Garcia scores at 1 day, 3 days, and 7 days post-SBI (n = 8). Mann–Whitney’s tests were used for statistical analysis. Data are presented as the mean ± SD (A, B, C, D, and F) or median (interquartile range) (G, H, and I). Details of statistical analysis are provided in the Supplementary Information
Fig. 6
Fig. 6
Degradation of NETs with DNase I inhibits the cGAS-STING pathway after SBI.A Quantification of the levels of plasma IFN-β using ELISA at 1 day in SBI rats treated with vehicle, and DNase I (n = 6). B, C Quantification of the levels of plasma CitH3 and plasma MPO-DNA using ELISA at 1 day in SBI rats treated with vehicle, and RU.521 (n = 6). D–F Representative immunoblots and quantification of STING, phosphorylated (pTBK1), and total TBK1 expression in the injured brain tissues at 3 days in sham-operated rats and SBI rats treated with vehicle, DNase I, and DNase I in combination with cGAMP (n = 6). G, H Representative immunofluorescence images of microglia (Iba-1, Green) activation in injured brain tissues of the two groups at 3 days post-SBI (DNase I + vehicle, DNase I + cGAMP). Scale bar = 50 μm. I Detection of inflammatory factor (IL-6, TNF) levels in rat brain tissues of the two groups using ELISA at 3 days (n = 6). J Representative immunofluorescence images of NeuN (red) and TUNEL (green) in rat brain tissues of the two groups at 3 days post-SBI (DNase I + vehicle, DNase I + cGAMP). Scale bar = 50 μm. K Quantification of the percentage of TUNEL-positive neurons (n = 6).L Brain water contents were measured at 3 days to assess brain edema in the two groups (n = 6). M The modified Garcia scores were used to assess neurological deficits in the two groups at 1 day, 3 days, and 7 days after SBI (n = 8).Statistical analysis was performed using Mann–Whitney’s test (A, B, C, H, I, K, L, and M), and Kruskal–Wallis test (E, F). Data are presented as the mean ± SD (A, B, C, E, F, H, I, K and L) or median (interquartile range) (M). Details of statistical analysis are provided in the Supplementary Information
Fig. 7
Fig. 7
DNase I-mediated attenuation of neuroinflammation is abolished by cGAMP in vitro. A Representative immunofluorescence images of isolated peripheral blood neutrophils from rats undergoing sham surgery and SBI rats treated with vehicle or DNase I. Neutrophils were stained with CitH3 (red) and MPO (green). Scale bar = 5 μm. B Representative pictures of primary rat microglia cocultured with neutrophils isolated from sham-operated rats, and SBI rats treated with vehicle or DNase I. Microglia were stained with IL-1β (red) and Iba-1 (green). Neu = neutrophils, Scale bar = 20 μm. C Detection of inflammatory factor (IL-6, TNF) levels in cocultured microglia supernatants in different groups (n = 6). D Representative pictures of primary rat microglia cocultured with neutrophils in two groups with different treatments. Microglia were stained with IL-1β (red) and Iba-1 (green). Neu = neutrophils, Scale bar = 20 μm. E Detection of inflammatory factor (IL-6, TNF) levels in cocultured microglia supernatants in different groups (n = 6). Statistical analysis was performed using Kruskal–Wallis test (C) and Mann–Whitney’s test (E). Data are presented as the mean ± SD. Details of statistical analysis are provided in the Supplementary Information
Fig. 8
Fig. 8
Effect of vitamin C treatment on the release of NETs after SBI. A Detection of vitamin C levels in the plasma of SBI rats and sham-operated rats using ELISA at 3 days post-modeling (n = 6). B The ROS levels of neutrophils isolated from peripheral blood were measured at 1 day post-SBI in different intervention groups, including a sham group, a vehicle group, and SBI rats that received low (100 mg/kg), medium (200 mg/kg), or high doses (500 mg/kg) of vitamin C (n = 6). C, D Quantification of the levels of plasma CitH3 and plasma MPO-DNA in the four groups of rats at 1 day after SBI (n = 6). E, F Representative immunoblots and quantitative analyses of CitH3 in brain tissue after interventions with different doses of vitamin C at 3 days after SBI (n = 6). G Typical images of live-cell-forming NETs can be visualized by extracellular DNA (SYTOX Green) and intracellular DNA (Hoechst 33342) on laser confocal microscopy. Scale bar = 50 µm. Statistical analysis was performed using Mann–Whitney’s test (A) and Kruskal–Wallis test (B, C, D, and F). Data are presented as the mean ± SD. Details of statistical analysis are provided in the Supplementary Information

Similar articles

Cited by

References

    1. Abdullah A, Zhang M, Frugier T, Bedoui S, Taylor JM, Crack PJ (2018) STING-mediated type-I interferons contribute to the neuroinflammatory process and detrimental effects following traumatic brain injury. J Neuroinflammation 15(1):323. 10.1186/s12974-018-1354-7 - PMC - PubMed
    1. Apel F, Andreeva L, Knackstedt LS, Streeck R, Frese CK, Goosmann C, Hopfner KP, Zychlinsky A (2021) The cytosolic DNA sensor cGAS recognizes neutrophil extracellular traps. Sci Signal. 10.1126/scisignal.aax7942 - PubMed
    1. Bahrami Z, Firouzi M, Hashemi-Monfared A, Zahednasab H, Harirchian MH (2018) The effect of minocycline on indolamine 2, 3 dioxygenase expression and the levels of kynurenic acid and quinolinic acid in LPS-activated primary rat microglia. Cytokine 107:125–129. 10.1016/j.cyto.2017.12.013 - PubMed
    1. Barrett JP, Knoblach SM, Bhattacharya S, Gordish-Dressman H, Stoica BA, Loane DJ (2021) Traumatic brain Injury induces cGAS activation and type I Interferon Signaling in aged mice. Front Immunol 12:710608. 10.3389/fimmu.2021.710608 - PMC - PubMed
    1. Chang CY, Chen JY, Wu MH, Hu ML (2020) Therapeutic treatment with vitamin C reduces focal cerebral ischemia-induced brain infarction in rats by attenuating disruptions of blood brain barrier and cerebral neuronal apoptosis. Free Radic Biol Med 155:29–36. 10.1016/j.freeradbiomed.2020.05.015 - PubMed