

Sustained increase in suspended sediments near global river deltas over the past two decades
- PMID: 38637515
- PMCID: PMC11026514
- DOI: 10.1038/s41467-024-47598-6
Sustained increase in suspended sediments near global river deltas over the past two decades
Abstract
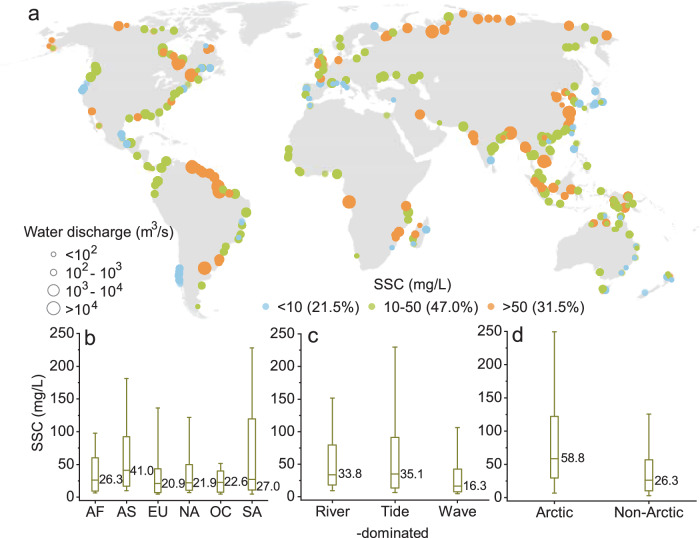
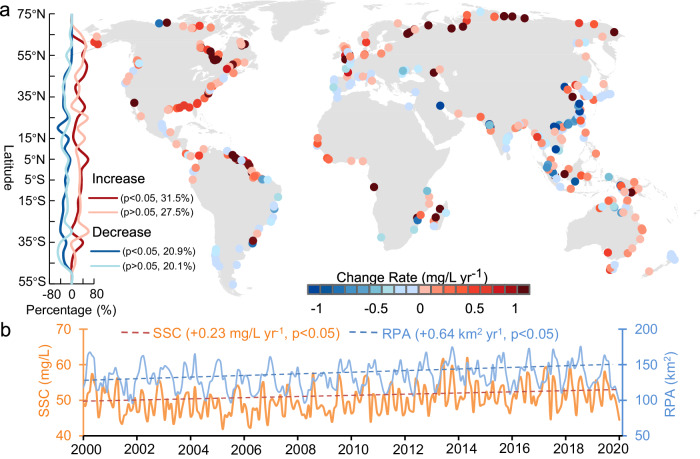
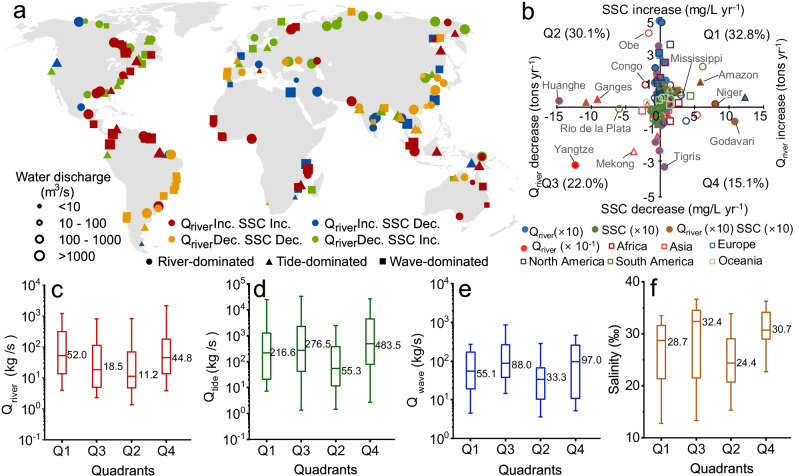
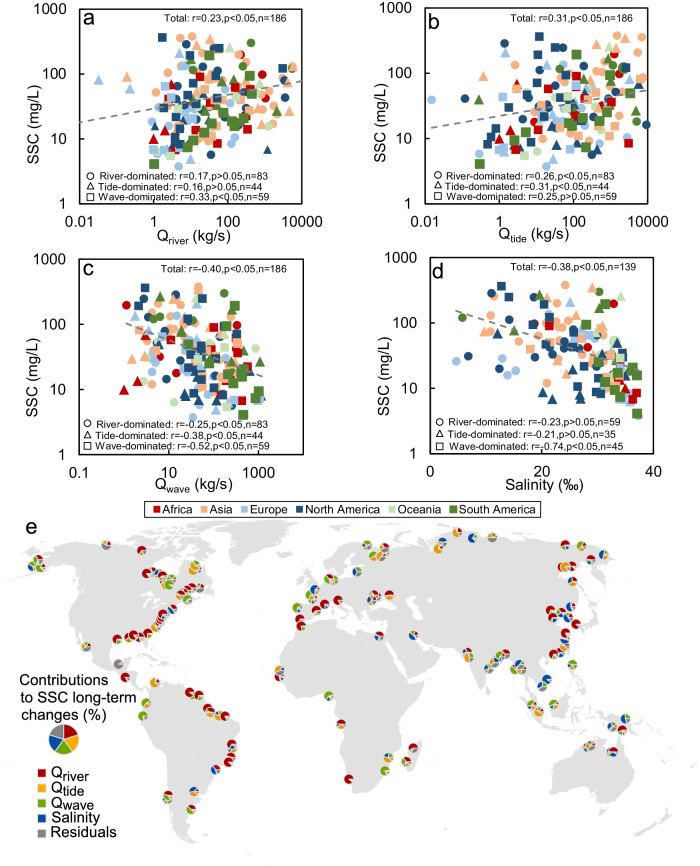
River sediments play a critical role in sustaining deltaic wetlands. Therefore, concerns are raised about wetlands' fate due to the decline of river sediment supply to many deltas. However, the dynamics and drivers of suspended sediment near deltaic coasts are not comprehensively assessed, and its response to river sediment supply changes remains unclear. Here we examine patterns of coastal suspended sediment concentration (SSC) and river sediment plume area (RPA) for 349 deltas worldwide using satellite images from 2000 to 2020. We find a global increase in SSC and RPA, averaging +0.46% and +0.48% yr-1, respectively, with over 59.0% of deltas exhibiting an increase in both SSC and RPA. SSC and RPA increases are prevalent across all continents, except for Asia. The relationship between river sediment supply and coastal SSCs varies between deltas, with as much as 45.2% of the deltas showing opposing trends between river sediments and coastal SSCs. This is likely because of the impacts of tides, waves, salinity, and delta morphology. Our observed increase in SSCs near river delta paints a rare promising picture for wetland resilience against sea-level rise, yet whether this increase will persist remains uncertain.
© 2024. The Author(s).
Conflict of interest statement
The authors declare no competing interests.
Figures
Similar articles
-
Co-evolution of wetland landscapes, flooding, and human settlement in the Mississippi River Delta Plain.Sustain Sci. 2016;11(4):711-731. doi: 10.1007/s11625-016-0374-4. Epub 2016 May 26. Sustain Sci. 2016. PMID: 30174740 Free PMC article.
-
Global-scale human impact on delta morphology has led to net land area gain.Nature. 2020 Jan;577(7791):514-518. doi: 10.1038/s41586-019-1905-9. Epub 2020 Jan 22. Nature. 2020. PMID: 31969725
-
Thirty-year changes of the coastlines, wetlands, and ecosystem services in the Asia major deltas.J Environ Manage. 2023 Jan 15;326(Pt A):116675. doi: 10.1016/j.jenvman.2022.116675. Epub 2022 Nov 12. J Environ Manage. 2023. PMID: 36379078
-
Natural processes in delta restoration: application to the Mississippi Delta.Ann Rev Mar Sci. 2011;3:67-91. doi: 10.1146/annurev-marine-120709-142856. Ann Rev Mar Sci. 2011. PMID: 21329199 Review.
-
Climate and land-use changes affecting river sediment and brown trout in alpine countries--a review.Environ Sci Pollut Res Int. 2009 Mar;16(2):232-42. doi: 10.1007/s11356-008-0075-3. Epub 2008 Dec 2. Environ Sci Pollut Res Int. 2009. PMID: 19048320 Review.
Cited by
-
Response time of global deltas to changes in fluvial sediment supply.Nat Commun. 2025 Jul 1;16(1):5573. doi: 10.1038/s41467-025-60531-9. Nat Commun. 2025. PMID: 40593527 Free PMC article.
-
Landsat-Derived Forel-Ule Index in the Three Gorges Reservoir over the Past Decade: Distribution, Trend, and Driver.Sensors (Basel). 2024 Nov 22;24(23):7449. doi: 10.3390/s24237449. Sensors (Basel). 2024. PMID: 39685986 Free PMC article.
-
Global increases of salt intrusion in estuaries under future environmental conditions.Nat Commun. 2025 Apr 15;16(1):3444. doi: 10.1038/s41467-025-58783-6. Nat Commun. 2025. PMID: 40234456 Free PMC article.
References
-
- Kirwan ML, Temmerman S, Skeehan EE, Guntenspergen GR, Fagherazzi S. Overestimation of marsh vulnerability to sea level rise. Nat. Clim. Change. 2016;6:253–260. doi: 10.1038/nclimate2909. - DOI
LinkOut - more resources
Full Text Sources
Miscellaneous
