

SARS-CoV-2 booster vaccine dose significantly extends humoral immune response half-life beyond the primary series
- PMID: 38637521
- PMCID: PMC11026522
- DOI: 10.1038/s41598-024-58811-3
SARS-CoV-2 booster vaccine dose significantly extends humoral immune response half-life beyond the primary series
Abstract
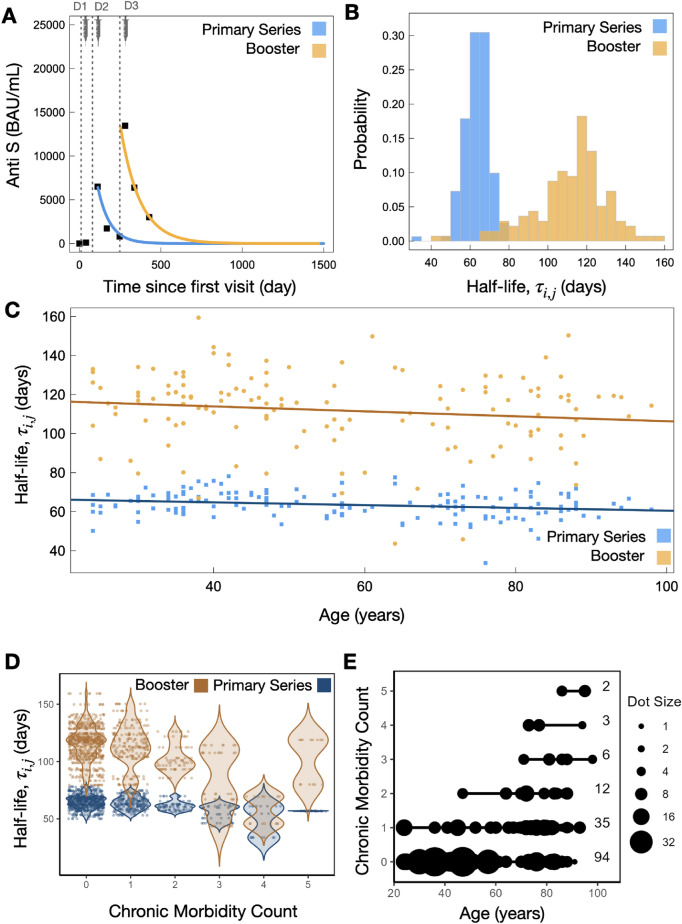
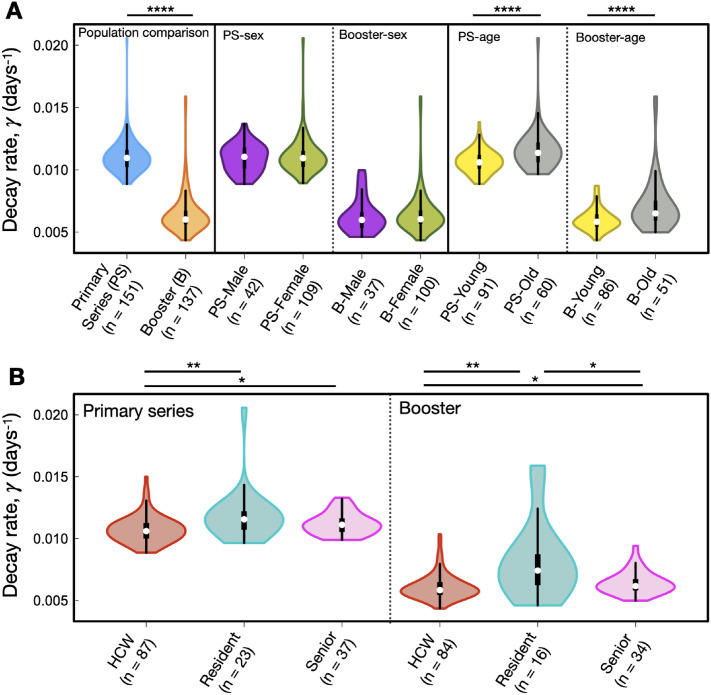
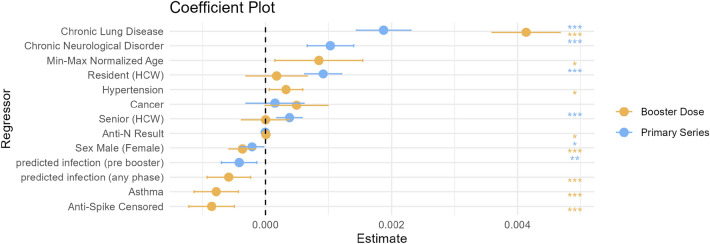
SARS-CoV-2 lipid nanoparticle mRNA vaccines continue to be administered as the predominant prophylactic measure to reduce COVID-19 disease pathogenesis. Quantifying the kinetics of the secondary immune response from subsequent doses beyond the primary series and understanding how dose-dependent immune waning kinetics vary as a function of age, sex, and various comorbidities remains an important question. We study anti-spike IgG waning kinetics in 152 individuals who received an mRNA-based primary series (first two doses) and a subset of 137 individuals who then received an mRNA-based booster dose. We find the booster dose elicits a 71-84% increase in the median Anti-S half life over that of the primary series. We find the Anti-S half life for both primary series and booster doses decreases with age. However, we stress that although chronological age continues to be a good proxy for vaccine-induced humoral waning, immunosenescence is likely not the mechanism, rather, more likely the mechanism is related to the presence of noncommunicable diseases, which also accumulate with age, that affect immune regulation. We are able to independently reproduce recent observations that those with pre-existing asthma exhibit a stronger primary series humoral response to vaccination than compared to those that do not, and further, we find this result is sustained for the booster dose. Finally, via a single-variate Kruskal-Wallis test we find no difference between male and female humoral decay kinetics, however, a multivariate approach utilizing Least Absolute Shrinkage and Selection Operator (LASSO) regression for feature selection reveals a statistically significant (p ), albeit small, bias in favour of longer-lasting humoral immunity amongst males.
Keywords: Asthma; Booster dose; Humoral immunity; Immunogenicity; Immunosenescence; SARS-CoV-2.
© 2024. The Author(s).
Conflict of interest statement
The authors declare no competing interests.
Figures

Similar articles
-
Hybrid Immunity Shifts the Fc-Effector Quality of SARS-CoV-2 mRNA Vaccine-Induced Immunity.mBio. 2022 Oct 26;13(5):e0164722. doi: 10.1128/mbio.01647-22. Epub 2022 Aug 24. mBio. 2022. PMID: 36000735 Free PMC article.
-
Study of efficacy and longevity of immune response to third and fourth doses of COVID-19 vaccines in patients with cancer: A single arm clinical trial.Elife. 2023 Mar 28;12:e83694. doi: 10.7554/eLife.83694. Elife. 2023. PMID: 36975207 Free PMC article. Clinical Trial.
-
Humoral and Cellular Immune Response After a 3-Dose Heterologous SARS-CoV-2 Vaccination Using the mRNA-BNT162b2 and Viral Vector Ad26COVS1 Vaccine in Hemodialysis Patients.Front Immunol. 2022 Jun 23;13:907615. doi: 10.3389/fimmu.2022.907615. eCollection 2022. Front Immunol. 2022. PMID: 35812459 Free PMC article.
-
Humoral response to heterologous prime-booster vaccination in heart transplant recipients aged 18-70 years primed with a viral vector SARS-CoV-2 vaccine.Transpl Infect Dis. 2022 Dec;24(6):e13935. doi: 10.1111/tid.13935. Epub 2022 Aug 23. Transpl Infect Dis. 2022. PMID: 35980217 Free PMC article.
-
Third dose of anti-SARS-CoV-2 vaccine for patients with cancer: Should humoral responses be monitored? A position article.Eur J Cancer. 2022 Feb;162:182-193. doi: 10.1016/j.ejca.2021.12.011. Epub 2021 Dec 16. Eur J Cancer. 2022. PMID: 35016032 Free PMC article. Review.
Cited by
-
Mechanistic models of humoral kinetics following COVID-19 vaccination.J R Soc Interface. 2025 Jan;22(222):20240445. doi: 10.1098/rsif.2024.0445. Epub 2025 Jan 29. J R Soc Interface. 2025. PMID: 39876790 Free PMC article.
-
Long-Term Immunity against SARS-CoV-2 Wild-Type and Omicron XBB.1.5 in Indonesian Residents after Vaccination and Infection.Antibodies (Basel). 2024 Sep 2;13(3):72. doi: 10.3390/antib13030072. Antibodies (Basel). 2024. PMID: 39311377 Free PMC article.
-
Longitudinal Surveillance of COVID-19 Antibodies in Pediatric Healthcare Workers.Vaccines (Basel). 2025 Feb 7;13(2):163. doi: 10.3390/vaccines13020163. Vaccines (Basel). 2025. PMID: 40006710 Free PMC article.
-
High SARS-CoV-2 antibody levels after three consecutive BNT162b2 booster vaccine doses in nursing home residents.Immun Ageing. 2025 Jan 2;22(1):1. doi: 10.1186/s12979-024-00495-4. Immun Ageing. 2025. PMID: 39748353 Free PMC article.
-
Inclusion of a retroviral protease enhances the immunogenicity of VLP-forming mRNA vaccines against HIV-1 or SARS-CoV-2 in mice.Sci Transl Med. 2025 Apr 30;17(796):eadt9576. doi: 10.1126/scitranslmed.adt9576. Epub 2025 Apr 30. Sci Transl Med. 2025. PMID: 40305570 Free PMC article.
References
-
- WHO Coronavirus (COVID-19) Dashboard. World Health Organization. https://covid19.who.int (2023).
-
- COVID-19 vaccine doses administered by manufacturer, European Union. https://ourworldindata.org/grapher/covid-vaccine-doses-by-manufacturer (2023).
MeSH terms
Substances
Grants and funding
LinkOut - more resources
Full Text Sources
Medical
Miscellaneous
