. 2024 Apr 18;10(1):42.
doi: 10.1038/s41540-024-00369-x.

Characterizing heterogeneous single-cell dose responses computationally and experimentally using threshold inhibition surfaces and dose-titration assays

Affiliations

Characterizing heterogeneous single-cell dose responses computationally and experimentally using threshold inhibition surfaces and dose-titration assays

Patrick C Kinnunen et al. NPJ Syst Biol Appl. .

Abstract

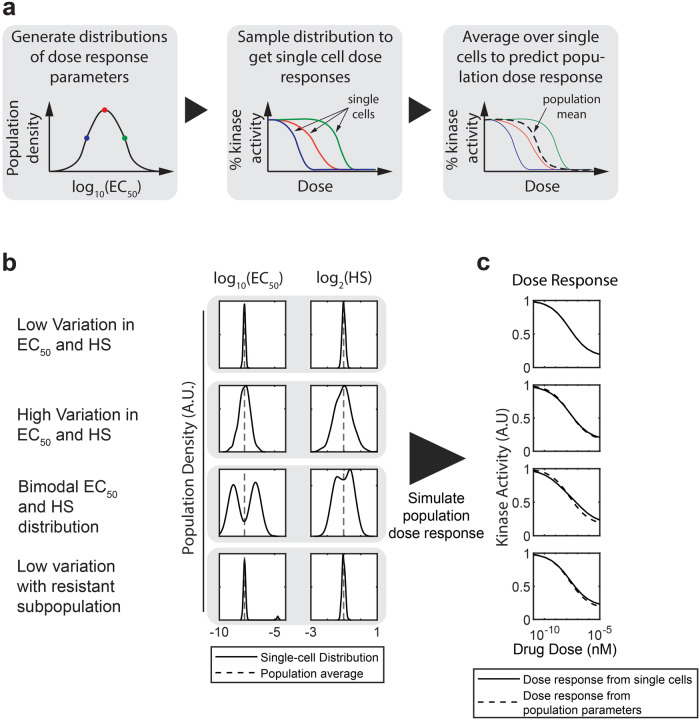
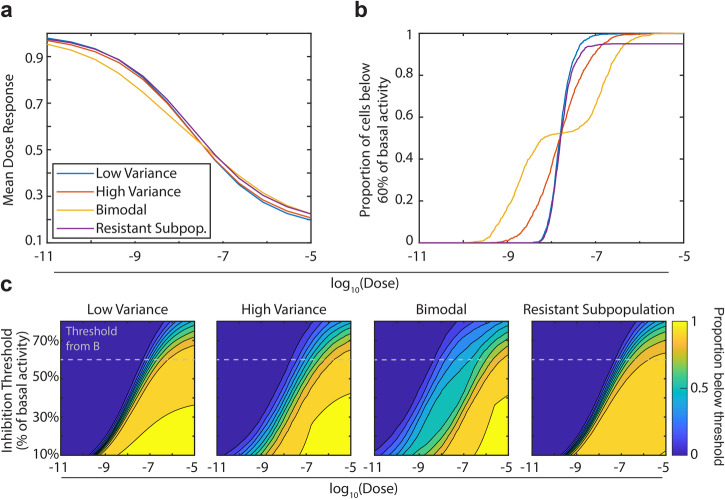
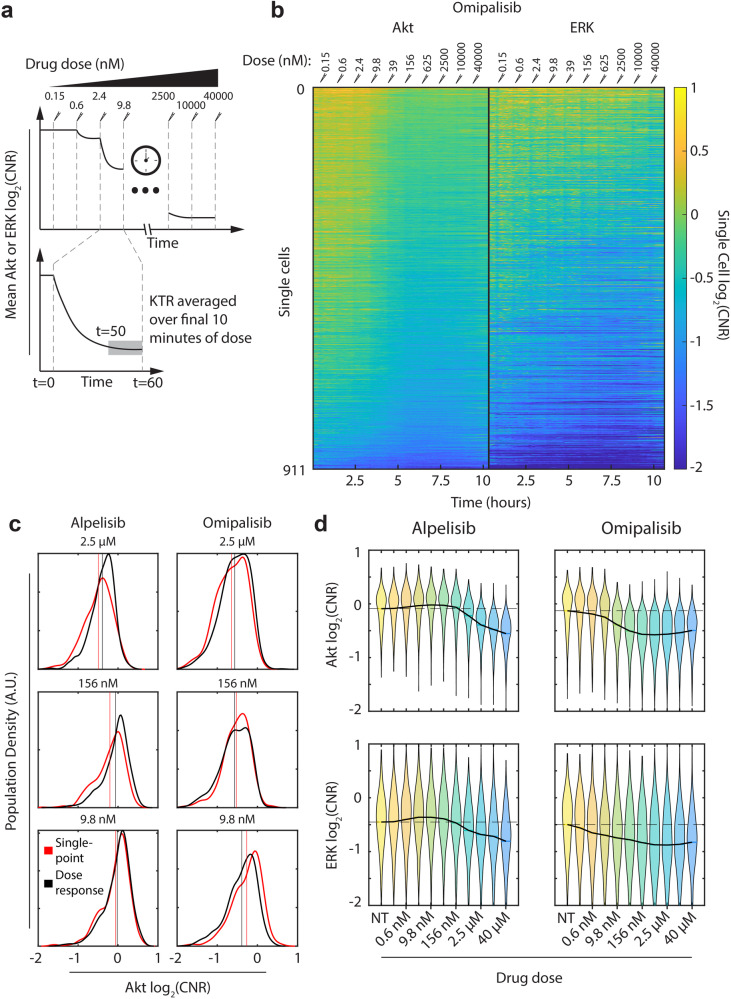
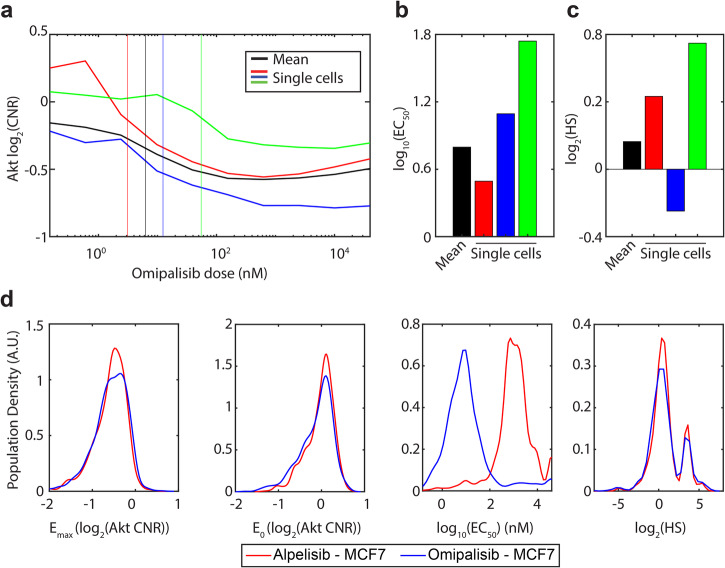
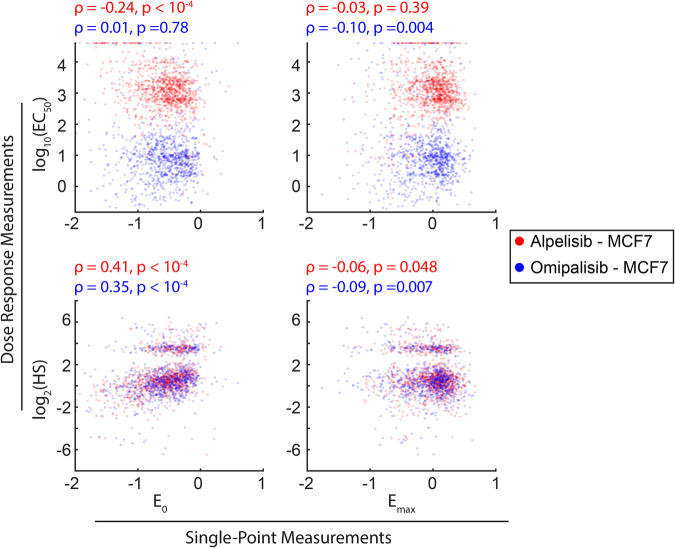
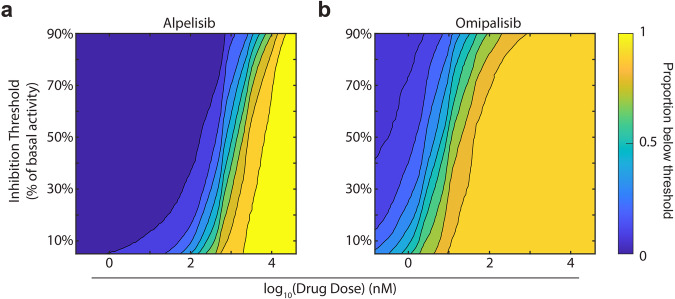
Single cancer cells within a tumor exhibit variable levels of resistance to drugs, ultimately leading to treatment failures. While tumor heterogeneity is recognized as a major obstacle to cancer therapy, standard dose-response measurements for the potency of targeted kinase inhibitors aggregate populations of cells, obscuring intercellular variations in responses. In this work, we develop an analytical and experimental framework to quantify and model dose responses of individual cancer cells to drugs. We first explore the connection between population and single-cell dose responses using a computational model, revealing that multiple heterogeneous populations can yield nearly identical population dose responses. We demonstrate that a single-cell analysis method, which we term a threshold inhibition surface, can differentiate among these populations. To demonstrate the applicability of this method, we develop a dose-titration assay to measure dose responses in single cells. We apply this assay to breast cancer cells responding to phosphatidylinositol-3-kinase inhibition (PI3Ki), using clinically relevant PI3Kis on breast cancer cell lines expressing fluorescent biosensors for kinase activity. We demonstrate that MCF-7 breast cancer cells exhibit heterogeneous dose responses with some cells requiring over ten-fold higher concentrations than the population average to achieve inhibition. Our work reimagines dose-response relationships for cancer drugs in an emerging paradigm of single-cell tumor heterogeneity.


Conflict of interest statement

The authors declare no competing interests.

Figures

Fig. 1
Fig. 1. Modeling dose responses from heterogeneous populations.
a Schematic of model showing how we generate individual dose responses by sampling from distributions of parameters and then averaging across sampled cells to simulate the population dose response. b Simulated population densities (smoothed histograms of the proportion of cells with a given dose response parameter value) of EC50 and Hill slope parameters for four different hypothetical populations. Dashed lines represent the EC50 or Hill slope inferred from population level data, while solid lines are the simulated distribution. Note that all four populations have almost identical population means. c The resulting overall dose responses from averaging over cells sampled from each population in (b). Solid lines represent the average from sampling each population 1000 times, while the dashed line represents the dose response from the measured population dose response parameters (dashed lines in b).
Fig. 2
Fig. 2. Threshold inhibition curves and surfaces capture heterogeneity in dose response.
a Population averaged dose responses from simulated populations in Fig. 1. b Threshold inhibition curve for the same populations in Fig. 1. The curves were calculated by sampling each population 1000 times, and then calculating the proportion of the population inhibited to below 60% of their basal signaling at each dose. c Threshold inhibition surfaces, calculated as in (b) but with a varying threshold. A dashed line has been added at the 60% threshold, profiles along these lines correspond to the lines in (b).
Fig. 3
Fig. 3. Measuring dose responses in individual cells.
a Experimental approach. Cells are exposed to a single concentration of alpelisib or omipalisib for an h, and the single-cell response is averaged over the last 10 min of exposure. Then, a higher concentration is added. Each concentration is 4× greater than the previous one. Concentrations range from 150 pM to 40 μM. b Kymograph showing single-cell trajectories of each MCF-7 cell measured in an omipalisib dose-response experiment. Each row is a single cell, and each column is a different time point, with color representing the signaling activity. Paired Akt and ERK trajectories are shown, with Akt on the left and ERK on the right. Cells are sorted by the area under the curve of their Akt trajectory. The dose of omipalisib at each timepoint is shown at the top of the kymograph. c Comparison of Akt signaling distributions when exposed to a given drug concentration in a single-point experiment (red) and a dose response experiment (gray). Each distribution was generated using kernel smoothing. Vertical lines indicate the population mean of each distribution. d Akt (top) and ERK (bottom) dose-dependent signaling activity in response to alpelisib (left) and omipalisib (right). In each plot, the distribution of signaling activity is shown as a violin, while the mean dose response is indicated with a solid black line. A horizontal dashed black line is included at the untreated mean to guide the eye. The full list of doses used in the figure, from left to right in increasing order, is: No treatment (NT), 0.15 nM, 0.6 nM, 2.4 nM, 9.8 nM, 39 nM, 156 nM, 625 nM, 2.5 μM, 10 μM, 40 μM.
Fig. 4
Fig. 4. Characterizing heterogeneous dose responses.
a Mean dose response (from Fig. 1d, top right) and three representative individual dose responses for MCF-7 cells exposed to Omipalisib. Vertical lines indicate the EC50, obtained by fitting Eq. 1 to each individual dose response. b, c Bar graphs comparing the EC50 and Hill slope parameters for the mean and single-cell dose responses shown in (a). d Distributions of dose response parameters extracted from single cells for both alpelisib and omipalisib. Distributions are the kernel-smoothed density of the underlying data. For alpelisib N = 1040 cells and for omipalisib N = 911 cells.
Fig. 5
Fig. 5. Single-point measurements do not predict dose-response parameters.
Correlation between single-point parameters (E0, Emax) and dose-response parameters (Hill slope, EC50) for MCF-7 cells exposed to an omipalisib dose-titration of either alpelisib (red) or omipalisib (blue).
Fig. 6
Fig. 6. Threshold inhibition surfaces for experimental populations.
We calculated threshold inhibition surfaces as in Fig. 2 for experimental populations of MCF-7 cells exposed to alpelisib (a) or omipalisib (b). In (a), N = 1040 cells. In (b), N = 911 cells.

Similar articles

Cited by

References

    1. Juric D, et al. Alpelisib plus fulvestrant in PIK3CA-altered and PIK3CA-wild-type estrogen receptor–positive advanced breast cancer: a phase 1b clinical trial. JAMA Oncol. 2019;5:e184475–e184475. doi: 10.1001/jamaoncol.2018.4475. - DOI - PMC - PubMed
    1. Markham A. Alpelisib: first global approval. Drugs. 2019;79:1249–1253. doi: 10.1007/s40265-019-01161-6. - DOI - PubMed
    1. Bollag G, et al. Vemurafenib: the first drug approved for BRAF-mutant cancer. Nat. Rev. Drug Discov. 2012;11:873–886. doi: 10.1038/nrd3847. - DOI - PubMed
    1. Ng TSC, et al. Overcoming differential tumor penetration of BRAF inhibitors using computationally guided combination therapy. Sci. Adv. 2022;8:eabl6339. doi: 10.1126/sciadv.abl6339. - DOI - PMC - PubMed
    1. Kodack DP, et al. The brain microenvironment mediates resistance in luminal breast cancer to PI3K inhibition through HER3 activation. Sci. Transl. Med. 2017;9:eaal4682. doi: 10.1126/scitranslmed.aal4682. - DOI - PMC - PubMed

Substances