. 2024 Apr 18;15(1):3333.
doi: 10.1038/s41467-024-47520-0.

Tracing genetic diversity captures the molecular basis of misfolding disease

Affiliations

Tracing genetic diversity captures the molecular basis of misfolding disease

Pei Zhao et al. Nat Commun. .

Abstract

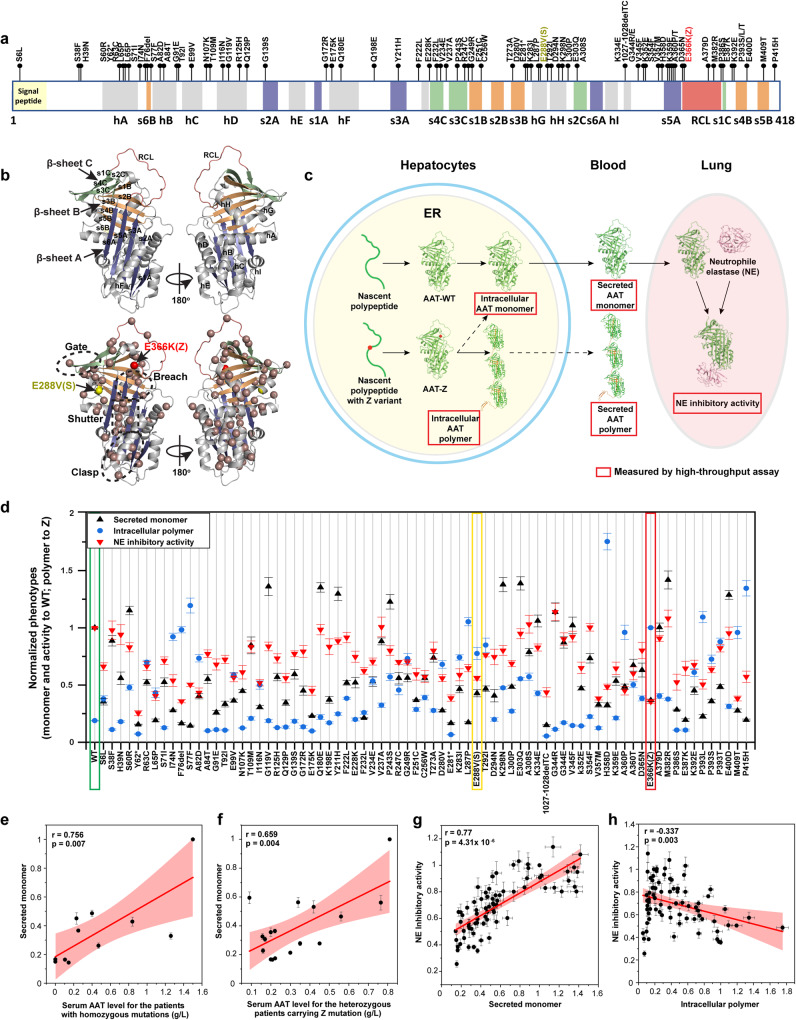
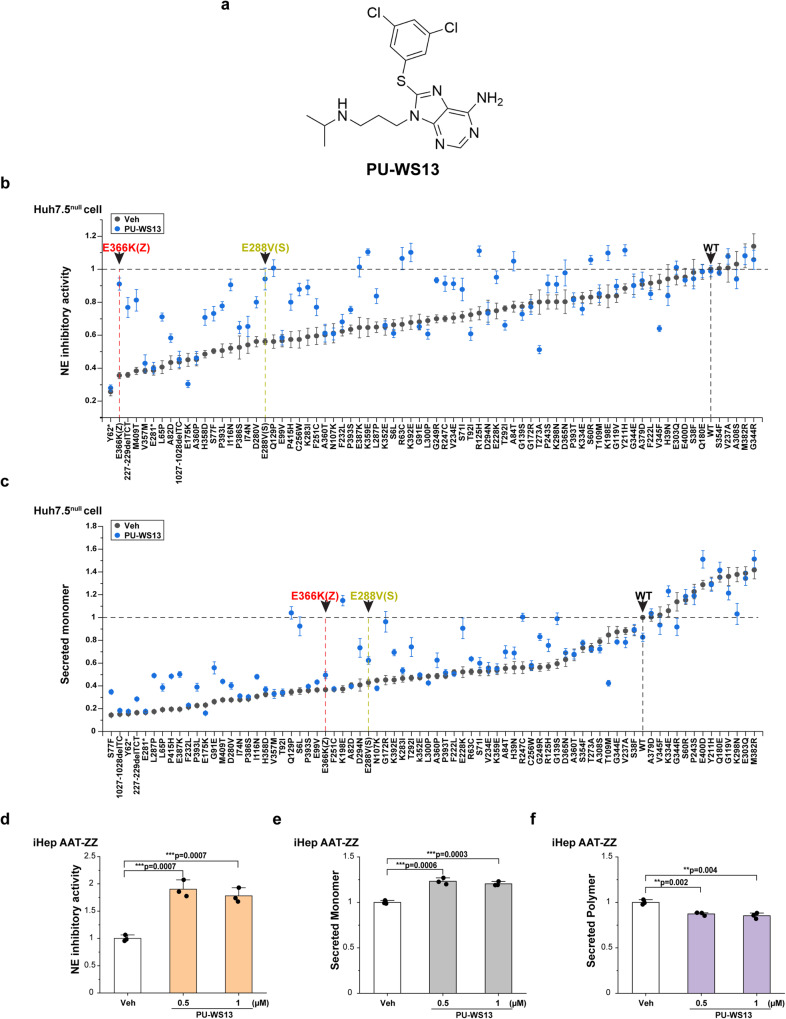
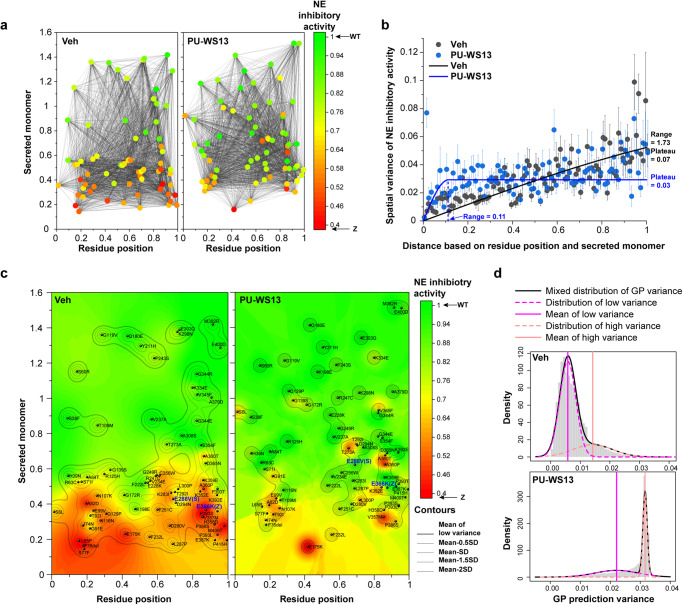
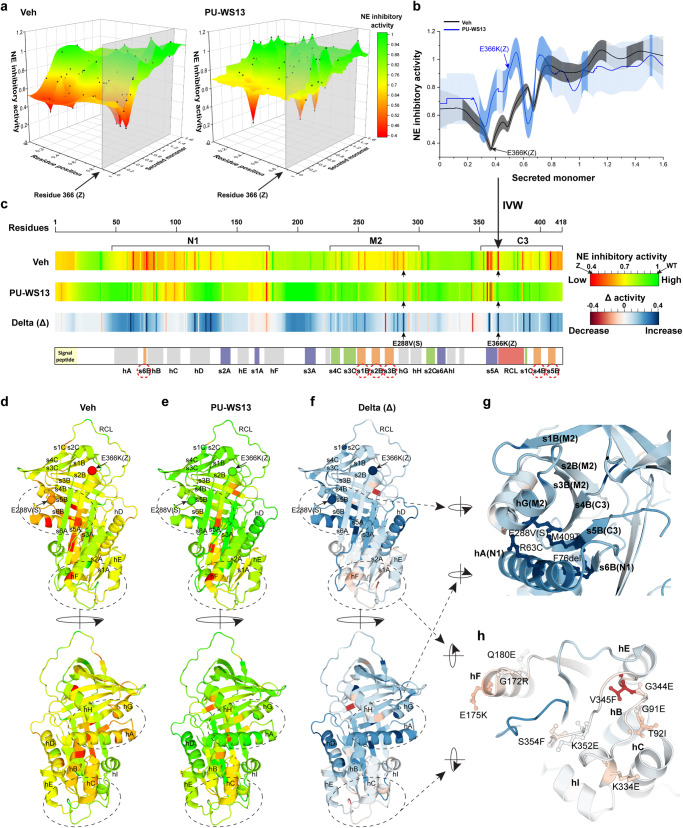
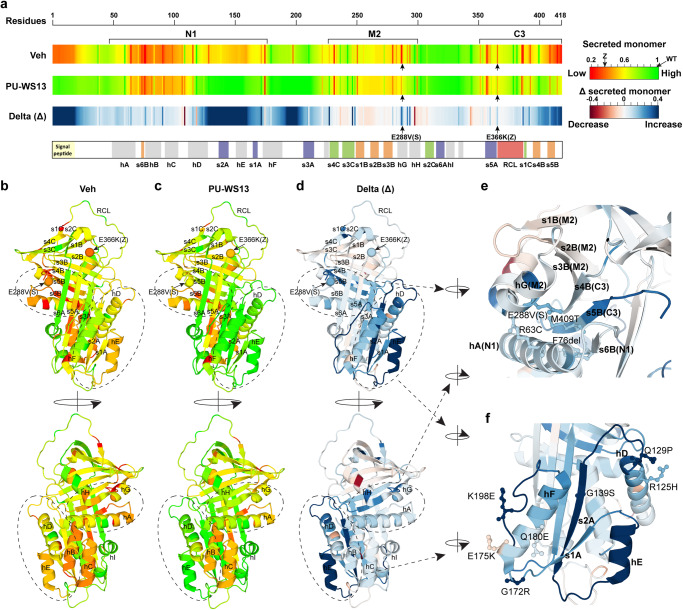
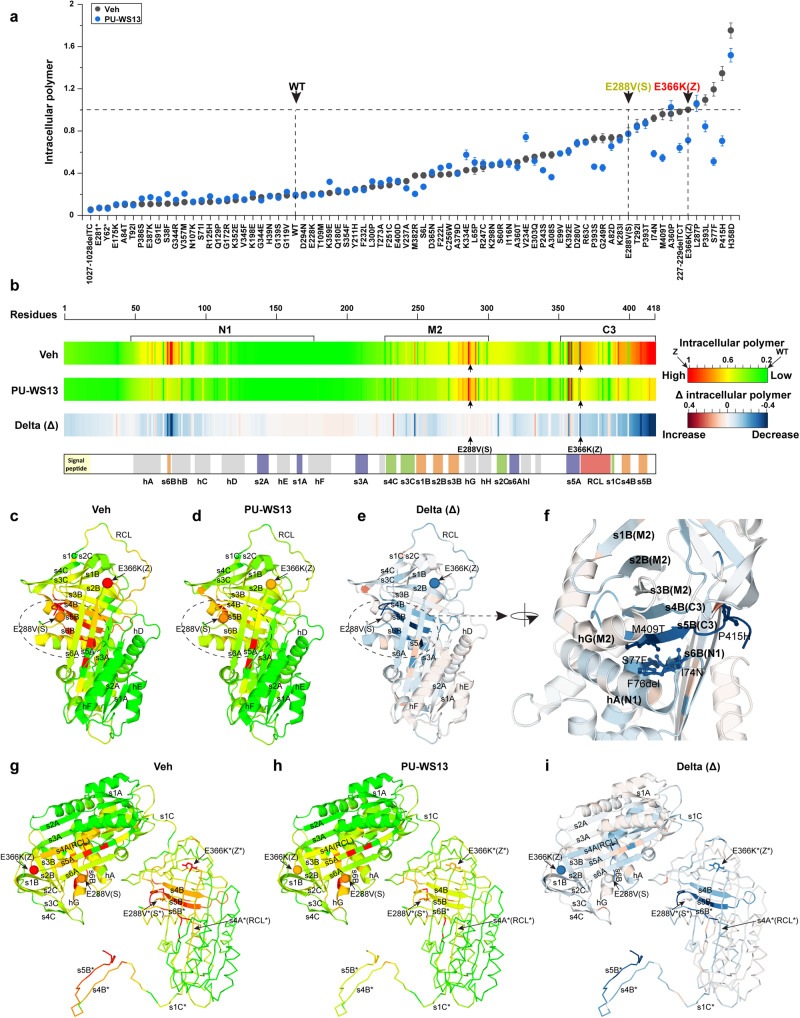
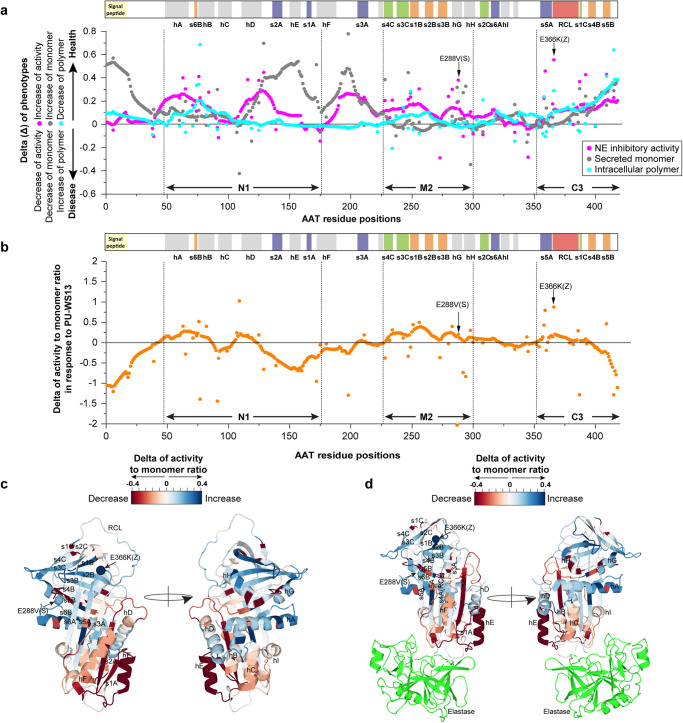
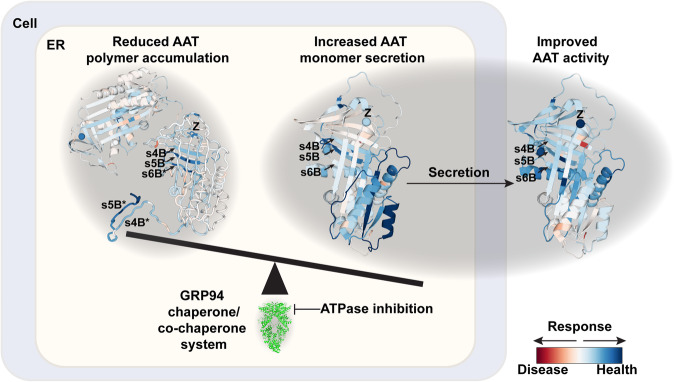
Genetic variation in human populations can result in the misfolding and aggregation of proteins, giving rise to systemic and neurodegenerative diseases that require management by proteostasis. Here, we define the role of GRP94, the endoplasmic reticulum Hsp90 chaperone paralog, in managing alpha-1-antitrypsin deficiency on a residue-by-residue basis using Gaussian process regression-based machine learning to profile the spatial covariance relationships that dictate protein folding arising from sequence variants in the population. Covariance analysis suggests a role for the ATPase activity of GRP94 in controlling the N- to C-terminal cooperative folding of alpha-1-antitrypsin responsible for the correction of liver aggregation and lung-disease phenotypes of alpha-1-antitrypsin deficiency. Gaussian process-based spatial covariance profiling provides a standard model built on covariant principles to evaluate the role of proteostasis components in guiding information flow from genome to proteome in response to genetic variation, potentially allowing us to intervene in the onset and progression of complex multi-system human diseases.


Conflict of interest statement

The authors declare no competing interests.

Figures

Fig. 1
Fig. 1. Quantification of secreted monomer, intracellular polymer, and NE inhibitory activity for AAT variants.
a 75 AAT variants from the worldwide population investigated in this study are distributed at different structural elements across the entire AAT polypeptide sequence. Eight α-helices (hA-hI) are indicated by gray blocks. Three β-sheets comprising s1-6A (sheet A), s1-6B (sheet B), and s1-4C (sheet C) are highlighted by blue, orange, and green, respectively. The reaction central loop (RCL) is illustrated by the pink block. Z (E366K) and S (E288V) variants are labeled in red and yellow, respectively. b Distribution of the variants in the 3D structure of AAT (PDB: 3NE4). The alpha carbon of the variant residues are shown as brown balls. The gate, breach, shutter, and clasp regions are indicated. β-sheets A, B, and C are highlighted. c WT AAT is synthesized in the endoplasmic reticulum (ER) of hepatocytes and secreted as a monomer into circulation for delivery to lung to perform its Neutrophil elastase (NE) inhibitory activity. AAT variants such as Z (E366K) lead to intracellular polymerization that reduces AAT secretion and function. We have developed high-throughput assays (indicated by red squares) to measure the intracellular monomer and polymer, secreted monomer and polymer, and NE inhibitory activity for each of the AAT variants. d The levels of secreted monomer, intracellular polymer and NE inhibitory activity for WT-AAT and 75 AAT variants transfected in Huh7.5null cells are shown (see “Methods“). The secreted monomer and NE inhibitory activity are normalized to WT values. The intracellular polymer is normalized to AAT-Z value. e, f Correlation between measured secreted monomer levels and reported serum AAT levels in AATD patients who are homozygous with the indicated variant genotype (e), or from heterozygous patients who share the common Z allele (f). g, h Correlation between the NE inhibitory activity of AAT variants and the secreted monomer (g) or intracellular polymer levels (h). The Pearson’s r values and the corresponding P values (one-way ANOVA) for the presented correlations are indicated. 95% confidence intervals of the correlation are indicated by light red region. Data is presented as means ± SD. Sample size n = 3 biologically independent measurements for secreted monomer, NE inhibitory activity and intracellular polymer of each variant. The sample size for the patients with reported AAT serum levels for different genotypes was indicated in the Source Data file.
Fig. 2
Fig. 2. GRP94 ATPase inhibitor PU-WS13 rescues the NE inhibitory activity, and monomer secretion of AAT variants.
a The chemical structure of PU-WS13. b, c The responses of AAT variants to PU-WS13 (1 μM) in Huh7.5null cell for NE inhibitory activity (b) and secreted monomer (c). The variants were ordered by basal condition values from lowest value to highest value. WT, Z allele and S allele are labeled and highlighted by arrows. Data are presented as mean ± SD, n = 3 biologically independent measurements. df Human iPSC-derived AAT-ZZ hepatocytes (iHep AAT-ZZ) (iHepZZ) were treated in the presence or absence of PU-WS13 at 0.5 µM and 1 µM for 24 h. The NE inhibitory activity of secreted AAT-Z proteins from iHep AAT-ZZ cell was measured using fluorogenic substrate of NE (d). Secreted AAT-Z monomer was measured by ELISA using monomer-specific antibody 16F8 (e). The secreted polymer was measured by ELISA using polymer-specific antibody 2C1 (f). Data are presented as mean ± SD, n = 3 biologically independent measurements. Student’s t test, two tailed. *P < 0.05; **P < 0.01; ***P < 0.001; N.S., P > 0.05.
Fig. 3
Fig. 3. GP-based phenotype landscapes in response to GRP94 ATPase inhibition.
a AAT variants are organized by their variant residue position (x axis) normalized by the full-length polypeptide sequence, secreted monomer (y axis) and NE inhibitory activity (z axis, color scale) in the absence (left panel) or presence (right panel) of PU-WS13. b All possible pairwise combinations of variants are analyzed (illustrated as black lines in (a)). The relationships between the spatial variance of NE inhibitory activity and the distance values defined by variant residue positions and monomer secretion are modeled by molecular variograms in the absence (black dots and line) or presence (blue dots and line) of PU-WS13 (left panel). Data are presented as mean ± SEM, n of pairwise combinations based on biologically independent measurements of variants is indicated in the Source Data file. The correlation distance range and plateau value of each variogram are indicated. c Phenotype landscapes generated by GP-based VSP approach linking secreted monomer (y axis) and NE inhibitory activity (z axis, color scale) across the entire AAT polypeptide residue positions (x axis) in the absence (left panel) or presence (right panel) of PU-WS13. d A two-component Gaussian mixture model to separate the low vs high GP-generated variance for each prediction in the absence or presence of PU-WS13. The density of the separated distributions for low variance (magenta dash line) and high variance (pink dash line) are shown. The mixed distribution is illustrated as a black curve. The mean of the low variance distribution (magenta line) and high variance distribution (pink line) are indicated. The mean of the distribution of low GP variance and the standard deviation (SD) below the mean are illustrated as contours in the phenotype landscapes (c) to indicate high-confidence predictions.
Fig. 4
Fig. 4. Residue-by-residue responses of NE inhibitory activity to PU-WS13.
a To project a 3D view of the phenotype landscapes, the predicted NE inhibitory activity is shown on the z axis of the landscape in the absence (left panel) and presence (right panel) of PU-WS13. The predicted values for residue 366 where AAT-Z variant is located are highlighted by gray slices. b The data highlighted by the gray slice in (a) for residue 366 is plotted in the absence (black line), and the presence (blue line) of PU-WS13 is presented as mean ± SD. The dark-gray or dark-blue error bars indicate the high-confidence predictions defined by the two-component Gaussian mixture modeling (Fig. 3d). These high-confidence values are used in the inverse variance weighting (IVW) (see “Methods”) to compute the most likely NE inhibitory activity for each residue. This procedure is performed for each residue comprising the AAT polypeptide sequence. c The IVW computed values for each residue are plotted from N-terminal to C-terminal to report residue-based NE inhibitory activity barcode in the absence (upper barcode) or presence (middle barcode) of PU-WS13. The delta (Δ) values between them are presented as the lower barcode. The regions harboring residues that are <75% WT NE inhibitory activity under basal conditions are labeled as N1, M2 and C3. The secondary structure elements of the AAT sequence are indicated in the bottom panel. dh Mapping the residue-based NE inhibitory activity in the absence (d) and presence (e) of PU-WS13, and their delta (Δ) values (f) to AAT 3D structures (PDB:3NE4). The structural region highly responsive to PU-WS13 is zoomed in (g), while the non-responsive structural region is zoomed in (h).
Fig. 5
Fig. 5. Residue-by-residue responses of monomer secretion to PU-WS13.
a Residue-based monomer secretion barcodes derived from the phenotype landscapes through IVW in the absence (upper barcode) or presence (middle barcode) of PU-WS13. The delta (Δ) values between them are presented as the lower barcode. bf Mapping the residue-based monomer secretion in the absence (b) and presence (c) of PU-WS13, and their delta (Δ) values (d) to AAT 3D structure. The region that is highly corrected on NE inhibitory activity illustrated in Fig. 4e is zoomed in for comparison to the PU-WS13 impact on monomer secretion (e). The top responding structure region for monomer secretion is zoomed in (f).
Fig. 6
Fig. 6. Residue-by-residue responses of intracellular polymer to PU-WS13.
a The responses of AAT variants to PU-WS13 in Huh7.5null cell for intracellular polymer. Data are presented as mean ± SD, n = 3 biologically independent measurements. b Residue-based intracellular polymer barcodes derived from the phenotype landscapes through IVW in the absence (upper barcode) or presence (middle barcode) of PU-WS13. The delta (Δ) values between them are presented as the lower barcode. cf Mapping the residue-based intracellular polymer in the absence (c) and presence (d) of PU-WS13, and their delta (Δ) values (e) to AAT monomer structure. The highly responding region to PU-WS13 for the intracellular polymer is zoomed in (f). gi Mapping the residue-based intracellular polymer in the absence (g) and presence (h) of PU-WS13, and their delta (Δ) values (i) to AAT polymer structure (PDB: 3T1P).
Fig. 7
Fig. 7. Differential responses of different phenotypes for each residue of AAT to GRP94 ATPase inhibition.
a Overlay of the delta value between the DMSO vehicle and PU-WS13 treatment for the residue-based NE inhibitory activity (magenta), monomer secretion (gray), and intracellular polymer level (cyan). Positive delta values indicated as improvement of NE inhibitory activity, an increase of monomer secretion and decrease of intracellular polymer. N1, M2, and C3 sequence regions, which are in rich of variants leading to defective NE inhibitory activity at basal state, are labeled. b Residue-by-residue activity to monomer ratio in response to PU-WS13. The NE inhibitory activity and secreted monomer ratio values are computed from both vehicle and PU-WS13 states for each residue. The delta value of the activity-to-monomer ratio in response to PU-WS13 for each residue is plotted. c, d Mapping the delta (Δ) of activity to monomer ratio on AAT monomeric structure (c) and the complex structure of AAT-elastase (PDB: 2D26) (d).
Fig. 8
Fig. 8. GRP94 manages the N- to C-terminal cooperative folding of AAT to shape the balance between AAT aggregation monomer secretion for function.
The delta (Δ) phenotype structures of NE inhibitory activity (Fig. 4f), monomer secretion (Fig. 5d) and intracellular polymer (Fig. 6i) are presented to illustrate the residue-by-residue responses of AAT (Fig. 7a) to GRP94 ATPase inhibitor PU-WS13. Blue residues indicate the responsive regions for improved AAT activity, increased monomer secretion and reduced polymer accumulation. The highly corrected regions for all the phenotypes by GRP94 ATPase inhibition involve long-range interactions between s6B from N1 region and s4B-s5B from C3 region that are highlighted by arrows. Modulation of GRP94 chaperone/co-chaperone system by ATPase inhibition through PU-WS13 treatment improves the SCV integrity of β-sheet B for AAT variants to rebalance AAT aggregation with function to reduce the intracellular polymer accumulation and increase the monomer secretion and extracellular NE inhibitory activity.

Similar articles

Cited by

References

    1. Wang, C. & Balch, W. E. Bridging genomics to phenomics at atomic resolution through variation spatial profiling. Cell Rep.24, 2013–2028 e6 (2018). - PMC - PubMed
    1. Gershenson A, Gierasch LM, Pastore A, Radford SE. Energy landscapes of functional proteins are inherently risky. Nat. Chem. Biol. 2014;10:884–891. doi: 10.1038/nchembio.1670. - DOI - PMC - PubMed
    1. Balch WE, Morimoto RI, Dillin A, Kelly JW. Adapting proteostasis for disease intervention. Science. 2008;319:916–919. doi: 10.1126/science.1141448. - DOI - PubMed
    1. Sinnige T, Yu A, Morimoto RI. Challenging proteostasis: role of the chaperone network to control aggregation-prone proteins in human disease. Adv. Exp. Med. Biol. 2020;1243:53–68. doi: 10.1007/978-3-030-40204-4_4. - DOI - PMC - PubMed
    1. Jayaraj GG, Hipp MS, Hartl FU. Functional modules of the proteostasis network. Cold Spring Harb. Perspect. Biol. 2020;12:a033951. doi: 10.1101/cshperspect.a033951. - DOI - PMC - PubMed

Substances