. 2024 Apr 18;15(1):3351.
doi: 10.1038/s41467-024-47671-0.

The genetic landscape of a metabolic interaction

Affiliations

The genetic landscape of a metabolic interaction

Thuy N Nguyen et al. Nat Commun. .

Abstract

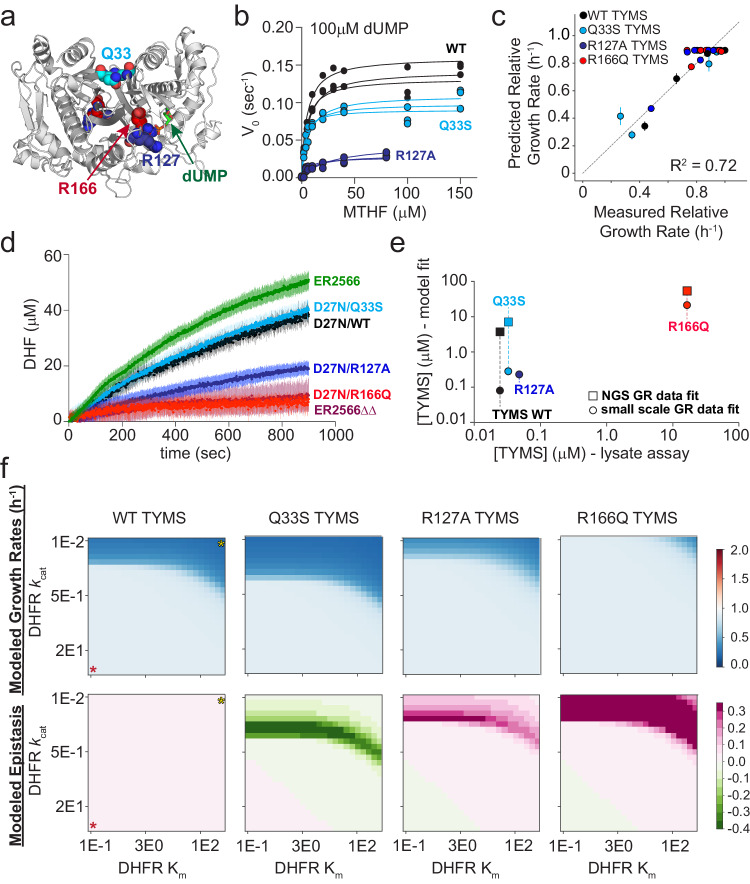
While much prior work has explored the constraints on protein sequence and evolution induced by physical protein-protein interactions, the sequence-level constraints emerging from non-binding functional interactions in metabolism remain unclear. To quantify how variation in the activity of one enzyme constrains the biochemical parameters and sequence of another, we focus on dihydrofolate reductase (DHFR) and thymidylate synthase (TYMS), a pair of enzymes catalyzing consecutive reactions in folate metabolism. We use deep mutational scanning to quantify the growth rate effect of 2696 DHFR single mutations in 3 TYMS backgrounds under conditions selected to emphasize biochemical epistasis. Our data are well-described by a relatively simple enzyme velocity to growth rate model that quantifies how metabolic context tunes enzyme mutational tolerance. Together our results reveal the structural distribution of epistasis in a metabolic enzyme and establish a foundation for the design of multi-enzyme systems.


Conflict of interest statement

The authors declare no competing interests.

Figures

Fig. 1
Fig. 1. Constructing a biochemistry-to-growth model for DHFR and TYMS.
a Schematic of metabolic control. Many enzymes show a hyperbolic relationship between velocity and flux; the enzyme control coefficient describes the fractional change in flux given a fractional change in velocity. Control coefficients vary with starting enzyme velocity (purple and dark blue arrows, background A) and can change with genetic background (violet and light blue arrows, background B). Consequently mutations can have a strong effect on flux and growth in one background but not another. b DHFR and TYMS in folate metabolism. Metabolites are in gray or black italic text. Dotted lines indicate multiple intermediate reactions summarized with a single line. c A simplified, abstracted version of the DHFR and TYMS system. Again dotted lines indicate multiple intermediate reactions summarized with a single line. d The relationship between experimentally measured relative abundance of [10-formyl-THF] and E. coli growth rate. Each point is a particular DHFR/TYMS genotype. Red points indicate five DHFR variants in the background of TYMS R166Q and black indicates the same DHFR variants in the context of WT TYMS. Error bars indicate the standard deviation across N = 3 replicates for growth rate (y-axis) and 10-formyl-THF abundance (x-axis), centered at the mean. The blue dotted line is the best fit hyperbolic model (Eq. (1)) relating THF abundance to growth. e Correlation between experimentally measured log10[10-formyl-THF] relative abundance and model prediction (as computed with Eq. (3)). The gray dotted line indicates x = y. Color coding is identical to (d). Error bars in x indicate the standard deviation across N = 3 replicate experiments (centered at the mean), error bars in y are standard deviation across ten fits obtained by jackknife (leave-one-out) sub-sampling the data and refitting (centered at the mean). f Correlation between experimentally measured and predicted growth rates for five DHFR point mutations in two TYMS backgrounds (same mutants as d, e). The gray dotted line indicates x = y. Color coding is identical to (d). Error bars in x indicate the standard deviation across N = 3 experimental replicates, error bars in y describe the standard deviation obtained by jackknife (leave-one-out) sub-sampling the data and refitting the model ten times (all points centered at the mean).
Fig. 2
Fig. 2. TYMS catalytic activity modulates the epistatic constraints on DHFR sequence and catalytic activity.
a Location of the TYMS point mutations (PDBID: 1BID). TYMS is an obligate domain-swapped homodimer; active sites include residues from both monomers (white and gray cartoon). Positions mutated in this study are in colored spheres (Q33—cyan, R127—navy, R166—red). The dUMP substrate is in green sticks. b Michaelis Menten enzyme kinetics for WT TYMS (black), TYMS Q33S (cyan), and TYMS R127A (navy). Experimental replicates (3 total) are plotted individually. Points indicate experimental data and lines the best fit steady state model. c Correlation between experimentally measured and model-predicted relative growth rates for seven DHFR variants in four TYMS backgrounds. Each point represents one DHFR/TYMS genotype. Error bars in the x direction are SEM across triplicate growth rate measurements, error bars in y are the SEM estimated from jackknife (leave-one-out) sub-sampling the data and refitting the model. The points themselves are mean-centered. d TYMS lysate assays. Curves indicate DHF accumulation over time following substrate addition to crude lysates of WT ER2566 (green), ER2566 ΔfolA ΔthyA (maroon), or ER2566 ΔfolA ΔthyA cells containing plasmid-encoded DHFR D27N paired with TYMS Q33S (cyan), TYMS WT (black), TYMS R127A (navy), or TYMS R166Q (red). Each curve represents the mean of three replicates,the shaded region describes standard deviation. e Correlation between intracellular TYMS concentrations determined by model fit and lysate assay. TYMS color coding follows from (a–d). Circles show model fit values obtained from the small scale plate reader assay (as in (c)), while squares show fit values obtained from the deep mutational scan (as in Fig. 5a–c). TYMS R127A was not included in the deep mutational scan. f Heatmaps of simulated growth rates (top row) and epistasis (bottom row) computed over a range of DHFR kinetic parameters in four TYMS backgrounds. In the left-most column a red star marks the highest activity enzyme (low Km, high kcat), while a yellow star marks the lowest activity enzyme. Growth rates are indicated with a blue-white-red color map, where a relative growth rate of one (white) is equivalent to WT. Epistasis values are indicated with a green-white-pink color map, where zero epistasis is shown in white.
Fig. 3
Fig. 3. The effects of DHFR mutation on growth rate in three TYMS backgrounds.
a Sequencing-based growth rate measurements for DHFR F31V in three TYMS backgrounds: R166Q (red), Q33S (cyan), and WT (black). Each point represents one triplicate experimental measurement. Dotted lines indicate linear regression fits to each replicate, the slope of each line is the inferred growth rate (relative to WT) for that DHFR/TYMS mutant combination. b Heatmaps of the growth rate effect for all DHFR single mutations. DHFR positions are along the horizontal axis; amino acid residues (along the vertical axis) are organized by physiochemical similarity. The displayed relative growth rate is an average across three replicates, and is normalized such that the WT DHFR is equal to one. Red indicates mutations that increase growth rate, white indicates mutations with wild-type like growth, and blue indicates mutations that decrease growth rate. Null mutations (black squares) were not observed by sequencing after the first two time points, and thus there was insufficient data for growth rate inference. Small dots mark the WT residue identity in each column. c The distribution of DHFR mutational effects in the WT TYMS background. The red line indicates a best-fit double gaussian, gray bars are the data. The red, dashed inactive line marks the average relative growth rate for nonsense mutations (stop codons) in the first 120 positions of DHFR. The WT DHFR growth rate is equal to one. d The distribution of DHFR mutational effects in the TYMS Q33S background, color coding identical to (c). e The distribution of DHFR mutational effects in the TYMS R166Q background, color coding identical to (c). Note that the y-axis for (e) is distinct from (c) and (d).
Fig. 4
Fig. 4. Epistatic coupling of DHFR to two TYMS backgrounds.
a Volcano plot examining the statistical significance of epistasis across all DHFR point mutations in the Q33S background. P values were calculated by unequal variance two-sided t test under the null hypothesis that the mutations have equal mean growth rates in both TYMS backgrounds (across triplicate measurements). The red horizontal dashed line marks the standard significance cutoff of P = 0.05, the black horizontal dashed line indicates a multiple-hypothesis testing adjusted p value (P = 0.035). The gray vertical dashed lines indicate an empirical threshold for epistasis. Pink and green indicate statistically significant positive and negative epistasis respectively. b Volcano plot examining the statistical significance of epistasis across all DHFR point mutations in the R166Q background. P values were calculated as in (a); the multiple-hypothesis testing adjusted p-value for the R166Q background was (P = 0.029). Color coding is identical to (a). c Comparison of the relative growth rate effects for DHFR single mutants in the WT and TYMS Q33S backgrounds. The marginal distribution of growth rate effects is shown along each axis. Mutations with statistically significant positive and negative epistasis are indicated in pink and green respectively. The WT relative growth rate equals one, and is indicated with a dashed gray line across each axis. The dashed red line marks x = y. Error bars (in x and y) indicate standard deviation across three experimental measurements, points are centered at the mean. d Comparison of the relative growth rate effects for DHFR single mutants in the WT and TYMS R166Q backgrounds. Plot layout and color coding is identical to (c). Error bars (in x and y) indicate standard deviation across three experimental measurements, points are centered at the mean.
Fig. 5
Fig. 5. Global comparison of the biochemistry-to-growth model and deep mutational scanning data set.
a Correlation between the experimentally measured and predicted growth rates of 114 DHFR/TYMS mutant combinations. Horizontal error bars indicate standard deviation of three replicate experimental growth rate measurements, vertical error bars are the standard deviation in predicted growth rates estimated from 1000 bootstrap re-samplings (and model fits) of the data (points are mean-centered). b Correlation between the experimentally measured and model-predicted epistasis, as computed from the growth rate data in (a). Again, color coding indicates TYMS background (identical to a). The dashed blue line indicates y = x. Horizontal error bars indicate standard deviation propagated from the experimentally measured growth rates across three replicate measurements (centered at the mean), vertical error bars are the standard deviation in the predicted epistasis values estimated by performing 1000 bootstrap re-samplings (and model fits) of the data (again centered at the mean). c Correlation between experimentally measured and computationally inferred log10(kcat/Km) values for 38 mutants of DHFR. Horizontal error bars describe the standard deviation across triplicate experimental measurements, vertical error bars indicate the standard deviation across 50 iterations of stochastic (Monte-Carlo based) model inference. The circle markers are centered at the mean. d Correlation between experimentally measured and predicted growth rates across the entire deep mutational scanning dataset. The marginal distribution of growth rate effects is shown along each axis. e Correlation between experimentally measured and predicted epistasis across the entire deep mutational scanning dataset. The marginal distribution of epistatic effects is shown along each axis. f Mutational tolerance of DHFR as a function of TYMS background. The heatmap shows the fraction of DHFR mutations with relative growth rates of 0.9 or better as TYMS kcat and Km are discretely varied. Both axes are natural log spaced, TYMS kcat was sampled at 50 points between ln(-2) and ln(2), while TYMS Km was sampled at 50 points between ln(−1) and ln(3). The values for TYMS R166Q, Q33S and WT are marked with red, cyan and black circles respectively. g A zoomed-in version of (f), focusing on the mutational tolerance of DHFR for TYMS backgrounds similar in velocity to WT and Q33S TYMS.
Fig. 6
Fig. 6. DHFR positions clustered by epistatic mutational effect.
a Clusters of DHFR positions organized by predominant epistasis type. In each heat map DHFR positions are ordered along the vertical axis; amino acid residues are organized by physiochemical similarity along the horizontal axis. As in earlier plots, green indicates negative epistasis, and pink indicates positive epistasis. Gray pixels mark mutations with statistically insignificant epistasis. b Structural location of epistatic clusters for DHFR to TYMS Q33S. The DHFR backbone is in gray cartoon (PDBID: 1RX2). Folate, the DHFR substrate is indicated with yellow sticks. The NADP+ cofactor is in green sticks. c Structural location of epistatic clusters for DHFR to TYMS R166Q. Color coding is identical to panel (b).
Fig. 7
Fig. 7. The structural organization of epistasis in DHFR.
a Epistasis of DHFR positions to TYMS Q33S. The DHFR structure is in space-filling spheres (PDBID: 1RX2), NADP co-factor in green sticks, and folate in yellow sticks. A slice through the structure shows the interior arrangement of epistasis. Positions in the negative epistasis cluster are green, positions in the positive epistasis cluster are pink. Gray spheres indicate the insignificant epistasis cluster. b Cumulative distribution of positions in each epistatic cluster by distance to the DHFR active site for the TYMS Q33S background. In this case, active site was defined as the C6 atom of folate. Color coding follows from (a), the black dashed line indicates the distance distribution of all residues in the protein. c Epistasis of individual DHFR positions to TYMS R166Q. Color coding follows from (a) with the addition that positions with strong positive epistasis are magenta. d Cumulative distribution of positions in each epistatic cluster by distance to the DHFR active site in the TYMS R166Q background. In this case, active site was defined as the C6 atom of folate. Color coding follows from (c), the black dashed line indicates the distance distribution of all residues in the protein. e The position-averaged log10 catalytic power (as inferred from the growth rate data) across measured mutations. All residues are indicated in space filling and color coded by the average mutational effect. Blue indicates positions where mutations have a deleterious effect on catalytic power (on average), while white indicates mutations that have little effect on catalytic power. The NADP co-factor is shown in green sticks, and folate in yellow sticks. A slice through the structure shows the interior distribution of mutational effects on catalysis. f Structural overlap between positions associated to catalysis and evolutionary conservation. The DHFR backbone is in gray cartoon, the NADP co-factor in green sticks, and folate in yellow sticks. Positions where mutations have a deleterious effect on catalysis (at least half a standard deviation below the mean) are in blue space filling. Evolutionarily conserved positions (as computed by the Kullback-Leibler relative entropy in a large alignment of DHFR sequences) are in red mesh.

Update of

Similar articles

Cited by

References

    1. Schober AF, et al. A two-enzyme adaptive unit within bacterial folate metabolism. Cell Rep. 2019;27:3359–3370.e7. doi: 10.1016/j.celrep.2019.05.030. - DOI - PMC - PubMed
    1. Kemble, H. E. et al. Flux, toxicity and protein expression costs shape genetic interaction in a metabolic pathway. http://biorxiv.org/lookup/doi/10.1101/362327 (2018) 10.1101/362327. - DOI
    1. Lilja EE, Johnson DR. Metabolite toxicity determines the pace of molecular evolution within microbial populations. BMC Evol. Biol. 2017;17:52. doi: 10.1186/s12862-017-0906-2. - DOI - PMC - PubMed
    1. Noor E, et al. The protein cost of metabolic fluxes: Prediction from enzymatic rate laws and cost minimization. PLOS Comput. Biol. 2016;12:e1005167. doi: 10.1371/journal.pcbi.1005167. - DOI - PMC - PubMed
    1. Dekel E, Alon U. Optimality and evolutionary tuning of the expression level of a protein. Nature. 2005;436:588–592. doi: 10.1038/nature03842. - DOI - PubMed

MeSH terms

Substances