. 2024 Apr 18;15(1):3322.
doi: 10.1038/s41467-024-47435-w.

Local environment in biomolecular condensates modulates enzymatic activity across length scales

Affiliations

Local environment in biomolecular condensates modulates enzymatic activity across length scales

Marcos Gil-Garcia et al. Nat Commun. .

Abstract

The mechanisms that underlie the regulation of enzymatic reactions by biomolecular condensates and how they scale with compartment size remain poorly understood. Here we use intrinsically disordered domains as building blocks to generate programmable enzymatic condensates of NADH-oxidase (NOX) with different sizes spanning from nanometers to microns. These disordered domains, derived from three distinct RNA-binding proteins, each possessing different net charge, result in the formation of condensates characterized by a comparable high local concentration of the enzyme yet within distinct environments. We show that only condensates with the highest recruitment of substrate and cofactor exhibit an increase in enzymatic activity. Notably, we observe an enhancement in enzymatic rate across a wide range of condensate sizes, from nanometers to microns, indicating that emergent properties of condensates can arise within assemblies as small as nanometers. Furthermore, we show a larger rate enhancement in smaller condensates. Our findings demonstrate the ability of condensates to modulate enzymatic reactions by creating distinct effective solvent environments compared to the surrounding solution, with implications for the design of protein-based heterogeneous biocatalysts.


Conflict of interest statement

The authors declare no competing interests.

Figures

Fig. 1
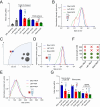
Fig. 1. Condensates based on different LCDs provide different microenvironments for NOX enzymatic activity.
A NOX catalyzes the oxidation of NADH to NAD+ in the presence of oxygen, using FAD as a cofactor. AlphaFold structure of Dbp1-NOX, showing the unstructured Dbp1 LCD (blue color) and the globular NOX enzyme (black color). B LCDs derived from the DEAD-box proteins Dbp1, Laf1, and Ddx4 are fused to the N-terminus of the NOX enzyme, creating chimeric proteins with different net charges, which are represented by the bar. The amino acid sequence of each LCD is shown on the right. Basic residues (Arg and Lys) are highlighted in blue, and acidic residues (Asp and Glu) in red. C Representative phase-contrast microscopy images of solutions of 5 µM Ddx4-NOX (top), Dbp1-NOX (bottom, left), and Laf1-NOX (bottom, right) in 25 mM Tris, 20 mM NaCl, pH 7.5 showing the presence of micron-sized condensates when the enzyme is fused to LCDs. The scale bar represents 5 µm. The protein concentration of 5 µM was selected to facilitate visualization of the condensates under the confocal microscope. Each experiment was repeated three times independently with similar results. D Phase separation is abolished at high salt concentration. Green circles and red cross indicate the presence and absence of phase separation, respectively. E Representative fluorescence confocal microscopy images showing the recruitment of NADH (top, blue fluorescence) and FAD (bottom, green fluorescence) in condensates of Ddx4-NOX (left), Laf1-NOX (middle) and Dbp1-NOX (right). NADH and FAD were added individually in two distinct experiments to avoid interference with the rapid reaction. The scale bar represents 5 µm. Each experiment was repeated three times independently with similar results. F Partitioning (Kp) of substrate (top) and cofactor (bottom) as a function of the net charge of the different fusion proteins. The dot lines represent exponential correlations and are a guide to the eyes only. n = 3 independent experiments. Data were presented as mean values ± SEM.
Fig. 2
Fig. 2. Condensates formed by different chimeric proteins modulate NOX enzymatic activity.
A Representative profile of the reaction progress characterized by a decrease in the NADH absorbance at 340 nm for the homogeneous solution (black symbols, NOX) and the heterogeneous system composed of condensates and the dilute phase (blue symbols, Dbp1-NOX, red symbols, Laf1-NOX and green symbols, Ddx4-NOX). Proteins were diluted to 1 µM in 25 mM Tris, 20 mM NaCl pH 7.5. B Initial rates measured for the NOX homogeneous system (gray bar) and for the heterogeneous systems (“Total (2 phases)”) at 1 µM in 25 mM Tris, 20 mM NaCl pH 7.5. n ≥ 3 independent experiments. Data were presented as mean values ± SEM. C Initial rates of 1 µM protein solutions at high ionic strength (500 mM NaCl), where a single homogeneous phase was observed for all proteins. n ≥ 3 independent experiments. Data were presented as mean values ± SEM. D Mass distribution of 20 nM NOX and Dbp1-NOX solutions at low ionic strength (20 mM NaCl) analyzed by single-molecule mass photometry. Both peaks correspond to the dimeric forms of the protein: 45 kDa for NOX and 79 kDa for Dbp1-NOX. E Initial rates of the homogeneous systems at 20 nM enzyme (c«csat) and low ionic strength (20 mM NaCl). n = 3 independent experiments. Data were presented as mean values ± SEM. Created with BioRender.com.
Fig. 3
Fig. 3. Modulation of enzymatic activity in nanoclusters.
A Initial rates of homogeneous NOX solutions at 280 nM and 1 µM (gray), of heterogeneous systems formed by the different fusion proteins at 1 µM protein concentration (“Total (2 phases)”), and of the dilute phase in equilibrium with the dense phase in the heterogeneous systems (“Dilute phase”). n ≥ 3 independent experiments. Data were presented as mean values ± SEM. B Size distribution of the dilute phase after removing micron-sized condensates by centrifugation measured by dynamic light scattering, showing the presence of nanoclusters. C Schematic phase diagram showing the protein concentration at which nanoclusters were formed (280 nM, red square), and the csat (300 nM, blue circle). The Y-axis represents temperature normalized by the interaction coefficient (χ). D, E Size distribution of 280 nM protein solutions in 25 mM Tris, 20 mM NaCl, pH 7.5 measured by dynamic light scattering (D) and nanoparticle tracking analysis (E), showing the presence of nanoclusters. F Presence and absence of nanoclusters as detected by dynamic light scattering, indicated by green circles and red cross, respectively. The formation of the clusters is abolished at salt concentrations larger than 300 mM. G Initial rates of the solutions at 280 nM in 25 mM Tris at low salt (20 mM NaCl, where nanoclusters are observed, “Nanoclusters c = 280 nM”) and high salt (500 mM NaCl, where the solution is homogeneous, “1 phase c = 280 nM”). The initial rates of the dilute phase in equilibrium with the dense phase in the heterogeneous system reported in panel (A) (“Dilute phase”) are also shown in this panel (G) for comparison. n ≥ 3 independent experiments. Data were presented as mean values ± SEM. Created with BioRender.com.
Fig. 4
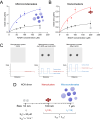
Fig. 4. Increase of NOX enzymatic activity in Dbp1-NOX microcondensates and nanoclusters.
A, B Michaelis–Menten plot of 1 µM (A) and 280 nM (B) NOX (black) and Dbp1-NOX (blue and red) in 25 mM Tris, 20 mM NaCl, pH 7.5. Symbols indicate experimental data and continuous lines in the model simulations. n ≥ 3 independent experiments, except for one data point, which is derived from n = 2, and no error bars are derived. Data were presented as mean values ± SEM. C Schematic illustration of the initial rates in the dilute and dense phase (blue color) and of the overall initial rate of the entire system (red color) for the homogeneous NOX solution and LCD-NOX heterogeneous systems. D Schematic illustration showing the effect of protein condensation on the normalized rates across length scales. The sizes of 10 nm, 100 nm, and 1 µm indicate, respectively, the protein dimer, the nanoclusters, and the micron-sized condensates. Created with BioRender.com.

Similar articles

Cited by

References

    1. Banani SF, Lee HO, Hyman AA, Rosen MK. Biomolecular condensates: organizers of cellular biochemistry. Nat. Rev. Mol. Cell Biol. 2017;18:285–298. doi: 10.1038/nrm.2017.7. - DOI - PMC - PubMed
    1. Shin Y, Brangwynne CP. Liquid phase condensation in cell physiology and disease. Science. 2017;357:1979. doi: 10.1126/science.aaf4382. - DOI - PubMed
    1. Boeynaems S, et al. Protein phase separation: a new phase in cell biology. Trends Cell Biol. 2018;28:420–435. doi: 10.1016/j.tcb.2018.02.004. - DOI - PMC - PubMed
    1. Brangwynne CP, et al. Germline P granules are liquid droplets that localize by controlled dissolution/condensation. Science. 2009;324:1729–1732. doi: 10.1126/science.1172046. - DOI - PubMed
    1. Choi J-M, Holehouse AS, Pappu RV. Physical principles underlying the complex biology of intracellular phase transitions. Annu Rev. Biophys. 2020;49:107–133. doi: 10.1146/annurev-biophys-121219-081629. - DOI - PMC - PubMed