

Speed of environmental change frames relative ecological risk in climate change and climate intervention scenarios
- PMID: 38637548
- PMCID: PMC11026408
- DOI: 10.1038/s41467-024-47656-z
Speed of environmental change frames relative ecological risk in climate change and climate intervention scenarios
Abstract
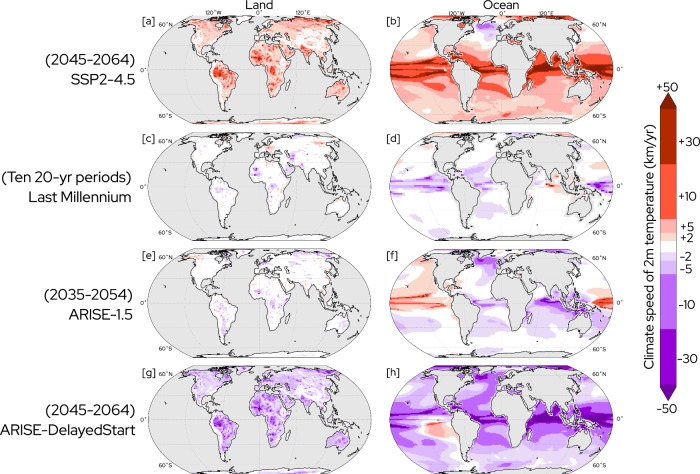
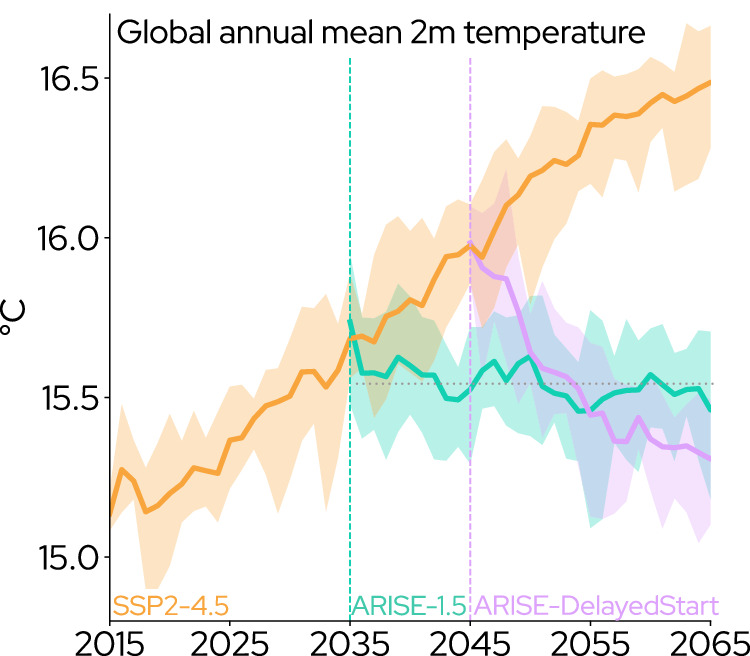
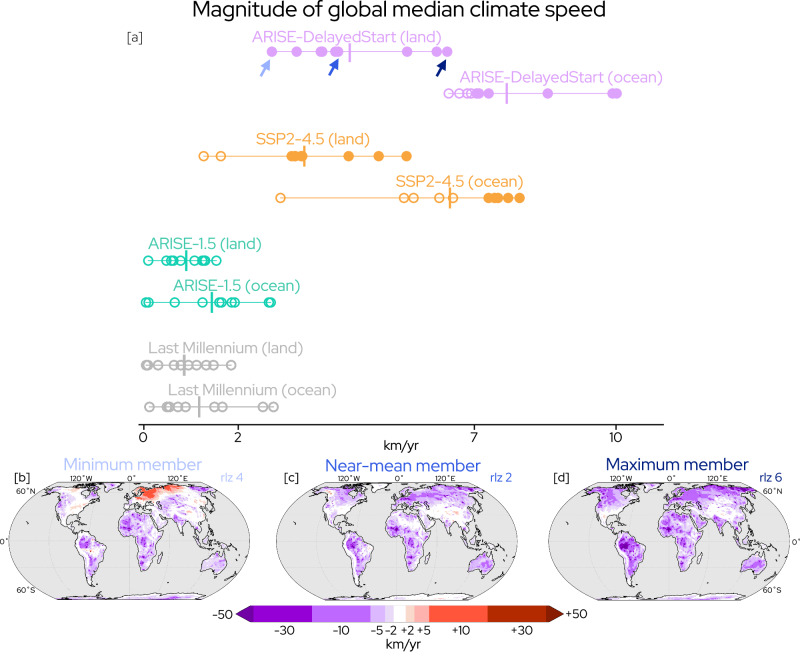
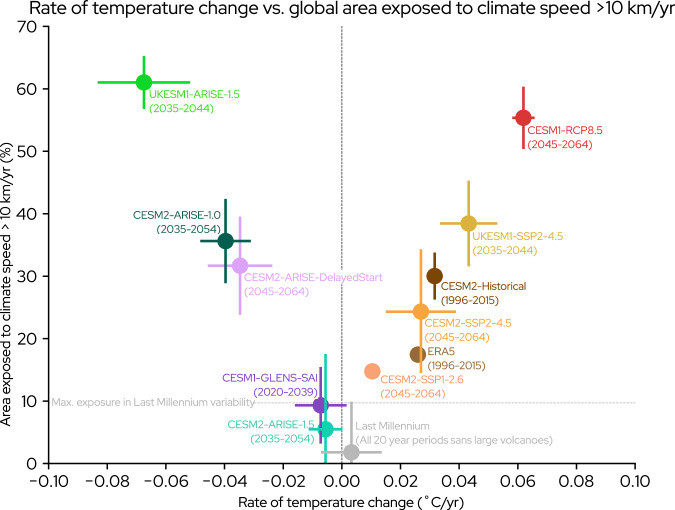
Stratospheric aerosol injection is a potential method of climate intervention to reduce climate risk as decarbonization efforts continue. However, possible ecosystem impacts from the strategic design of hypothetical intervention scenarios are poorly understood. Two recent Earth system model simulations depict policy-relevant stratospheric aerosol injection scenarios with similar global temperature targets, but a 10-year delay in intervention deployment. Here we show this delay leads to distinct ecological risk profiles through climate speeds, which describe the rate of movement of thermal conditions. On a planetary scale, climate speeds in the simulation where the intervention maintains temperature are not statistically distinguishable from preindustrial conditions. In contrast, rapid temperature reduction following delayed deployment produces climate speeds over land beyond either a preindustrial baseline or no-intervention climate change with present policy. The area exposed to threshold climate speeds places different scenarios in context to their relative ecological risks. Our results support discussion of tradeoffs and timescales in future scenario design and decision-making.
© 2024. The Author(s).
Conflict of interest statement
The authors declare no competing interests.
Figures
Similar articles
-
Scenarios for modeling solar radiation modification.Proc Natl Acad Sci U S A. 2022 Aug 16;119(33):e2202230119. doi: 10.1073/pnas.2202230119. Epub 2022 Aug 8. Proc Natl Acad Sci U S A. 2022. PMID: 35939702 Free PMC article.
-
Potential ecological impacts of climate intervention by reflecting sunlight to cool Earth.Proc Natl Acad Sci U S A. 2021 Apr 13;118(15):e1921854118. doi: 10.1073/pnas.1921854118. Proc Natl Acad Sci U S A. 2021. PMID: 33876741 Free PMC article.
-
The Minderoo-Monaco Commission on Plastics and Human Health.Ann Glob Health. 2023 Mar 21;89(1):23. doi: 10.5334/aogh.4056. eCollection 2023. Ann Glob Health. 2023. PMID: 36969097 Free PMC article. Review.
-
Past dynamics and future prediction of the impacts of land use cover change and climate change on landscape ecological risk across the Mongolian plateau.J Environ Manage. 2024 Mar;355:120365. doi: 10.1016/j.jenvman.2024.120365. Epub 2024 Mar 8. J Environ Manage. 2024. PMID: 38460328
-
Ecosystem restoration programs challenges under climate and land use change.Sci Total Environ. 2022 Feb 10;807(Pt 2):150527. doi: 10.1016/j.scitotenv.2021.150527. Epub 2021 Sep 29. Sci Total Environ. 2022. PMID: 34599963 Review.
Cited by
-
Environmental consequences of interacting effects of changes in stratospheric ozone, ultraviolet radiation, and climate: UNEP Environmental Effects Assessment Panel, Update 2024.Photochem Photobiol Sci. 2025 Mar;24(3):357-392. doi: 10.1007/s43630-025-00687-x. Epub 2025 Mar 17. Photochem Photobiol Sci. 2025. PMID: 40095356 Free PMC article.
-
Climate risks, multi-tier medical insurance systems, and health inequality: evidence from China's middle-aged and elderly populations.BMC Health Serv Res. 2025 Apr 1;25(1):481. doi: 10.1186/s12913-025-12648-2. BMC Health Serv Res. 2025. PMID: 40170171 Free PMC article.
References
-
- Parmesan C. Ecological and evolutionary responses to recent climate change. Annu. Rev. Ecol. Evol. Syst. 2006;37:637–669. doi: 10.1146/annurev.ecolsys.37.091305.110100. - DOI
-
- Frieler K, et al. Limiting global warming to 2 ∘C is unlikely to save most coral reefs. Nat. Clim. Chang. 2013;3:165–170. doi: 10.1038/nclimate1674. - DOI
-
- Poloczanska ES, et al. Global imprint of climate change on marine life. Nat. Clim. Chang. 2013;3:919–925. doi: 10.1038/nclimate1958. - DOI
-
- Allen JL, Lendemer JC. Climate change impacts on endemic, high-elevation lichens in a biodiversity hotspot. Biodivers. Conserv. 2016;25:555–568. doi: 10.1007/s10531-016-1071-4. - DOI
LinkOut - more resources
Full Text Sources
