. 2024 Apr 18;15(1):3360.
doi: 10.1038/s41467-024-47698-3.

CD20/MS4A1 is a mammalian olfactory receptor expressed in a subset of olfactory sensory neurons that mediates innate avoidance of predators

Affiliations

CD20/MS4A1 is a mammalian olfactory receptor expressed in a subset of olfactory sensory neurons that mediates innate avoidance of predators

Hao-Ching Jiang et al. Nat Commun. .

Abstract

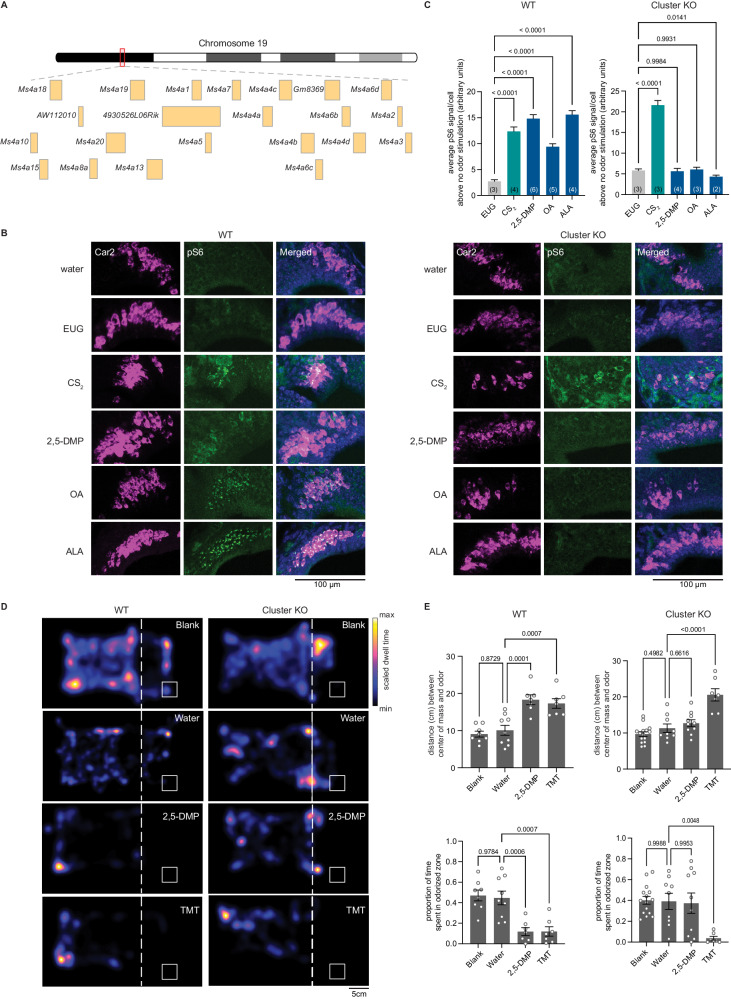
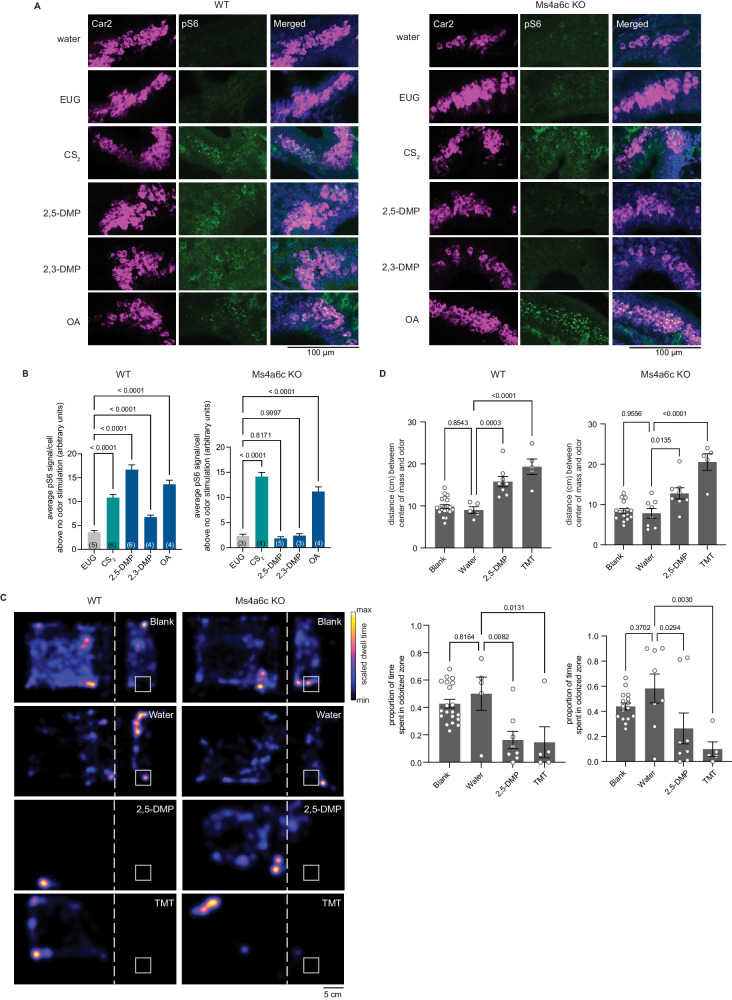
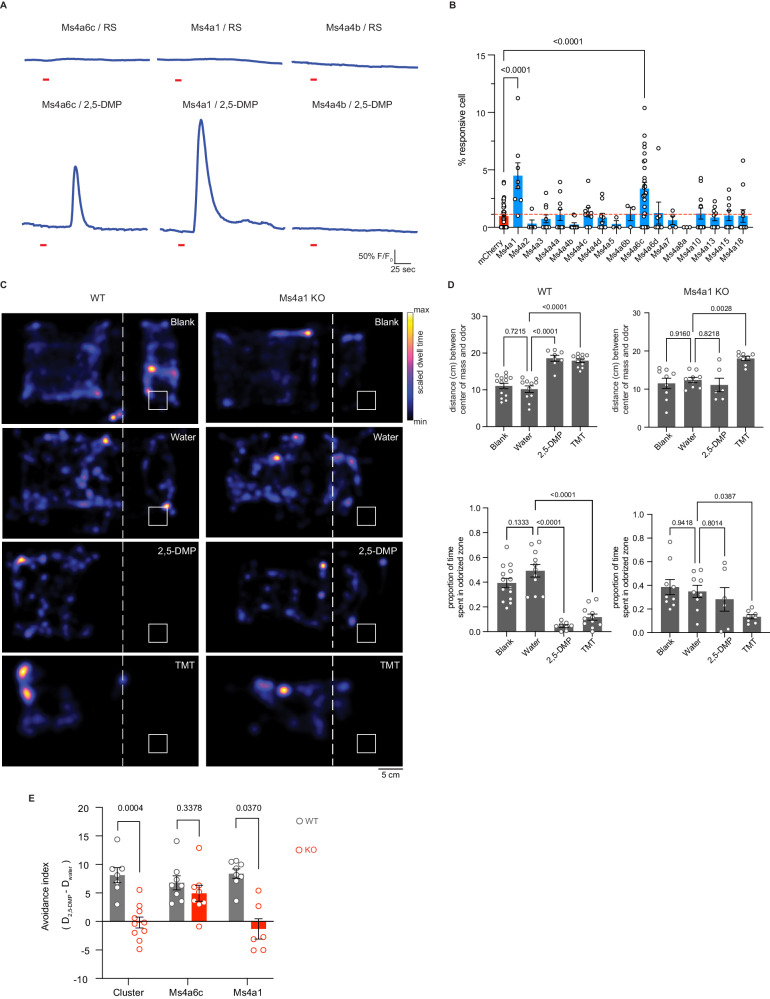
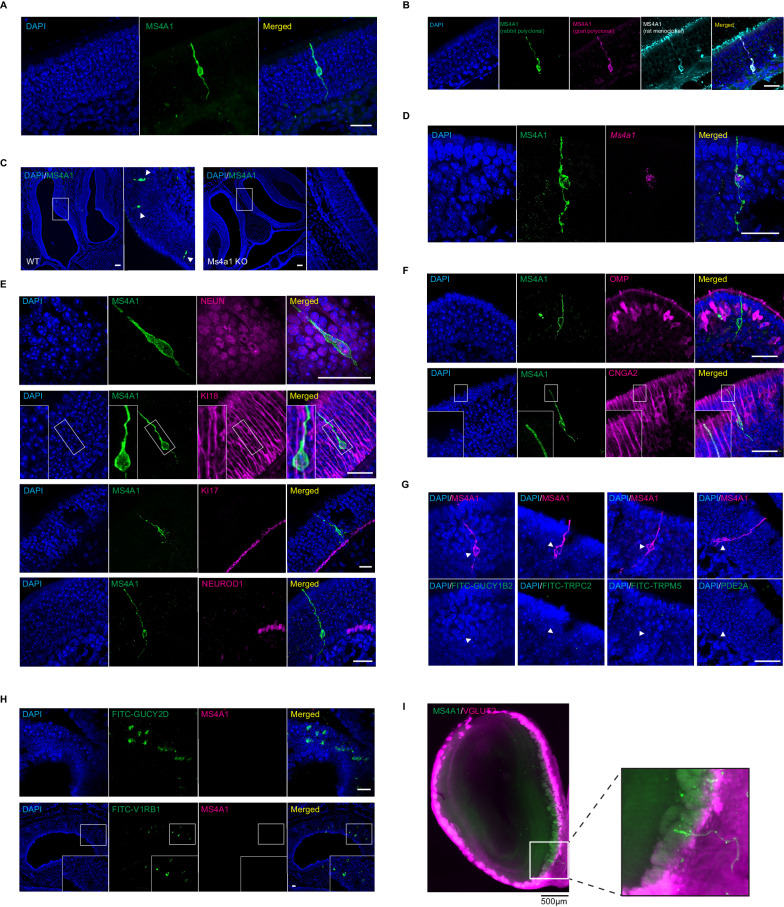
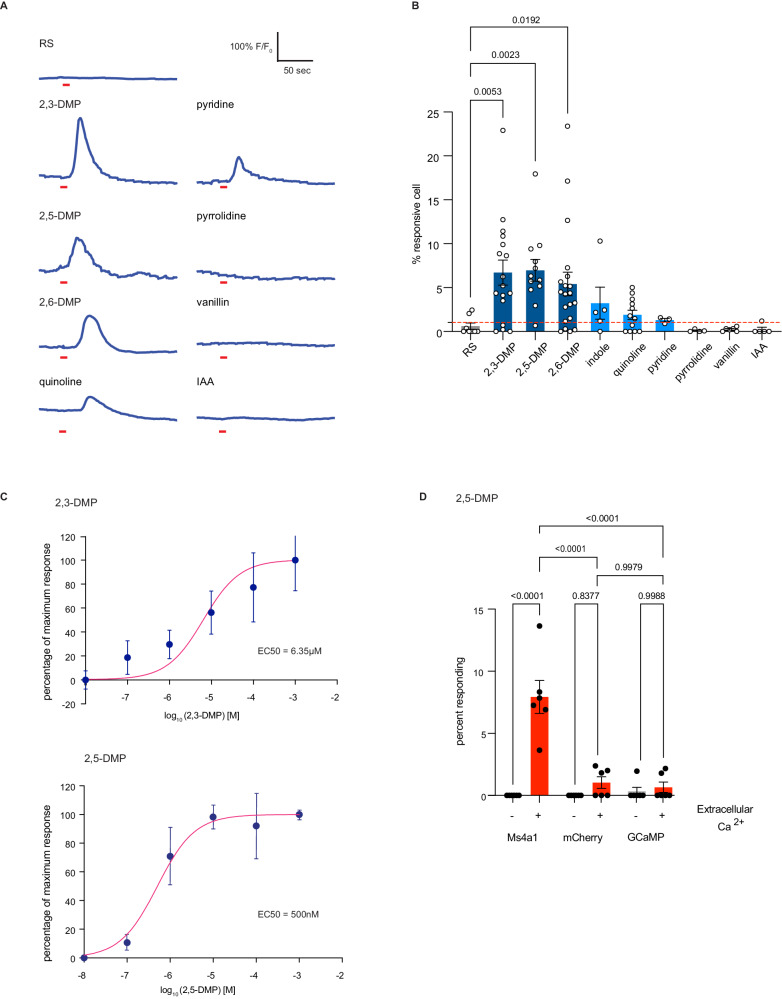
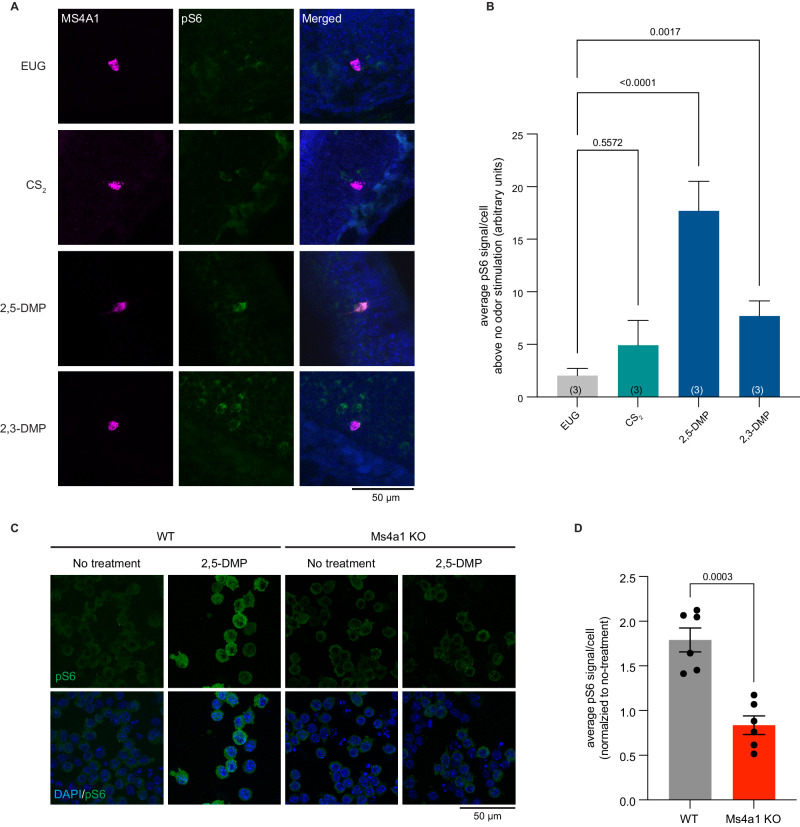
The mammalian olfactory system detects and discriminates between millions of odorants to elicit appropriate behavioral responses. While much has been learned about how olfactory sensory neurons detect odorants and signal their presence, how specific innate, unlearned behaviors are initiated in response to ethologically relevant odors remains poorly understood. Here, we show that the 4-transmembrane protein CD20, also known as MS4A1, is expressed in a previously uncharacterized subpopulation of olfactory sensory neurons in the main olfactory epithelium of the murine nasal cavity and functions as a mammalian olfactory receptor that recognizes compounds produced by mouse predators. While wildtype mice avoid these predator odorants, mice genetically deleted of CD20 do not appropriately respond. Together, this work reveals a CD20-mediated odor-sensing mechanism in the mammalian olfactory system that triggers innate behaviors critical for organismal survival.


Conflict of interest statement

The authors declare no competing interests.

Figures

Fig. 1
Fig. 1. Deletion of all members of the MS4A family prevents in vivo detection of MS4A ligands by necklace OSNs and the innate avoidance behaviors triggered by these ligands.
A Schematic representation of the genomic organization of the entire Ms4a family of genes in a tandem array on chromosome 19. B Example images of the cul-de-sac regions (where necklace cells reside) of the main olfactory epithelia of mice exposed to the indicated odorant, co-labeled for the necklace cell marker Car2 (magenta) and the neuronal activity marker phospho-S6 (pSerine240/244) (green) from wildtype (left panels) or Ms4a cluster knockout animals (right panels). C Quantification of the average pS6 signal/necklace cell above the average pS6 signal/necklace cell when no odor is introduced (water) in wildtype mice (left panel) or Ms4a cluster knockout mice (right panel) when exposed to the indicated odors. Data are presented as mean ± SEM. For wildtype mice (left panel), n = 222 cells over three independent experiments (EUG), n = 305 cells over four independent experiments (CS2), n = 521 cells over six independent experiments (2,5-DMP), n = 609 cells over five independent experiments (OA), n = 476 cells over four independent experiments (ALA); for Ms4a cluster knockout mice (right panel), n = 382 cells over three independent experiments (EUG), n = 482 cells over three independent experiments (CS2), n = 316 cells over four independent experiments (2,5-DMP), n = 362 cells over three independent experiments (OA), n = 325 cells over two independent experiments (ALA). The number of independent experiments (mice) is indicated in brackets, ****p < 0.0001, Dunnett’s test following one-way ANOVA compared to eugenol (EUG) exposure. D Heat maps of the occupancy of wildtype (left panels) or cluster knockout mice (right panels) in the odor avoidance chamber in response to the indicated odorants. Small square represents the location of the odorant, and the dashed line demarcates the odor avoidance zone from the rest of the chamber. Scale bar, 5 cm. E Quantification of odor avoidance behavior. The distance between the average center of mass of the mouse and the location of the odorant (top panels) and the proportion of time spent in the odorized zone (bottom panels) were determined for wildtype mice (left) and Ms4a cluster knockout mice (right). Each circle represents an individual mouse. Data are presented as mean ± SEM. For wildtype mice (left panels), n = 8 mice examined over five independent experiments (Blank), n = 9 mice over five independent experiments (Water), n = 7 mice over four independent experiments (2,5-DMP), n = 7 mice over four independent experiments (TMT); for cluster knockout mice (right panels), n = 15 mice over 11 independent experiments (Blank), n= nine mice over seven independent experiments (Water), n = 10 mice over six independent experiments (2,5-DMP), n = 7 mice over four independent experiments (TMT). **p < 0.01, ***p < 0.001, Dunnett’s test following one-way ANOVA compared to water exposure. Source data are provided as a Source Data file.
Fig. 2
Fig. 2. The knockout of Ms4a6c impairs the ability of necklace OSNs to detect DMP, a predator-derived compound, but does not significantly affect DMP-mediated innate avoidance behavior.
A Example images of the cul-de-sac regions of the main olfactory epithelia of mice exposed to the indicated odorant, co-labeled for the necklace cell marker, Car2 (magenta), and the neuronal activity marker, phospho-S6 (pSerine240/244) (green), from wildtype (left panels) or Ms4a6c knockout animals (right panels). B Quantification of the average pS6 signal/necklace cell above the average pS6 signal/necklace cell when no odor is introduced (water) in wildtype mice (left panel) or Ms4a6c knockout mice (right panel) when exposed to the indicated odors. Data are presented as mean ± SEM. For wildtype mice (left panel), n = 360 cells over five independent experiments (EUG), n = 404 cells over six independent experiments (CS2), n = 459 cells over six independent experiments (2,5-DMP), n = 611 cells over four independent experiments (2,3-DMP), n = 467 cells over four independent experiments (OA); for Ms4a6c knockout mice (right panel), 269 cells over three independent experiments (EUG), n = 351 cells over four independent experiments (CS2), n = 193 cells over five independent experiments (2,5-DMP), n = 281 cells over three independent experiments (2,3-DMP), n = 501 cells over four independent experiments (OA). The number of independent experiments (mice) is indicated in brackets, **p < 0.01, ****p < 0.0001, Dunnett’s test following one-way ANOVA compared to eugenol exposure. C Heat maps of the occupancy of wildtype (left panels) or Ms4a6c knockout mice (right panels) in the odor avoidance chamber in response to the indicated odorants. Small square represents the location of the odorant, and the dashed line demarcates the odor avoidance zone from the rest of the chamber. Scale bar, 5 cm. D Quantification of odor avoidance behavior. The distance between the average center of mass of the mouse and the location of the odorant (top panels) and the proportion of time spent in the odorized zone (bottom panels) were determined for wildtype mice (left) and Ms4a6c knockout mice (right). Each circle represents an individual mouse. Data are presented as mean ± SEM. For wildtype mice (left panels), n = 20 mice over 13 independent experiments (Blank), n = 5 mice over five independent experiments (Water), n = 8 over four independent experiments (2,5-DMP), n = 5 mice over four independent mice (TMT); for Ms4a6c knockout mice (right panels), n = 16 mice over nine independent experiments (Blank), n = 8 mice over four independent experiments (Water), n = 10 mice over five independent experiments (2,5-DMP), n = 5 mice over four independent experiments (TMT). *p < 0.05, **p < 0.01, ***p < 0.001, ****p < 0.0001, Dunnett’s test following one-way ANOVA compared to water exposure. Source data are provided as a Source Data file.
Fig. 3
Fig. 3. MS4A1/CD20 facilitates the detection of DMP, and the deletion of Ms4a1 eliminates innate avoidance of DMP.
A GCaMP6s fluorescence in response to the indicated chemicals in HEK293 cells expressing the indicated MS4A protein (odor delivery indicated by red bars). RS: 1X Ringer’s solution. B Quantification of responses of expressed MS4A protein to 2,5-DMP as in (A). n = 39 wells of cells over 14 independent experiments (mCherry), n = 8 wells of cells over three independent experiments (Ms4a1), n = 5 wells of cells over three independent experiments (Ms4a2), n = 10 wells of cells over three independent experiments (Ms4a3), n = 10 wells of cells over three independent experiments (Ms4a4a), n = 9 wells of cells over three independent experiments (Ms4a4b), n = 9 wells of cells over three independent experiments (Ms4a4c), n = 9 wells of cells over three independent experiments (Ms4a4d), n = 3 wells of cells over two independent experiments (Ms4a5), n = 3 wells of cells over two independent experiments (Ms4a6b), n = 27 wells of cells over 13 independent experiments (Ms4a6c), n = 7 wells of cells over two independent experiments (Ms4a6d), n = 4 wells of cells over two independent experiments (Ms4a7), n = 3 wells of cells over two independent experiments (Ms4a8a), n = 12 wells of cells over four independent experiments (Ms4a10), n = 9 wells of cells over three independent experiments (Ms4a13), n = 9 wells of cells over three independent experiments (Ms4a15), n = 12 wells of cells over four independent experiments (Ms4a18). Dashed red line indicates the mean plus one standard deviation above the responses of HEK293 cells expressing mCherry alone in response to 2,5-DMP. ****p < 0.0001, Dunnett’s test following one-way ANOVA compared to mCherry alone. C Heat maps of the occupancy of wildtype (left panels) or Ms4a1 knockout mice (right panels) in the odor avoidance chamber in response to the indicated odorants. Small square represents the location of the odorant, and the dashed line demarcates the odor avoidance zone from the rest of the chamber. Scale bar, 5 cm. D Quantification of odor avoidance behavior. The distance between the average center of mass of the mouse and the location of odorant (top panels) and the proportion of time spent in the odorized zone (bottom panels) were determined for wildtype mice (left) and Ms4a1 knockout mice (right). Each circle represents an individual mouse. Data are presented as mean ± SEM. For wildtype mice (left panels), n = 14 mice over six independent experiments (Blank), n = 11 mice over six independent experiments (Water), n = 8 mice over four independent experiments (2,5-DMP), n = 11 mice over four independent experiments (TMT); for Ms4a1 knockout mice (right panels), n = 9 mice over three independent experiments (Blank), n = 9 mice over six independent experiments (Water), n = 6 mice over three independent experiments (2,5-DMP), n = 8 mice over three independent experiments (TMT). *p < 0.05, **p < 0.01, ****p < 0.0001, Dunnett’s test following one-way ANOVA compared to water exposure. E An avoidance index was calculated for cluster knockout mice, Ms4a6c knockout mice, Ms4a1 knockout mice, and their wildtype littermate controls by subtracting the average distance in cm between the average position of a mouse from water from the average position of the mouse and 2,5-DMP. A more positive value represents a larger avoidance of DMP. For wildtype mice (gray circles), the avoidance index was calculated for n = 7 mice over four independent experiments (Cluster), n = 8 mice over four independent experiments (Ms4a6c), n = 8 mice over four independent experiments (Ms4a1); for knockout mice (red circles), n = 10 mice over six independent experiments (Cluster), n = 8 mice over three independent experiments (Ms4a6c), n  = 6 mice over three independent experiments (Ms4a1). The data are presented as mean ± SEM. Samples from each group were subjected to bootstrapping. A two-tailed t-test was subsequently performed on these data to compare wildtype and knockout mice. Source data are provided as a Source Data file.
Fig. 4
Fig. 4. MS4A1 is expressed in a previously unidentified subpopulation of OSNs.
A Expression of MS4A1 protein in solitary cells of the main olfactory epithelium. Scale bar, 20 μm. n 10 mice were tested. B Immunostaining was performed with rabbit polyclonal (green), goat polyclonal (magenta)), and rat monoclonal (cyan) anti-MS4A1 antibodies recognizing different epitopes of the protein. Scale bar, 20 μm. n = 3 mice were tested. C Immunostaining of MS4A1 in the main olfactory epithelia of wildtype and Ms4a1 knockout mice. MS4A1-expressing cells are detected in sections obtained from wildtype (indicated by white arrowheads, left panels) but not Ms4a1 knockout (right panels) mice. Scale bar, 80 μm. n = 4 mice were tested for both wild-type and Ms4a1 knockout mice. D Detection of Ms4a1 mRNA expression (magenta) in anti-MS4A1 antibody labeled cells (green) using combined single-molecule fluorescent in situ hybridization and immunohistochemistry. Scale bar, 20 μm. n = 3 mice were tested. E Determination of whether MS4A1-expressing cells co-express NeuN (neuronal marker, top panels), KI18 (sustentacular cell marker, second panels from the top), KI17 (horizontal basal cell marker, third panels from the top), and NeuroD1 (globose basal cell marker, bottom panels). Scale bar, 20 μm. n = 4–6 mice were tested for each marker. F Expression of CNGA2 (lower panels) but not OMP (upper panels) in MS4A1-expressing cells. Scale bar, 20 μm. n = 4–6 mice were tested for each marker. G MS4A1-expressing cells do not express the genes Gucy1b2, Trpc2, Trpm5, and Pde2a, markers of previously described olfactory subsystems. Scale bar, 20 μm. H MS4A1 is undetected in necklace cells, marked by their expression of Gucy2d (upper panels), and vomeronasal olfactory neurons, marked by their expression of V1rb1 (lower panels). Scale bar, 20 μm. n = 4–6 mice were tested for each marker. I iDISCO immunostaining using antibodies that recognize MS4A1 and VGLUT2, an olfactory glomerular marker, reveals that MS4A1-expressing cells coalesce their axons in the olfactory bulb (left panel). Zoomed-in image of the glomerulus where axons from MS4A1-expressing cells terminate (right panel). n = 3 mice were tested for both wildtype and Ms4a1 knockout mice.
Fig. 5
Fig. 5. MS4A1 is a chemoreceptor that detects nitrogenous heterocyclic compounds.
A GCaMP6s fluorescence in response to the indicated chemicals in HEK293 cells expressing MS4A1 protein (odor delivery indicated by red bars). B Quantification of responses of cells expressing MS4A1 protein to the indicated chemicals as in (A). The data are presented as mean ± SEM. n = 8 wells of cells over three independent experiments (RS), n = 17 wells of cells over nine independent experiments (2,3-DMP), n = 12 wells of cells over 11 independent experiments (2,5-DMP), n = 20 wells of cells over ten independent experiments (2,6-DMP), n = 12 wells of cells over six independent experiments (quinoline), n = 5 wells of cells over four independent experiments (indole), n = 3 wells of cells over two independent experiments (pyridine), n = 4 wells of cells over three independent experiments (pyrrolidine), n = 6 wells of cells over three independent experiments (vanillin), n = 5 wells of cells over three independent experiments (IAA). Dashed red line indicates the mean plus one standard deviation of responses of MS4A1-expessing HEK293 in response to RS. *p < 0.05, **p < 0.01, Dunnett’s test following Brown-Forsythe and Welch ANOVA tests compared to control stimulation with Ringer’s solution (RS) alone. C Dose–response curves reveal low micromolar/high nanomolar EC50s for MS4A1/2,3-DMP (top panel) and MS4A1/2,5-DMP (bottom panel). For 2,3-DMP (top panel), each data point represents the mean ± SEM from n = 8 wells of cells over five independent experiments (10−8 M), n = 10 wells of cells over six independent experiments (10−7 M), n = 9 wells of cells over six independent experiments (10−6 M), n = 12 wells of cells over six independent experiments (10−5 M), n = 6 wells of cells over six independent experiments (10−4, 10−3 M); For 2,5-DMP, each data point represents the mean ± SEM from n = 4 wells of cells over four independent experiments (10−8 M), n = 3 wells of cells over three independent experiments (10−7 M), n = 4 wells of cells from four independent experiments (10−6, 10−5, 10−4, 10−3 M). D The requirement of extracellular calcium for MS4A1 ligand responses was assessed by stimulating HEK293 cells co-expressing GCaMP6s and either MS4A1 or mCherry or GCaMP6s alone with 2,5-DMP in the presence or absence of extracellular calcium. Data are presented as mean ± SEM from n = 6 wells of cells over three independent experiments (for each indicated condition). ****p < 0.0001, Tuckey’s test following one-way ANOVA compared to no extracellular calcium. Source data are provided as a Source Data file.
Fig. 6
Fig. 6. The MS4A1 ligands, 2,3-DMP and 2,5-DMP, activate MS4A1-expressing cells in vivo.
A Example image of the main olfactory epithelia of mice exposed to the indicated odorant, immunostained for the neuronal activity marker, phospho-S6 (pSerine244/247) (green). Ms4a1 is detected by fluorescent in situ hybridization (magenta), see experimental procedures. B Quantification of the average pS6 signal/MS4A1-expressing cell above the average pS6 signal/ MS4A1-expressing when no odor is introduced (water) in wild-type mice when exposed to the indicated odors. Data are presented as mean ± SEM. n = 34 cells over three independent experiments (EUG), n = 50 cells over three independent experiments (CS2), n = 77 cells over three independent experiments (2,5-DMP), n = 66 cells over three independent experiments (2,3-DMP). The number of independent experiments (mice) is indicated in brackets, **p < 0.01, ****p < 0.0001, Dunnett’s test following Brown–Forsythe and Welch ANOVA tests compared to eugenol exposure. C Example images of 2,5-DMP stimulated wildtype (left panels) or Ms4a1 knockout (right panels) A20 cells, a BALB/c mouse B cell lymphoma cell line, immunostained for the activity marker phospho-S6 (pSerine240/244) (green). D Quantification of the normalized pS6 signal in response to 2,5-DMP in wildtype and Ms4a1 knockout A20 cells. Data are presented as mean ± SEM from six independent experiments. **p < 0.01, two-tailed t-test with Welch’s correction. Source data are provided as a Source Data file.

Update of

Similar articles

Cited by

References

    1. Brennan PA, Zufall F. Pheromonal communication in vertebrates. Nature. 2006;444:308–315. doi: 10.1038/nature05404. - DOI - PubMed
    1. Perez-Gomez A, et al. Innate predator odor aversion driven by parallel olfactory subsystems that converge in the ventromedial hypothalamus. Curr. Biol. 2015;25:1340–1346. doi: 10.1016/j.cub.2015.03.026. - DOI - PMC - PubMed
    1. Buck L, Axel R. A novel multigene family may encode odorant receptors: a molecular basis for odor recognition. Cell. 1991;65:175–187. doi: 10.1016/0092-8674(91)90418-X. - DOI - PubMed
    1. Leinwand SG, Chalasani SH. Olfactory networks: from sensation to perception. Curr. Opin. Genet. Dev. 2011;21:806–811. doi: 10.1016/j.gde.2011.07.006. - DOI - PubMed
    1. Su CY, Menuz K, Carlson JR. Olfactory perception: receptors, cells, and circuits. Cell. 2009;139:45–59. doi: 10.1016/j.cell.2009.09.015. - DOI - PMC - PubMed