. 2024 May;56(5):861-868.
doi: 10.1038/s41588-024-01710-0. Epub 2024 Apr 18.

Genetic modifiers of rare variants in monogenic developmental disorder loci

Affiliations

Genetic modifiers of rare variants in monogenic developmental disorder loci

Rebecca Kingdom et al. Nat Genet. 2024 May.

Abstract

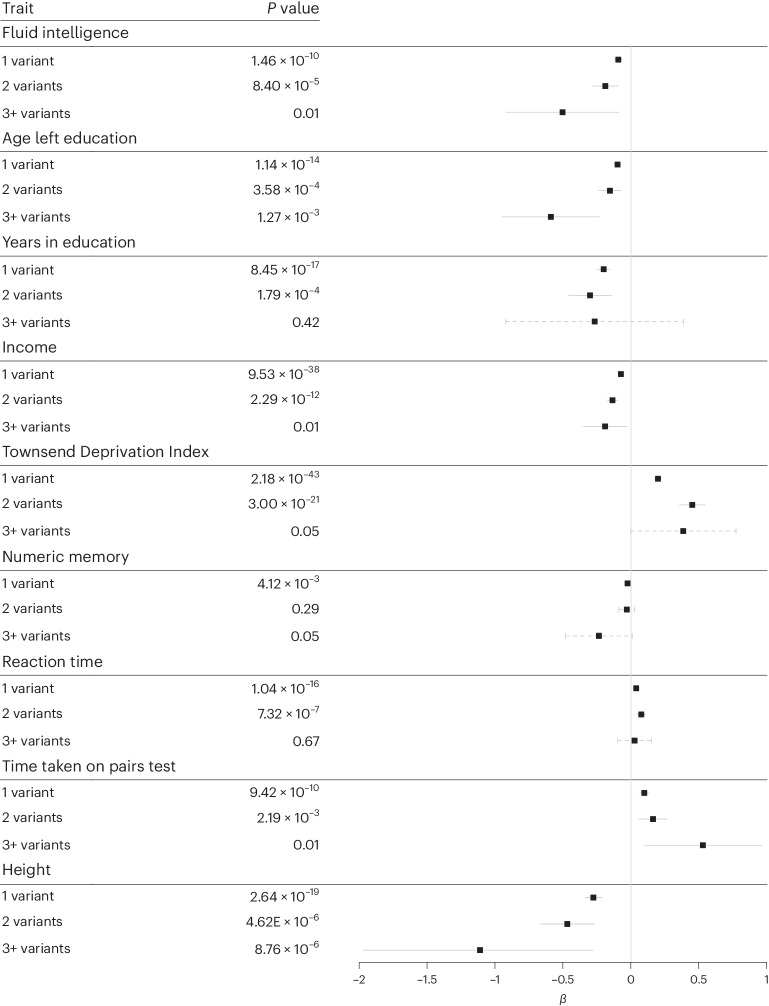
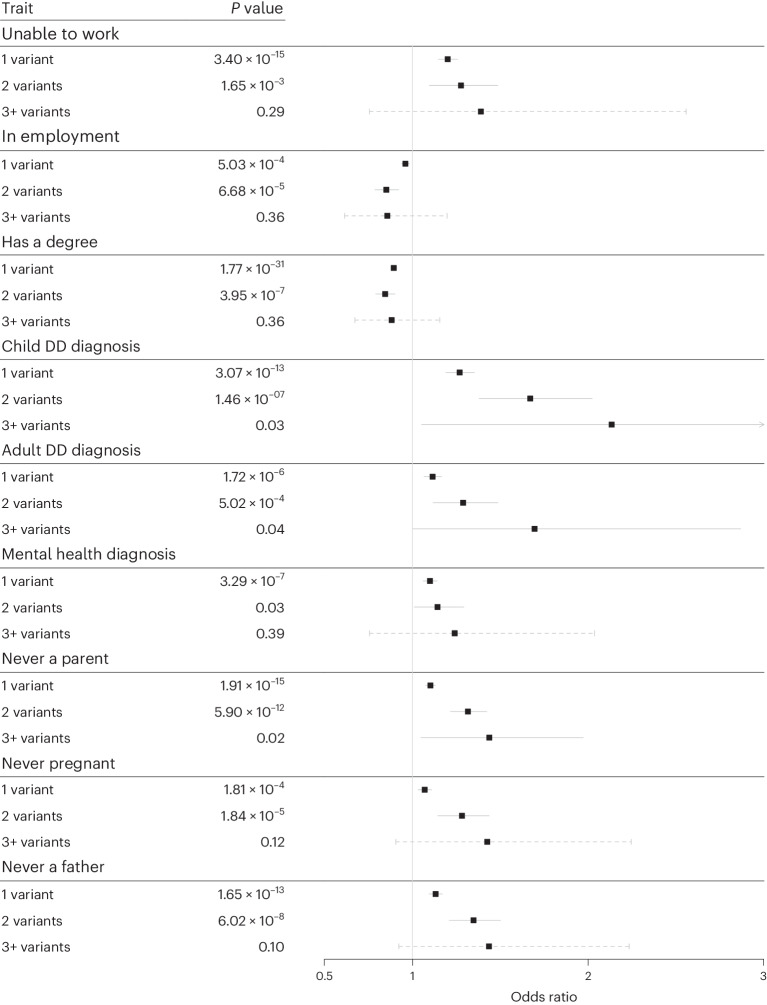
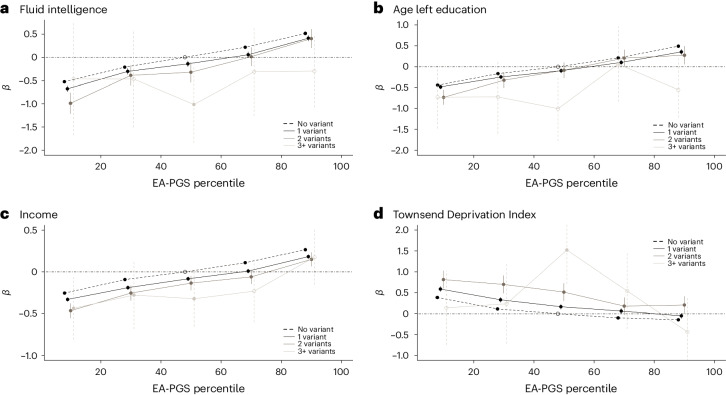
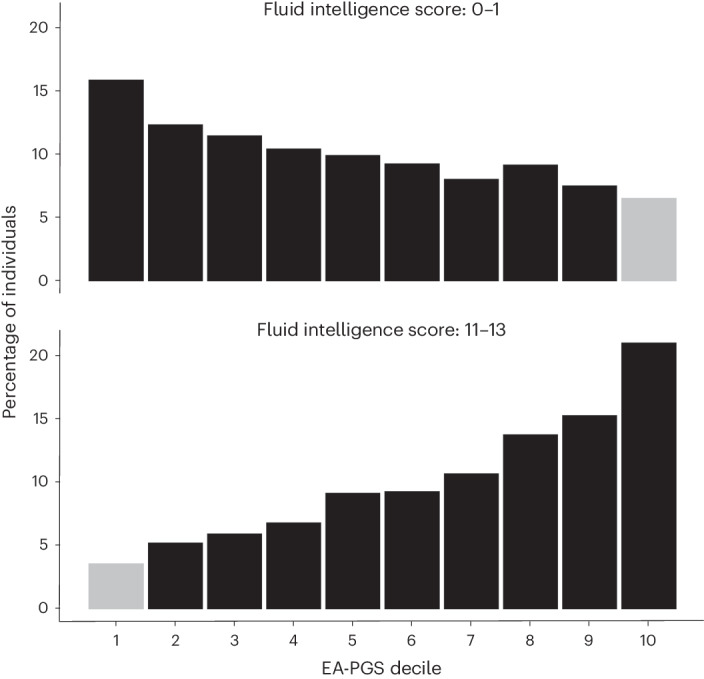
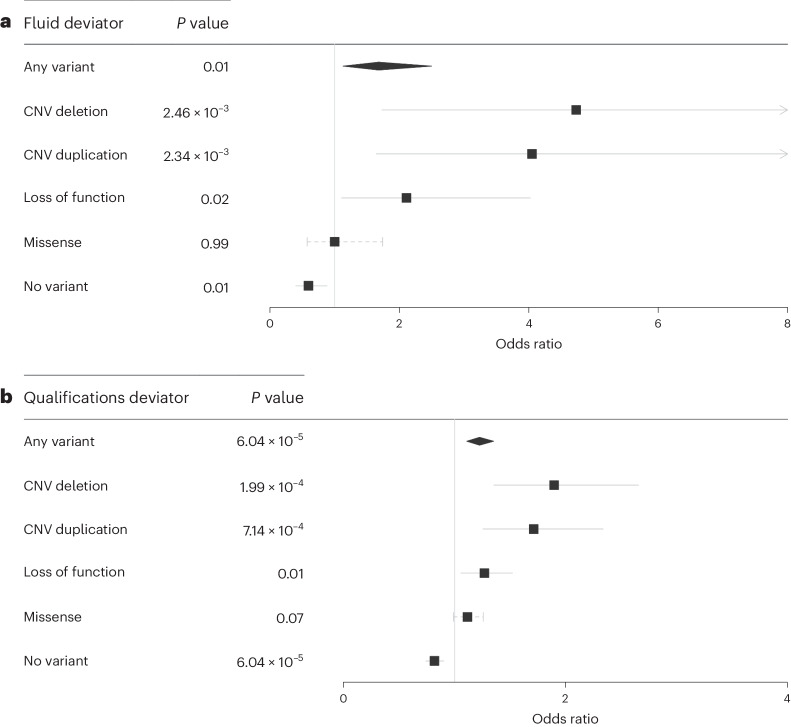
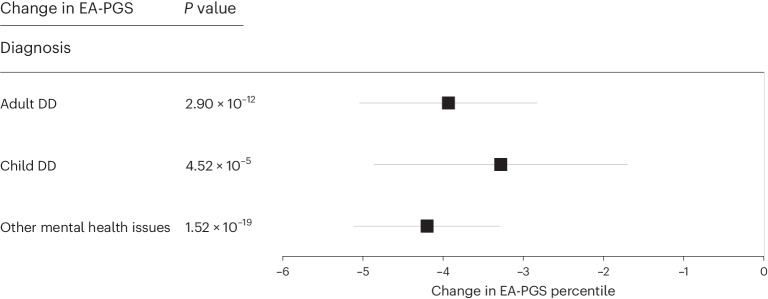
Rare damaging variants in a large number of genes are known to cause monogenic developmental disorders (DDs) and have also been shown to cause milder subclinical phenotypes in population cohorts. Here, we show that carrying multiple (2-5) rare damaging variants across 599 dominant DD genes has an additive adverse effect on numerous cognitive and socioeconomic traits in UK Biobank, which can be partially counterbalanced by a higher educational attainment polygenic score (EA-PGS). Phenotypic deviators from expected EA-PGS could be partly explained by the enrichment or depletion of rare DD variants. Among carriers of rare DD variants, those with a DD-related clinical diagnosis had a substantially lower EA-PGS and more severe phenotype than those without a clinical diagnosis. Our results suggest that the overall burden of both rare and common variants can modify the expressivity of a phenotype, which may then influence whether an individual reaches the threshold for clinical disease.


Conflict of interest statement

The authors declare no competing interests.

Figures

Fig. 1
Fig. 1. Effect of rare DD variant burden on continuous DD-related phenotypes in UKB.
Linear regression of continuous traits in individuals carrying 1, 2 or 3+ rare pLoF, deleterious missense or multigenic variants overlapping dominant DDG2P genes, compared to the rest of UKB (that is, noncarriers). β values for continuous traits were measured as follows: fluid intelligence, standardized units (ranging from 1–13); age left education and years in education, years; height, cm; reaction time, time taken on pairs test, numeric memory, income, and TDI, standard deviations from the mean. Data are presented as mean values ±95% CI, where solid lines indicate that the P value reached Bonferroni-corrected significance and dashed lines indicate that it did not. P values were not corrected for multiple testing.
Fig. 2
Fig. 2. Effect of rare DD variant burden on binary DD-related phenotypes in UKB.
Logistic regression of binary traits/diagnoses in individuals carrying 1, 2 or 3+ rare pLoF, deleterious missense or multigenic variants overlapping dominant DDG2P genes compared to the rest of UKB (that is, noncarriers). Data are presented as mean values ± 95% CI, where the solid lines indicate that the P value reached Bonferroni-corrected significance and the dashed lines indicate that it did not. P values were not corrected for multiple testing.
Fig. 3
Fig. 3. Additive effect of rare DD variant burden and EA-PGS on DD-related phenotypes.
ad, Linear regressions of fluid intelligence (a), age left education (b), income (c) and TDI (d) versus the EA-PGS quintile in UKB. The black dashed horizontal line corresponds to noncarriers of rare DD variants (n = 365,409); dark/medium/light horizontal lines correspond to carriers of 1, 2 or 3+ rare DD variants (n = 50,395, 3,831 and 219), respectively. Notably, within UKB, a sufficiently high EA-PGS can compensate for the effect of a primary variant and, in most cases, any additional rare DD variants on these traits. Data are presented as mean values ± 95% CI (vertical lines), where solid vertical lines indicate that the P value reached Bonferroni-corrected significance and dashed vertical lines indicate that it did not. P values were not corrected for multiple testing.
Fig. 4
Fig. 4. Distribution of EA-PGS and fluid intelligence within UKB.
Phenotypic deviators are highlighted and defined as either individuals in a top EA-PGS decile with a low fluid intelligence score (0 or 1) or those in a bottom EA-PGS decile with a high fluid intelligence score (11, 12 or 13). All individuals (n = 419,854) were included.
Fig. 5
Fig. 5. Rare DD variant carrier status of phenotypic deviators from EA-PGS predictions.
a,b, Logistic regression showing that individuals in UKB who either had an EA-PGS in the top decile but scored low on the fluid intelligence test (n = 137) (a) or reported having no qualifications recorded despite having an EA-PGS in the top decile (n = 4,292) (b) were more likely to be rare DD variant carriers. The comparator group included those within the same EA-PGS decile but with a higher fluid intelligence score or recorded qualifications. Data are presented as mean values ± 95% CI, where solid lines indicate that the P value reached Bonferroni-corrected significance and the dashed lines indicate that it did not. P values were not corrected for multiple testing.
Fig. 6
Fig. 6. Average change in EA-PGS among rare DD variant carriers with a relevant clinical diagnosis.
Linear regressions among individuals carrying one or more rare DD variants, including those who were clinically diagnosed with child DDs (n = 7,933), adult neuropsychiatric conditions (n = 19,004) or other mental health issues (n = 32,911), with EA-PGS, showing that those with a clinical diagnosis have a substantially lower EA-PGS than those who do not have a related clinical diagnosis recorded in UKB. Data are presented as mean values ± 95% CI, where solid lines indicate that the P value reached Bonferroni-corrected significance and dashed lines indicate that it did not. P values were not corrected for multiple testing.

References

    1. Kingdom R, Wright CF. Incomplete penetrance and variable expressivity: from clinical studies to population cohorts. Front. Genet. 2022;13:920390. doi: 10.3389/fgene.2022.920390. - DOI - PMC - PubMed
    1. Wright CF, et al. Assessing the pathogenicity, penetrance, and expressivity of putative disease-causing variants in a population setting. Am. J. Hum. Genet. 2019;104:275–286. doi: 10.1016/j.ajhg.2018.12.015. - DOI - PMC - PubMed
    1. Tarailo-Graovac M, Zhu JYA, Matthews A, van Karnebeek CDM, Wasserman WW. Assessment of the ExAC data set for the presence of individuals with pathogenic genotypes implicated in severe Mendelian pediatric disorders. Genet. Med. 2017;19:1300–1308. doi: 10.1038/gim.2017.50. - DOI - PMC - PubMed
    1. Cable J, et al. Harnessing rare variants in neuropsychiatric and neurodevelopment disorders—a Keystone Symposia report. Ann. N. Y. Acad. Sci. 2021;1506:5–17. doi: 10.1111/nyas.14658. - DOI - PMC - PubMed
    1. Niemi MEK, et al. Common genetic variants contribute to risk of rare severe neurodevelopmental disorders. Nature. 2018;562:268–271. doi: 10.1038/s41586-018-0566-4. - DOI - PMC - PubMed