Clinical Trial
. 2024 Jun;38(6):1378-1389.
doi: 10.1038/s41375-024-02253-3. Epub 2024 Apr 18.

Dynamics of clonal hematopoiesis under DNA-damaging treatment in patients with ovarian cancer

Affiliations
Clinical Trial

Dynamics of clonal hematopoiesis under DNA-damaging treatment in patients with ovarian cancer

Christopher Maximilian Arends et al. Leukemia. 2024 Jun.

Erratum in

Abstract

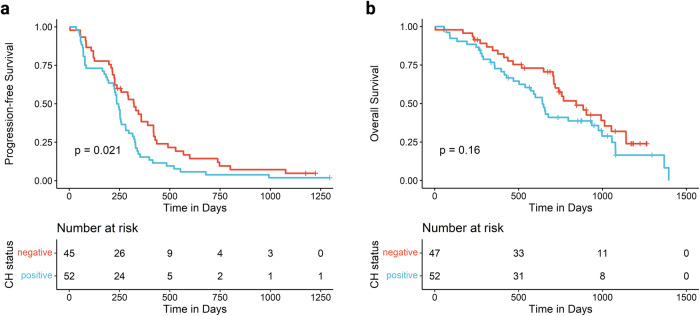
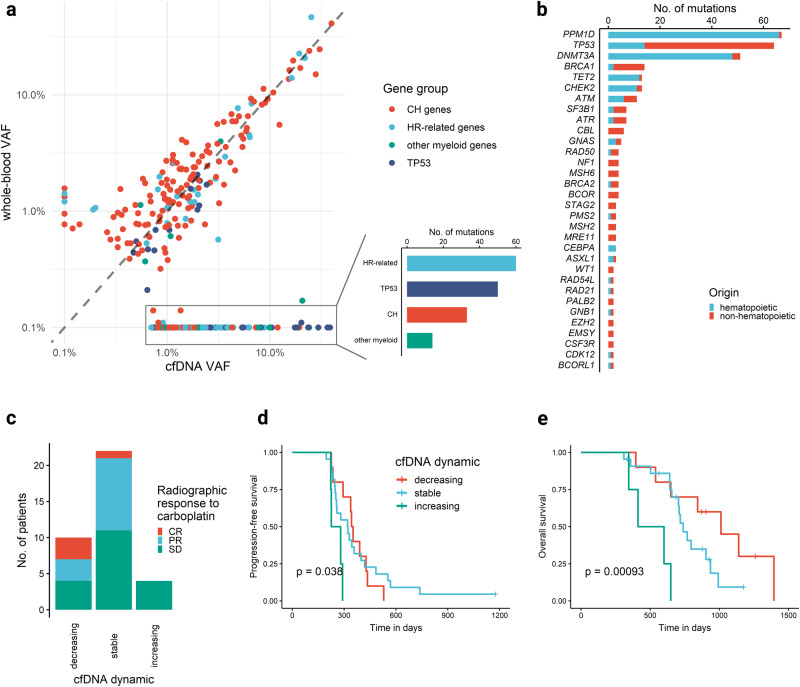
Clonal hematopoiesis (CH) driven by mutations in the DNA damage response (DDR) pathway is frequent in patients with cancer and is associated with a higher risk of therapy-related myeloid neoplasms (t-MNs). Here, we analyzed 423 serial whole blood and plasma samples from 103 patients with relapsed high-grade ovarian cancer receiving carboplatin, poly(ADP-ribose) polymerase inhibitor (PARPi) and heat shock protein 90 inhibitor (HSP90i) treatment within the phase II EUDARIO trial using error-corrected sequencing of 72 genes. DDR-driven CH was detected in 35% of patients and was associated with longer duration of prior PARPi treatment. TP53- and PPM1D-mutated clones exhibited substantially higher clonal expansion rates than DNMT3A- or TET2-mutated clones during treatment. Expansion of DDR clones correlated with HSP90i exposure across the three study arms and was partially abrogated by the presence of germline mutations related to homologous recombination deficiency. Single-cell DNA sequencing of selected samples revealed clonal exclusivity of DDR mutations, and identified DDR-mutated clones as the origin of t-MN in two investigated cases. Together, these results provide unique insights into the architecture and the preferential selection of DDR-mutated hematopoietic clones under intense DNA-damaging treatment. Specifically, PARPi and HSP90i therapies pose an independent risk for the expansion of DDR-CH in a dose-dependent manner.


Conflict of interest statement

FD reports personal fees from AbbVie, Amgen, Astra Zeneca, Gilead, Incyte, Novartis, and Roche outside the submitted work. LB reports advisory role for Abbvie, Amgen, Astellas, Bristol-Myers Squibb, Celgene, Daiichi Sankyo, Gilead, Hexal, Janssen, Jazz Pharmaceuticals, Menarini, Novartis, Pfizer, Sanofi, Servier; as well as research funding from Bayer, Jazz Pharmaceuticals. IR reports honoraria (personal) from Agenus, Blueprint, BMS, PharmaMar, Genmab, Pfizer, AstraZeneca, Roche, GSK, MSD, Deciphera, Mersena, Merck Sereno, Novartis, Amgen, Macrogenics, Tesaro and Clovis; honoraria (institutional) from GSK, MSD, Roche and BMS; advisory/consulting fees from Abbvie, Agenus, Advaxis, BMS, ESAÏ, Daichi, PharmaMar, Genmab, Pfizer, AstraZeneca, Roche/Genentech, GSK, MSD, Deciphera, Mersana, Merck Sereno, Novartis, Amgen, Tesaro and Clovis; research grant/funding (personal) from MSD, Roche and BMS; research grant/funding (institutional) from MSD, Roche, BMS, Novartis, Astra Zeneca and Merck Sereno; travel support from Roche, MSD, AstraZeneca and GSK. IV reports consulting fees from Agenus, AstraZeneca, Bristol Myers Squibb, Eisai, Genmab, GSK, Immunogen, Karyopharm, Mersana, MSD, Molecular Partners, Novocure, Novartis, Oncoinvent, Regeneron, Seagen, Verastem Oncology, Zai Lab, Zentalis. AGZ reports personal honoraria/travel supports from AbbVie, Amgen, Astra Zeneca, Eisai, Gilead, GSK, MSD, PharmaMar, Roche, Roche-Diagnostics Austria, Sandoz, outside the submitted work. WDS reports personal fees from AstraZeneca, GlaxoSmithKline, NOGGO and Roche outside the submitted work. All other authors declare no competing interests.

Figures

Fig. 1
Fig. 1. Detection of clonal hematopoiesis in whole blood DNA.
Somatic mutation analysis on whole blood DNA from 103 patients enrolled in the EUDARIO study. Targeted sequencing of 72 genes listed in Supplementary Table S2. a Gene-specific prevalence of somatic mutations colored by gene class. b Number of patients with single and multiple mutations. c Age-related prevalence of CH mutations. d Stacked bar plot showing the clone size of the largest clone in relation to the number of prior treatment lines (left) and prior PARPi treatment (right). e Stacked bar plot showing the number of mutations per patient in relation to the number of prior treatment lines (left) and prior PARPi treatment (right). f) Analysis of mutation co-occurrence in patients with multiple mutations. The size of each square denotes the number of co-occurrences. Color depicts the fraction of cases in which gene 1 (y-axis) has a higher VAF than gene 2 (x-axis).
Fig. 2
Fig. 2. Survival analysis of the 103 patients enrolled in the EUDARIO study.
a Kaplan-Meier analysis of progression-free survival stratified by CH status. b Kaplan-Meier analysis of overall survival stratified by CH status.
Fig. 3
Fig. 3. Detection of clonal hematopoiesis in cell-free DNA.
Mutational landscape of 340 somatic mutations detected in cfDNA of 102 patients from the EUDARIO study. a VAFs of somatic mutations detected in cfDNA and/or WB DNA at initiation of study treatment. VAFs of mutations detected in only one DNA source were set to the detection limit of 0.1% in the other for the purpose of visualization on a logarithmic scale. Color depicts different mutated gene groups. TP53 mutations are shown as a separate group due to their abundance. b Prevalence of somatic mutations detected in cfDNA by mutated genes. Color depicts hematopoietic vs non-hematopoietic origin depending on the VAF ratio between WB and cfDNA. c Radiographic response to carboplatin treatment in 36 HGOC patients stratified by the VAF dynamics of TP53 mutations of non-hematopoietic origin in cfDNA during carboplatin treatment. d Progression-free survival stratified by the TP53 VAF dynamics. e Overall survival stratified by TP53 VAF dynamics.
Fig. 4
Fig. 4. Clonal dynamics under DNA-damaging therapy.
Clonal fitness measured in paired WB samples taken at the beginning and end of study treatment for each patient (n = 61 patients). a Relative VAF changes over time between initiation and end of treatment. Color denotes the category of clonal fitness, defined as increasing if clonal fitness s > 0.25/year, decreasing if s < −0.25/year and stable otherwise. b Schematic model for the evolution of clone size as a sigmoid function over time over the whole treatment course (no differentiation between chemotherapy and maintenance phase). c Violin plot of clonal fitness per gene for the 5 most frequently mutated genes. DTA genes are colored in blue, DDR genes in red. d Number of increasing/decreasing clones passing the 1% VAF threshold colored by mutated gene/gene group. e Median clonal fitness of TP53- and PPM1D- mutated clones in patients with and without germline HRD mutations. f Median clonal fitness of DNMT3A/TET2- and TP53/PPM1D-mutated clones in different treatment arms with increasing exposure to HSP90 inhibition (arm A – no HSP90i, arm B – HSP90i during carboplatin treatment, arm C – HSP90i during carboplatin and PARPi treatment. g Median clonal fitness of DNMT3A/TET2- and TP53/PPM1D-mutated clones in patients with and without germline HRD mutations. Asterisks denote level of statistical significance: * < 0.05, ** < 0.01, *** < 0.001, **** < 0.0001.
Fig. 5
Fig. 5. Comparison of clonal fitness under carboplatin and PARPi therapy.
a Schematic model of evolution of clone size (estimated from cfDNA VAF) as a sigmoid function over time for carboplatin and PARPi maintenance treatment separately. b Comparison of individual clonal fitness estimates between carboplatin (C) and PARPi maintenance (P) for the 5 most frequently mutated genes. c Scatterplot showing median fitness estimates for the 5 most frequently mutated genes during chemotherapy (x-axis) and PARPi maintenance (y-axis). Error bars denote the interquartile range. Point size reflects the number of clones with mutations in the respective gene. Asterisks denote level of statistical significance: * < 0.05, ** < 0.01, *** < 0.001, **** < 0.0001.
Fig. 6
Fig. 6. Clonal architecture of therapy-related CH mutations in selected cases at single-cell resolution.
Single cell sequencing analysis of 7/37 prospectively collected patient samples with multiple CH mutations (pseudonymized SC1 – SC37). Heatmaps visualize the clonal architecture with somatic mutations identified from bulk sequencing on the y-axis and inferred clones (labeled C1, C2, C3, …) on the x-axis (C0 represents the collection of all cells not carrying any of the listed mutations). Bar charts depict the abundance of their corresponding mutant clones as derived from single-cell sequencing data, n denotes the number of cells genotyped. Mutations are heterozygous if not stated otherwise. ae Cases with multiple CH mutations. f Progression to t-AML at single-cell resolution in case 1. At the time of first sampling this patient was 66 years and on olaparib maintenance treatment for her first relapse of metastatic OC at the time of sampling. She had received carboplatin/paclitaxel/bevacizumab at first diagnosis and carboplatin/pegylated liposomal doxorubicin at relapse. Five months after blood sampling she was started on aromatase inhibitor treatment for her second relapse. She developed progressive pancytopenia and was diagnosed with therapy-related myeloid dysplastic syndrome 6 months after blood sampling, which rapidly progressed to AML. The AML was refractory to induction with CPX351 (sample SC5-AMLD) and was then treated with venetoclax/5-azacitidine for 6 cycles until progression (sample SC5-AMLR). g Progression to t-AML at single-cell resolution in case 2. This patient was a 52-year-old woman who at the time of first sampling (SC-3) was on olaparib maintenance treatment for her first relapse of OC. Treatment at initial diagnosis was carboplatin and bevacizumab. At first relapse she received re-induction with carboplatin/pegylated liposomal doxorubicin resulting in a CR, followed by olaparib maintenance for 4.5 years. She developed persistent cytopenia and was diagnosed with t-AML (SC3-AML) 5 months after first sampling. After 4 cycles of venetoclax/5-azacitidine, she achieved CR and proceeded to allogeneic stem cell transplantation from an HLA-identical unrelated donor.

References

    1. Genovese G, Kahler AK, Handsaker RE, Lindberg J, Rose SA, Bakhoum SF, et al. Clonal hematopoiesis and blood-cancer risk inferred from blood DNA sequence. N Engl J Med. 2014;371:2477–87. doi: 10.1056/NEJMoa1409405. - DOI - PMC - PubMed
    1. Jaiswal S, Fontanillas P, Flannick J, Manning A, Grauman PV, Mar BG, et al. Age-related clonal hematopoiesis associated with adverse outcomes. N Engl J Med. 2014;371:2488–98. doi: 10.1056/NEJMoa1408617. - DOI - PMC - PubMed
    1. Xie M, Lu C, Wang J, McLellan MD, Johnson KJ, Wendl MC, et al. Age-related mutations associated with clonal hematopoietic expansion and malignancies. Nat Med. 2014;20:1472–8. doi: 10.1038/nm.3733. - DOI - PMC - PubMed
    1. Zink F, Stacey SN, Norddahl GL, Frigge ML, Magnusson OT, Jonsdottir I, et al. Clonal hematopoiesis, with and without candidate driver mutations, is common in the elderly. Blood. 2017;130:742–52. doi: 10.1182/blood-2017-02-769869. - DOI - PMC - PubMed
    1. Fuster JJ, MacLauchlan S, Zuriaga MA, Polackal MN, Ostriker AC, Chakraborty R, et al. Clonal hematopoiesis associated with TET2 deficiency accelerates atherosclerosis development in mice. Science. 2017;355:842–7. doi: 10.1126/science.aag1381. - DOI - PMC - PubMed

Publication types

MeSH terms