. 2024 Apr 18;24(1):141.
doi: 10.1186/s12935-024-03328-y.

Sparassis latifolia and exercise training as complementary medicine mitigated the 5-fluorouracil potent side effects in mice with colorectal cancer: bioinformatics approaches, novel monitoring pathological metrics, screening signatures, and innovative management tactic

Affiliations

Sparassis latifolia and exercise training as complementary medicine mitigated the 5-fluorouracil potent side effects in mice with colorectal cancer: bioinformatics approaches, novel monitoring pathological metrics, screening signatures, and innovative management tactic

Navid Abedpoor et al. Cancer Cell Int. .

Abstract

Background: Prompt identification and assessment of the disease are essential for reducing the death rate associated with colorectal cancer (COL). Identifying specific causal or sensitive components, such as coding RNA (cRNA) and non-coding RNAs (ncRNAs), may greatly aid in the early detection of colorectal cancer.

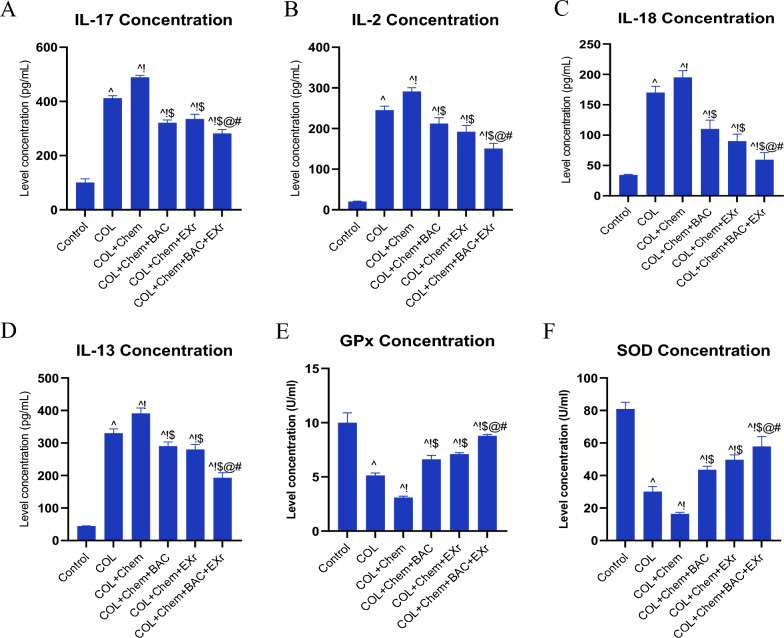
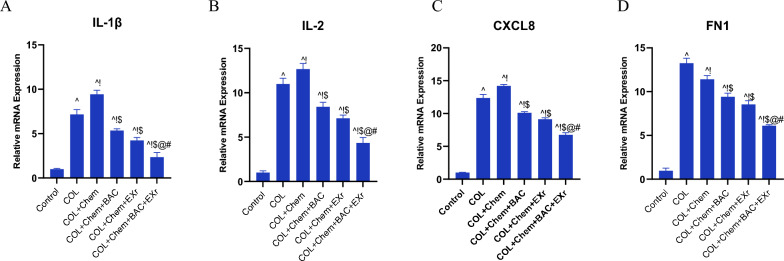
Methods: For this purpose, we gave natural chemicals obtained from Sparassis latifolia (SLPs) either alone or in conjunction with chemotherapy (5-Fluorouracil to a mouse colorectal tumor model induced by AOM-DSS. The transcription profile of non-coding RNAs (ncRNAs) and their target hub genes was evaluated using qPCR Real-Time, and ELISA techniques.

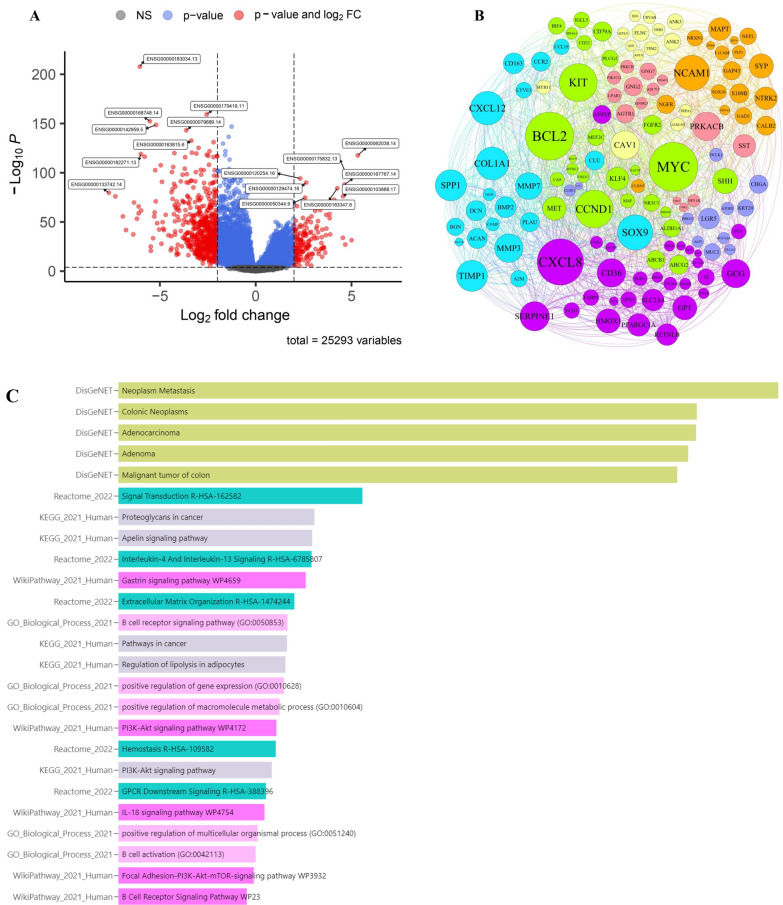
Results: MSX2, MMP7, ITIH4, and COL1A2 were identified as factors in inflammation and oxidative stress, leading to the development of COL. The hub genes listed, upstream regulatory factors such as lncRNA PVT1, NEAT1, KCNQ1OT1, SNHG16, and miR-132-3p have been discovered as biomarkers for prognosis and diagnosis of COL. The SLPs and exercise, effectively decreased the size and quantity of tumors.

Conclusions: This effect may be attributed to the modulation of gene expression levels, including MSX2, MMP7, ITIH4, COL1A2, PVT1, NEAT1, KCNQ1OT1, SNHG16, and miR-132-3p. Ultimately, SLPs and exercise have the capacity to be regarded as complementing and enhancing chemotherapy treatments, owing to their efficacious components.

Keywords: 5-Fluorouracil; AOM; Biomarkers; Colorectal Cancer; DSS; Diagnosis; Exercise; Palliative care; Sparassis latifolia.


Conflict of interest statement

There is no competing of interest to disclose.

Figures

Fig. 1
Fig. 1
TCGA-COAD analysis and enrichment assessment. A The visualization of significant DEG in colorectal cancer based on RNA-seq is depicted in the volcano plot, with consideration of a logFC ± 2. Volcano plots depicting differential expression of all transcripts in colorectal cancer (CRC) relative to normal tissue are discussed using The Cancer Genome Atlas (TCGA) data. Genes received acceptance based on criteria of logFC ± 1 and adj P.value < 0.01 to identify genes potentially involved in tumorigenesis processes. Variations in gene expression patterns have been correlated to the prognosis of individuals with CRC. B The protein–protein interactions (PPIs) network of 133 hub genes in colorectal cancer development and progression (TCGA-COAD) was presented based on network diameters (Degree = 10, betweenness centrality = 0.005, and closeness centrality = 0.2). C The enrichment analysis showed a higher abundance of hub genes related to adenoma/adenocarcinoma, malignancy, metastasis, extracellular structure organization, PI3K-Akt signaling pathway, IL-18, cancer pathway, GPCR downstream signaling, and B-cell activation
Fig. 2
Fig. 2
Data set analysis and enrichment assessment. A The visualization of significant DEG in colorectal cancer based on the microarray dataset is depicted in the heatmap diagram, with consideration of a P-value < 0.001. B The genetic network of 97 hub genes in colorectal cancer development and progression (GSE110224) was presented based on network diameters (Degree = 5, betweenness centrality = 0.006, and closeness centrality = 0.2). C The verification of hub gene's function in biological systems confirmed their involvement in a range of processes, including adenoma/adenocarcinoma, malignancy, metastasis, extracellular structure organization, PI3K-Akt signaling pathway, IL-4/IL-13/IL-17/IL-18, inflammation and inflammatory response pathway, matrix metalloproteinases, and AGE-RAGE signaling pathway
Fig. 3
Fig. 3
Generation of a gene expression panel associated with Colorectal carcinoma risk based on common genes between RNA-seq and microarray data. A The VENN diagram bioinformatics tool was used to discover common genes that were rough across RNA-seq and Microarray datasets, revealing 1582 common genes from significant gene lists based on adj p-values. B The 104 hub genes interactions network is generated in Gephi software 0.9.2 based on network parameters (Degree: 20, Betweenness Centrality: 0.005, and Closeness Centrality: 0.2), eigenvector, and modularity class. Through bioinformatics research, we have found important biomarkers in this network that might serve as valuable indicators for prognosis, diagnosis, and monitoring. C According to the enrichment facts, 104 hub genes correspond with colorectal cancer, cancer metastasis, collagen formation, extracellular matrix organization, PI3K/Akt signaling pathway, ECM receptors, Cytokine-cytokine receptor interaction, IL18 signaling pathway, and Hippo signaling pathway
Fig. 4
Fig. 4
Predicting the Survival Rate of Patients with CRC based on the Level of Hub Genes. A-D The association between gene expression and the patient prognosis was analyzed using the Kaplan–Meier graph and logRank test. The Kaplan–Meier diagram is illustrated for high-risk patients & low-risk patients. The expression mortality risk was computed based on IL1β, CXCL8, FN1, and ITIH4 expression, and the risk score median was applied as a cut-off value. The four-hub gene panel combination exhibited a stronger predictive value, with patients with lower levels of expression at CXCL8 and IL1β having a poorer overall survival (OS) compared to overproduced those (log-rank test P-value:0.05 and 0.04). Moreover, patients with overexpression expression at FN1 and ITIH4 have poorer overall survival (OS) compared to lower levels of expression (log-rank test P-value:0.1)
Fig. 5
Fig. 5
Comprehensive Analysis of tumor-infiltrating Immune Cells. A-D The correlation between Tumor-Infiltrating Immune Cells and FN1, IL1B, ITIH4, and CXCL8 is positive, as per our data—gene module to explore the correlation between gene expression and abundance of immune infiltrates in the online platform
Fig. 6
Fig. 6
A potential ceRNA network between common hub genes and predicted lncRNA and microRNAs. A, B The ceRNA network emphasized significant lncRNAs and microRNAs in the pathogenesis of colorectal cancer. Our findings suggest that the lncRNAs PVT1, NEAT1, SNHG16, and KCNQ1OT1 target hub genes through the ceRNAs network based on the miRNet online platform. Moreover, the ceRNA network predicts the significant role of microRNA 132-3p in regulating this network. C–F The enrichment analysis of PVT1, NEAT1, SNHG16, and KCNQ1OT1 revealed that these lncRNAs serve as regulatory factors and are involved in the positive regulation of CD8+ and T-cell differentiation, positive regulation of cellular senescence, abnormal immune cells, and morphology, decrease IL-2 secretion, regulation of oxidative stress, regulation of apoptosis cell death, WNT signaling pathway, abnormal intestinal absorption, circulating IL-18 concentration, as well as several biological processes such as epithelial formation, cell adhesion, morphology, cell differentiation, extracellular matrix structure organization, and immune system response, positive regulation of translation process and negative regulation of ubiquitination complex activity, obesity, ion transport, negative regulation of neuroinflammatory response, positive regulation of CREB transcription factor activity, regulation of protein kinase C sigaling pathway, histone H3-H4 monomethylation/dimethylation, non cononical WNT signaling pathway via MAPK cascade, decrease susceptibility to endotoxone shock, decrease inflammatory response, increase IL-10 secretion, decrease circulating IL-6 level and TNF-α, decrease acute inflammation, abnormal NK-cell differentiation, and negative regulation of chemokine production
Fig. 6
Fig. 6
A potential ceRNA network between common hub genes and predicted lncRNA and microRNAs. A, B The ceRNA network emphasized significant lncRNAs and microRNAs in the pathogenesis of colorectal cancer. Our findings suggest that the lncRNAs PVT1, NEAT1, SNHG16, and KCNQ1OT1 target hub genes through the ceRNAs network based on the miRNet online platform. Moreover, the ceRNA network predicts the significant role of microRNA 132-3p in regulating this network. C–F The enrichment analysis of PVT1, NEAT1, SNHG16, and KCNQ1OT1 revealed that these lncRNAs serve as regulatory factors and are involved in the positive regulation of CD8+ and T-cell differentiation, positive regulation of cellular senescence, abnormal immune cells, and morphology, decrease IL-2 secretion, regulation of oxidative stress, regulation of apoptosis cell death, WNT signaling pathway, abnormal intestinal absorption, circulating IL-18 concentration, as well as several biological processes such as epithelial formation, cell adhesion, morphology, cell differentiation, extracellular matrix structure organization, and immune system response, positive regulation of translation process and negative regulation of ubiquitination complex activity, obesity, ion transport, negative regulation of neuroinflammatory response, positive regulation of CREB transcription factor activity, regulation of protein kinase C sigaling pathway, histone H3-H4 monomethylation/dimethylation, non cononical WNT signaling pathway via MAPK cascade, decrease susceptibility to endotoxone shock, decrease inflammatory response, increase IL-10 secretion, decrease circulating IL-6 level and TNF-α, decrease acute inflammation, abnormal NK-cell differentiation, and negative regulation of chemokine production
Fig. 7
Fig. 7
Virtual Screening & Pharmacophore Modeling. A-M The chemoinformatics analysis consequences designated the catalog of the binding affinity of bioactive components derived from sparassis latifolia, which targets FN1 macromolecules based on molecular docking analysis in the PyRx offline platform. Binding affinity elaborates the binding energy, and the RMSD score elaborates the stability of this binding energy. Further, the bond type is specified based on PyMOL and BIOVIA Discovery Studio Visualizer software. Different colors in the guidance characterize bond types. N The DHRRR pharmacophore model obtained the maximum survival score (5.530872) using 4 authorized ligands for FN1. Bioactive compounds derived from sparassis latifolia did not align with the pharmacophore model based on pharmacophore screening
Fig. 8
Fig. 8
Phenotype and gene expression biomarkers related to colorectal cancer. A colon length (cm), B tumor size (mm.3), C tumor number, D Relative expression of Col1a2 gene, E Relative expression of ITIH4 gene, F Relative expression of MMP7 gene, G Relative expression of MSX2 gene, H The histologic analysis of colon tissue. Scale bars: 40 µm. (^ Demonstrates a significant difference with the control group at p < 0.05, ! Demonstrates significant difference with COL group at p < 0.05, $ Demonstrates significant difference with the COL + Chem group at p < 0.05, @ Demonstrates significant difference with COL + Chem + BAC group at p < 0.05, # Demonstrates significant difference with COL + Chemo + EXr group at p < 0.05)
Fig. 9
Fig. 9
The inflammation factors and oxidative capacity were improved by sparassis latifolia bioactive compounds and exercise training. A Concentration of the IL-17 evaluated by ELISA method. B Concentration of the IL-2 evaluated by ELISA method. C Concentration of the IL-18 evaluated by ELISA method. Concentration of the IL-13 evaluated by ELISA method. E Concentration of the GPx was evaluated using the ELISA method. F. Concentration of the SOD evaluated by ELISA method. (^ Demonstrates a significant difference with the control group at p < 0.05, ! Demonstrates significant difference with COL group at p < 0.05, $ Demonstrates significant difference with the COL + Chem group at p < 0.05, @ Demonstrates significant difference with COL + Chem + BAC group at p < 0.05, # Demonstrates significant difference with COL + Chemo + EXr group at p < 0.05)
Fig. 10
Fig. 10
Bioactive compounds of sparassis latifolia along with exercise training alleviated the vital hub genes in the COL mice injected with chemotherapy 5-FU. A Relative expression of the IL-1β, B Relative expression of the IL-2, C Relative expression of the CXCL8, D. Relative expression of the FN1. (^ Demonstrates a significant difference with the control group at p < 0.05, ! Demonstrates significant difference with COL group at p < 0.05, $ Demonstrates significant difference with the COL + Chem group at p < 0.05, @ Demonstrates significant difference with COL + Chem + BAC group at p < 0.05, # Demonstrates significant difference with COL + Chemo + EXr group at p < 0.05)
Fig. 11
Fig. 11
Bioactive compounds of sparassis latifolia and exercise training regulated the ceRNAs network. A Expression level of the Neat1, B Expression level of the Kcnq1ot1, C Expression level of the PVT1, D Expression level of the Snhg16, E Expression level of the miR132-3p. ^ Demonstrates a significant difference with the control group at p < 0.05, ! Demonstrates significant difference with COL group at p < 0.05, $ Demonstrates significant difference with the COL + Chem group at p < 0.05, @ Demonstrates significant difference with COL + Chem + BAC group at p < 0.05, # Demonstrates significant difference with COL + Chemo + EXr group at p < 0.05
Fig. 12
Fig. 12
Correlation between lncRNAs-miRNA-mRNA mapping. A Correlation analysis of FN1 mRNA with NEAT. B Correlation analysis of FN1 mRNA with Snhg16. C Correlation analysis of FN1 mRNA with Kcnq1ot1. D Correlation analysis of FN1 mRNA with PVT1. E. Correlation analysis of FN1 mRNA with miR132-3p

References

    1. Xi Y, Xu P. Global colorectal cancer burden in 2020 and projections to 2040. Transl Oncol. 2021;14(10):101174. doi: 10.1016/j.tranon.2021.101174. - DOI - PMC - PubMed
    1. Rabeneck L, Chiu H-M, Senore C. International perspective on the burden of colorectal cancer and public health effects. Gastroenterology. 2020;158(2):447–452. doi: 10.1053/j.gastro.2019.10.007. - DOI - PubMed
    1. Shahbaz SK, Koushki K, Ayati SH, Bland AR, Bezsonov EE, Sahebkar A. Inflammasomes and colorectal cancer. Cells. 2021;10:9. - PMC - PubMed
    1. Hajibabaie F, Abedpoor N, Assareh N, Tabatabaiefar MA, Shariati L, Zarrabi A. The importance of SNPs at miRNA binding sites as biomarkers of gastric and colorectal cancers: a systematic review. J Person Med. 2022;12(3):456. doi: 10.3390/jpm12030456. - DOI - PMC - PubMed
    1. Li J, Chen D, Shen M. Tumor microenvironment shapes colorectal cancer progression, metastasis, and treatment responses. Front Med. 2022;9:869010. doi: 10.3389/fmed.2022.869010. - DOI - PMC - PubMed

LinkOut - more resources