Case Reports
. 2024 Apr 18;12(1):62.
doi: 10.1186/s40478-024-01743-w.

ADNP dysregulates methylation and mitochondrial gene expression in the cerebellum of a Helsmoortel-Van der Aa syndrome autopsy case

Affiliations
Case Reports

ADNP dysregulates methylation and mitochondrial gene expression in the cerebellum of a Helsmoortel-Van der Aa syndrome autopsy case

Claudio D'Incal et al. Acta Neuropathol Commun. .

Erratum in

Abstract

Background: Helsmoortel-Van der Aa syndrome is a neurodevelopmental disorder in which patients present with autism, intellectual disability, and frequent extra-neurological features such as feeding and gastrointestinal problems, visual impairments, and cardiac abnormalities. All patients exhibit heterozygous de novo nonsense or frameshift stop mutations in the Activity-Dependent Neuroprotective Protein (ADNP) gene, accounting for a prevalence of 0.2% of all autism cases worldwide. ADNP fulfills an essential chromatin remodeling function during brain development. In this study, we investigated the cerebellum of a died 6-year-old male patient with the c.1676dupA/p.His559Glnfs*3 ADNP mutation.

Results: The clinical presentation of the patient was representative of the Helsmoortel-Van der Aa syndrome. During his lifespan, he underwent two liver transplantations after which the child died because of multiple organ failure. An autopsy was performed, and various tissue samples were taken for further analysis. We performed a molecular characterization of the cerebellum, a brain region involved in motor coordination, known for its highest ADNP expression and compared it to an age-matched control subject. Importantly, epigenome-wide analysis of the ADNP cerebellum identified CpG methylation differences and expression of multiple pathways causing neurodevelopmental delay. Interestingly, transcription factor motif enrichment analysis of differentially methylated genes showed that the ADNP binding motif was the most significantly enriched. RNA sequencing of the autopsy brain further identified downregulation of the WNT signaling pathway and autophagy defects as possible causes of neurodevelopmental delay. Ultimately, label-free quantification mass spectrometry identified differentially expressed proteins involved in mitochondrial stress and sirtuin signaling pathways amongst others. Protein-protein interaction analysis further revealed a network including chromatin remodelers (ADNP, SMARCC2, HDAC2 and YY1), autophagy-related proteins (LAMP1, BECN1 and LC3) as well as a key histone deacetylating enzyme SIRT1, involved in mitochondrial energy metabolism. The protein interaction of ADNP with SIRT1 was further biochemically validated through the microtubule-end binding proteins EB1/EB3 by direct co-immunoprecipitation in mouse cerebellum, suggesting important mito-epigenetic crosstalk between chromatin remodeling and mitochondrial energy metabolism linked to autophagy stress responses. This is further supported by mitochondrial activity assays and stainings in patient-derived fibroblasts which suggest mitochondrial dysfunctions in the ADNP deficient human brain.

Conclusion: This study forms the baseline clinical and molecular characterization of an ADNP autopsy cerebellum, providing novel insights in the disease mechanisms of the Helsmoortel-Van der Aa syndrome. By combining multi-omic and biochemical approaches, we identified a novel SIRT1-EB1/EB3-ADNP protein complex which may contribute to autophagic flux alterations and impaired mitochondrial metabolism in the Helsmoortel-Van der Aa syndrome and holds promise as a new therapeutic target.

Keywords: Activity-dependent neuroprotective protein (ADNP); Autophagy; Chromatin remodeler; Helsmoortel–Van der Aa syndrome; Methylation; Mitochondria; Post-mortem brain; Sirtuin 1 (SIRT1).


Conflict of interest statement

Professor Dr. Em. Illana Gozes serves as VP drug development at ExoNavis Therapeutics LTD, clinically developing Davunetide.

Figures
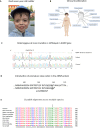
Fig. 1
Fig. 1
Identification of a heterozygous de novo mutation in the ADNP gene. (A) Facial photograph of the six-year-old child (https://www.adnpfoundation.org/). (B) Schematic representation of the clinical manifestation of the patient with Helsmoortel–Van der Aa syndrome, including autism, severe ID, and epilepsy. (C) DNA sequencing chromatogram of control and patient alleles, confirming a heterozygous nucleotide duplication (c.1676duplA) in the ADNP gene, (D) replacing the histidine at residue 559 with glutamic acid with a frameshift of two amino acids and introduction of a stop codon (p.His559Glnfs*3). (E) ClustalW alignment across multiple species of ADNP amino acids 520–580. Almost all residues of the ADNP protein are highly conserved amongst vertebrates. The arrow (↓) indicates the species-conserved histidine (H) residue, which is altered in the patient to a glutamic acid (Q) residue. The asterisk (*) indicates positions which have a single, fully conserved residue. A colon (:) indicates conservation between amino acid residues of similar properties
Fig. 2
Fig. 2
ADNP expression analysis of the cerebellum. (A) RT-PCR showing a significant increase in ADNP mRNA levels in the patient cerebellum compared to an age-and sex matched control subject (***p = 0.0001; unpaired student T-test). Gene expression values were normalized with three stable reference genes, i.e., β-Actin (BACT), β-2-Microglobulin (B2M), and Ubiquitin C (UBC). (B) ADNP protein expression analysis using an N-terminal antibody. Western blotting showed the presence of wild-type ADNP (150 kDa) in overexpression lysates with presence of the truncated protein. However, expression was absent in the patient as compared to the control, where wild-type ADNP could be visualized. (C) ADNP protein expression analysis using a C-terminal antibody. Western blotting showed the presence of wild-type ADNP (150 kDa) in overexpression lysates, as well as in the control subject, but not in the patient. GAPDH was used as a loading control for normalization
Fig. 3
Fig. 3
The ADNP patient mutation impairs expression in the chromatin-enriched protein fraction. (A) 3D protein structure representation of the wild-type ADNP glutaredoxin active site (pink), NAP octapeptide sequence (fuchsia), eIF-4E interaction motif (blue), nuclear localization signal (dark cyan), homeobox domain (blue violet), and HP1 interaction motif (purple). The NAP domain (fuchsia) presents at the surface of the protein. (B) The nuclear localization signal-truncating p.His559Glnfs*3 mutant shows loss of the HP1-binding motif and DNA homeobox domain. (C) N-terminal ADNP detection in different subcellular compartments normalized to their protein fraction-specific loading controls. Detection of wild-type N-DYKDDDDK (Flag®)-tagged ADNP shows a molecular weight of 150 kDa. The p.His559Glnfs*3 mutant showed a lower molecular weight of 63 kDa. Cytoplasmic enrichment shows expression of wild-type ADNP (150 kDa) and the mislocalized p.His559Glnfs*3 mutant (63 kDa) with no difference in expression (p = 0.71; ns). Chromatin-enriched fraction demonstrated partial loss of mutant ADNP levels compared to wild-type ADNP, showing a dramatic decrease in expression (p = 0.03; *). Cytoskeletal fraction is enriched for wild-type ADNP and the p.His559Glnfs*3 mutant, with no significant difference in expression (p = 0.42; ns). GAPDH (cytoplasmic fraction), histone H3 (chromatin-bound fraction), and β-actin (cytoskeletal fraction) were used as loading controls. Statistical analysis of the subcellular fractionation immunoblots was performed using an unpaired two-tailed student T-test, assuming equal variances
Fig. 4
Fig. 4
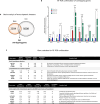
ADNP methylation signature in the juvenile post-mortem cerebellum. (A) Genomic scatter plot indicating the hypermethylated genes (Δβ > 0.2) of the patient (red), the hypomethylated genes (Δβ < −0.2) of the patient (blue). The chromosomal positions of the genes are shown on the x-axis. (B) Pyrosequencing confirmation of a subset of hyper- and hypomethylated genes. Hypermethylated genes, e.g., OTX2, SLC25A21 and DNAJ6, show increased CpG methylation in the patient, whereas hypomethylated genes, e.g., COL4A2, MAGI2 and CTNND2, present with a nearly absent percentage of CpG methylation. (C) Metascape functional annotation of biological processes. Hyper- and hypomethylated genes cluster in associated processes such as the actin cytoskeleton and nervous system developmental disorder amongst others. (D) Predictive String v11.5 protein–protein interaction analysis of ADNP. The proteins are indicated as nodes with interconnecting lines representing the interaction. ADNP is surrounded by protein regulating specific autophagy-related processes and protein ubiquitination. (E) Transcription factors (TFs) enriched in patient cerebellum of hyper- and hypomethylated gene co-expression. TFs associated with hypermethylated genes are represented in blue, while the TFs associated with the hypomethylated genes are depicted in red. TFs shared amongst the overlapping genes are shown in green. ADNP was identified as the top transcription factor controlling the hypomethylated genes (black box)
Fig. 4
Fig. 4
ADNP methylation signature in the juvenile post-mortem cerebellum. (A) Genomic scatter plot indicating the hypermethylated genes (Δβ > 0.2) of the patient (red), the hypomethylated genes (Δβ < −0.2) of the patient (blue). The chromosomal positions of the genes are shown on the x-axis. (B) Pyrosequencing confirmation of a subset of hyper- and hypomethylated genes. Hypermethylated genes, e.g., OTX2, SLC25A21 and DNAJ6, show increased CpG methylation in the patient, whereas hypomethylated genes, e.g., COL4A2, MAGI2 and CTNND2, present with a nearly absent percentage of CpG methylation. (C) Metascape functional annotation of biological processes. Hyper- and hypomethylated genes cluster in associated processes such as the actin cytoskeleton and nervous system developmental disorder amongst others. (D) Predictive String v11.5 protein–protein interaction analysis of ADNP. The proteins are indicated as nodes with interconnecting lines representing the interaction. ADNP is surrounded by protein regulating specific autophagy-related processes and protein ubiquitination. (E) Transcription factors (TFs) enriched in patient cerebellum of hyper- and hypomethylated gene co-expression. TFs associated with hypermethylated genes are represented in blue, while the TFs associated with the hypomethylated genes are depicted in red. TFs shared amongst the overlapping genes are shown in green. ADNP was identified as the top transcription factor controlling the hypomethylated genes (black box)
Fig. 5
Fig. 5
Cerebellar and lymphoid gene expression changes are associated with different ADNP mutations. (A) Volcano plot of differentially expressed genes (DEGs) in the ADNP cerebellum using the NOISeq algorithm, representing the effect size M (log2 ratio) and D (difference between conditions) values. The DEG are shown in blue. (B) Gene set enrichment analysis of all DEGs in gene ontology (GO), biological processes (BP) and molecular function (MF) reveals specific Helsmoortel–Van der Aa syndrome-related pathways in the ADNP brain. (C) RT-PCR showing a significant reduction of METTL3, BECN1 and CTNNB1 mRNA levels in the ADNP cerebellum compared to the age-matched control subject. Expression values were normalized using the housekeeping genes ACTB, B2M and UBC. Data was analyzed using an unpaired student T-test. (D) Volcano plot of DEGs in the patient LCLs using the DESeq2 package, displaying the significance (-log10q) and effect size (log2FC). The DEG are shown in blue. (E) Functional gene set enrichment of GO and BP using differentially expressed genes in the ADNP LCLs as compared to age- and sex-matched controls. UMAP clustering of gene sets colored by standard deviation, variance, or mean fold-change in patient LCLs shows clear downregulation of the WNT, Hedgehog and Notch signaling pathways (marked in a red box), impairing proper neuronal development. Downregulated genes, blue; upregulated genes, red. (F) RT-PCR showing a significant increase of CBX3, CTNNAL1, SMG5 and UPF3B together with a significant decrease in WTN10A mRNA levels in patients versus control LCLs. Expression values were normalized using the housekeeping genes GAPDH, RPL13A and SDHA. Data was subsequently analyzed with a Mann–Whitney U test for unpaired measures
Fig. 6
Fig. 6
Meta-analysis of the transcriptomic signature identified in the ADNP brain and lymphoblasts. (A) Venn diagram representing the exact amount of DEGs in the human ADNP cerebellum and lymphoblastoid data sets, converging to an amount of 241 overlapping genes. (B) RT-PCR showing a significant decrease of IGFBP2, WNT2, SLC25A25 together with a significant increase in RUBCN and RUNX1 mRNA levels in patient brain and patient LCLs as compared to their age-matched controls. Note a difference in mRNA expression of BMP6 and METTL3 amongst brain tissue and LCLs. Expression values were normalized using the tissue-specific housekeeping genes (mentioned above). Data was subsequently analyzed with an unpaired student T-test (brain) or Mann–Whitney U test for unpaired measures (LCLs). (C) Correlation of DEGs from the NOIseq and DESeq2 analysis (RNA-seq) and RT-PCR confirmations with their functional cellular role. Selected genes are represented with their Log2FC and compared for overlap with RT-PCR. Arrow upwards, upregulation; arrow downwards, downregulation
Fig. 7
Fig. 7
Discovery of SIRT1 interactions in the autistic brain, linking chromatin remodelers to autophagy. (A) Volcano plot of differentially expressed proteins (DEPs) in the ADNP patient cerebellum, represented by the significance (−log10(p)) and effect size (log2FC). Proteins with a significant downregulation are shown in blue and those with an upregulation in red. Note the marked difference in expression of the ADNP-interacting protein CBX1/HP1β. (B) Immunoblot confirmations of DEPs exposed to their specific antibodies. (C) Top 15-ranked canonical IPA pathways of the ADNP brain, represented as z-scored expression values and significance (−log p-value). Activated pathways are presented in orange, respectively lowered activity in blue; no activity pattern available (grey); pathways with no difference in activity (white). (D) A predictive protein–protein interaction network was generated by String Version 11.5, integrating associations of a co-expression hub identified amongst the DEPs. Proteins are represented by colored network nodes in relation to each other with SIRT1 fulfilling a centralizing role. The edges illustrate functional associations and the lines between the nodes represent the existence of evidence for associations
Fig. 8
Fig. 8
ADNP indirectly interacts with the histone deacetylase enzyme SIRT1 through the microtubule end-binding proteins EB1/EB3. (A) Adnp and Sirt1 immunostaining (red Cy3 fluorescence) in cryosections of the murine cerebellum was assessed by confocal scanning microscopy. Adnp was mainly observed in the nucleus and Sirt1 was mostly located in the cytoplasm. (B) Co-IP assay of Adnp and Sirt1 in the murine cerebellum. IP-competent EB1 and EB3 antibodies were crosslinked to agarose beads and sequentially eluted in fractions (input, In; flow-through, Ft; three consecutive washes, w1-w3; and elution, E). All fractions were analyzed by western blotting for Adnp, Sirt1, EB1, and EB3. IgG non-reactive beads were used as a negative control. GAPDH has been used as loading control for all western blots, and critical assessment of the accuracy of the Co-IP method. (C) ELM analysis identified shared motif sequences of Adnp and Sirt, including 14–3–3 motifs (green), SxIP motif (blue), SH3 domains (orange), and the SSIP motif (violet). (D) In silico 3D-molecular docking of Adnp (SxIP motif) to EB1/3, left (purple) and right (pink) respectively to Sirt1 in the panel below (SSIP motif) to EB1/3, left (purple) and right (pink)
Fig. 9
Fig. 9
Mitophagy gene signature and mitochondrial impairments in ADNP patient-derived cell lines. (A) Expression levels of mitophagy-related genes in ADNP patient LCLs compared to age and sex-matched controls. mRNA sequencing demonstrated an upregulated mitophagy gene signature in patient LCLs as compared to controls. (B) RT-PCR showing a significant increase of mitophagy-related genes in ADNP patients versus control LCLs. Expression values were normalized using the housekeeping genes GAPDH, RPL13A and SDHA. Data was subsequently analyzed with an unpaired student T-test assuming unequal variances with a Welch’s multiple testing correction. (C) Subcellular mitochondrial distribution using the MitoTracker® Red CM-H2XRos fluorescent staining of control subjects (A-B) and ADNP patient (C-D) fibroblasts. The white arrow indicated the unstained nucleus of the fibroblast. (D) MitoTracker® red fluorescent signal (RFU) was normalized to brightfield cell count and quantified in patient and control fibroblasts using a multimode microplate reader (Tecan Spark™) at an excitation of 485 nm. A significant decrease (p = 0.01, student T-test) in red fluorescent signal, corresponding to the mitochondrial activity, was observed in patient-derived fibroblasts (blue) compared to the control cells (red). (E) The Seahorse Cell Mito Stress Assay was used to measure changes in oxygen consumption rate (OCR) in patient-derived (blue) and control (red) fibroblasts after different triggers that inhibit or activate mitochondrial respiration. Oligo = oligomycin, a complex V inhibitor to decrease the electron flow through the electron transport chain (ETC); FCCP = Carbonyl cyanide-p-trifluoromethoxyphenylhydrazone, the uncoupling agent to promote maximum electro flow through of the ETC; Rot/AA = rotenone and antimycin, complex I and complex II inhibitors respectively, to shut down the mitochondrial-related respiration. (F) Based on the changes in OCR, several aspects of the mitochondrial respiration could be quantified using the Agilent Seahorse analytics software. Statistical significance was calculated using an unpaired student T-test assuming equal variances. Data is shown as mean ± sd. The basal respiration (p = 0.04, *), proton leak (p = 0.21; ns), ATP-linked respiration (p = 0.06, ns), maximal respiration (p = 0.28, ns), spare capacity (p = 0.84, ns), and non-mitochondrial respiration (p = 0.79; ns) were indicated for patients (blue) compared controls (red)

References

    1. Vissers LELM, de Ligt J, Gilissen C et al (2010) A de novo paradigm for mental retardation. Nat Genet 42:1109–1112. 10.1038/ng.712 - PubMed
    1. Helsmoortel C, Vulto-van Silfhout AT, Coe BP et al (2014) A SWI/SNF-related autism syndrome caused by de novo mutations in ADNP. Nat Genet 46:380–384. 10.1038/ng.2899 - PMC - PubMed
    1. Vandeweyer G, Helsmoortel C, Van Dijck A et al (2014) The transcriptional regulator ADNP links the BAF (SWI/SNF) complexes with autism. Am J Med Genet C Semin Med Genet 166C:315–326. 10.1002/ajmg.c.31413 - PMC - PubMed
    1. Van Dijck A, Vulto-van Silfhout AT, Cappuyns E et al (2019) Clinical presentation of a complex neurodevelopmental disorder caused by mutations in ADNP. Biol Psychiatry 85:287–297. 10.1016/j.biopsych.2018.02.1173 - PMC - PubMed
    1. Rolland T, Cliquet F, Anney RJL et al (2023) Phenotypic effects of genetic variants associated with autism. Nat Med 29:1671–1680. 10.1038/s41591-023-02408-2 - PMC - PubMed

Publication types

LinkOut - more resources