

Altered neuroepithelial morphogenesis and migration defects in iPSC-derived cerebral organoids and 2D neural stem cells in familial bipolar disorder
- PMID: 38638145
- PMCID: PMC11024480
- DOI: 10.1093/oons/kvae007
Altered neuroepithelial morphogenesis and migration defects in iPSC-derived cerebral organoids and 2D neural stem cells in familial bipolar disorder
Abstract
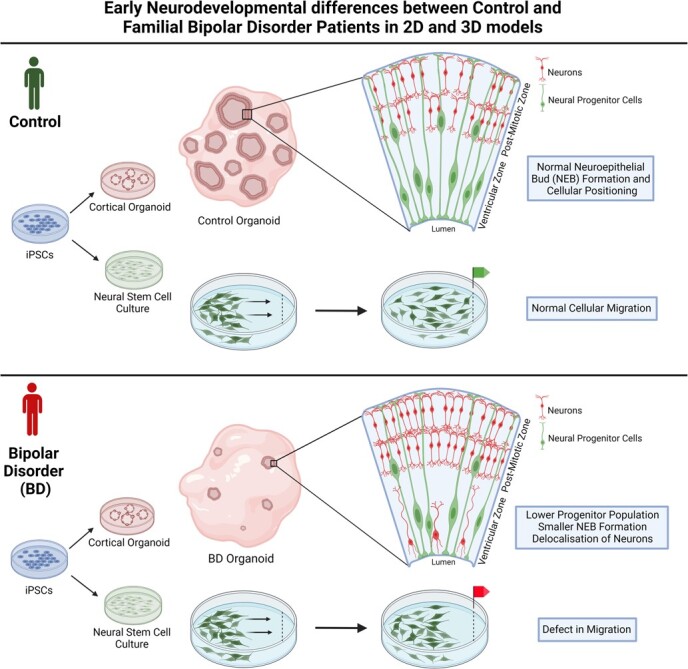
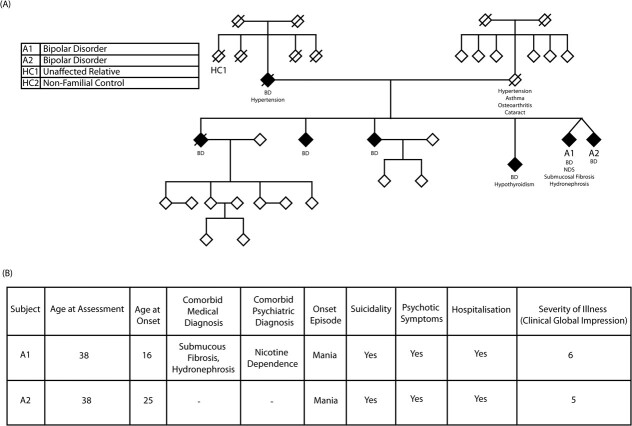
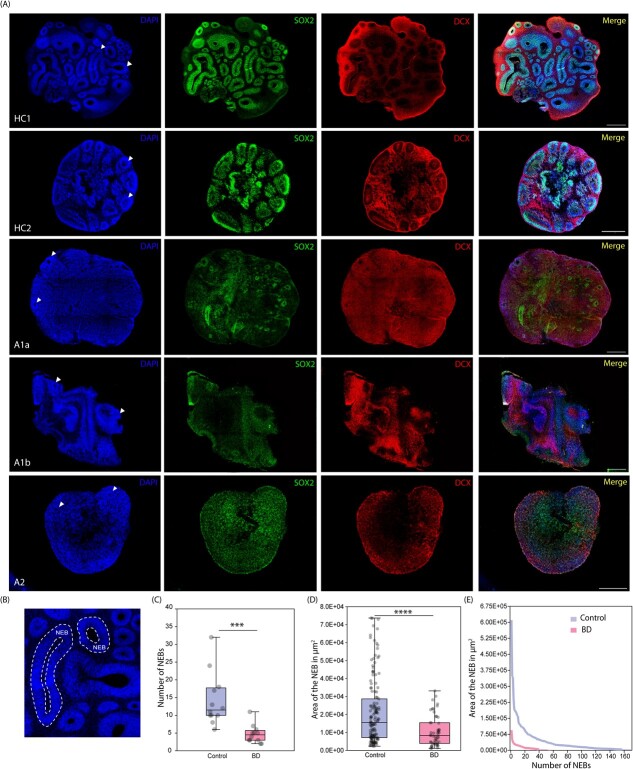
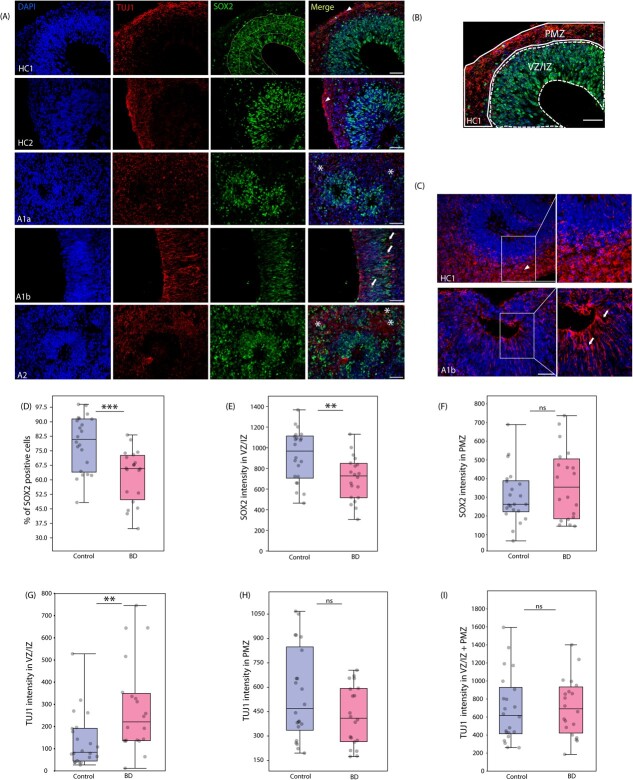
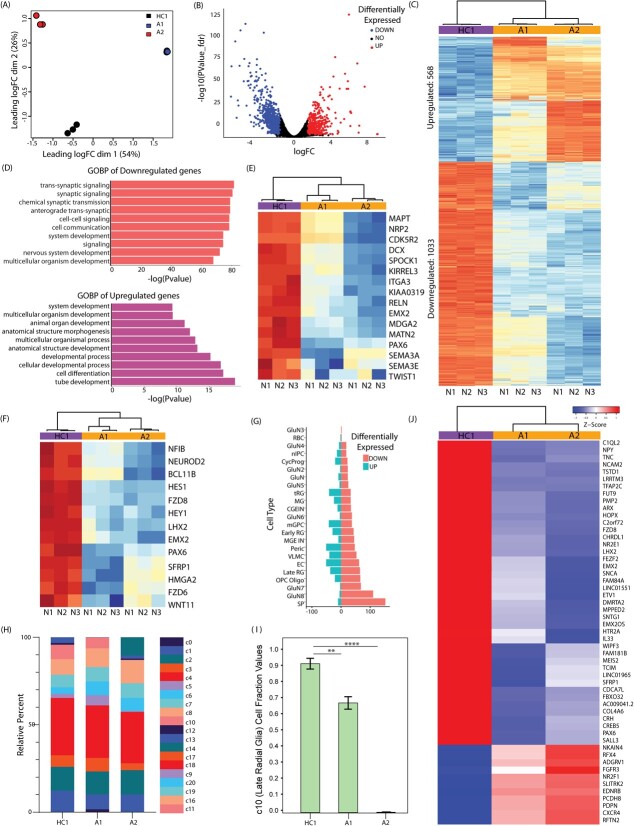
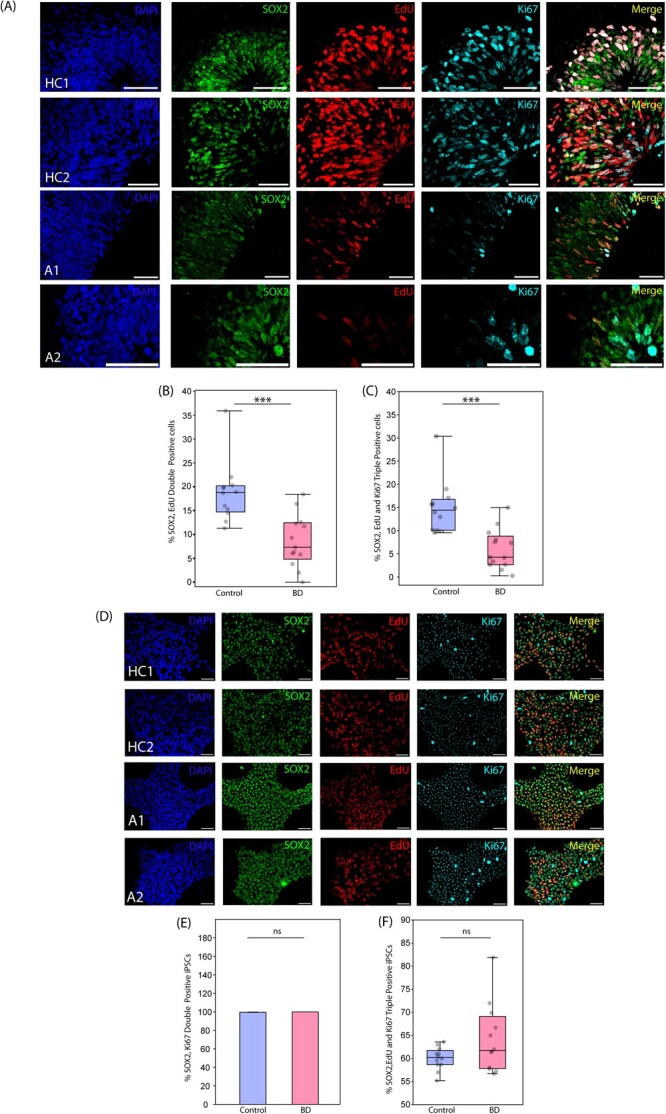
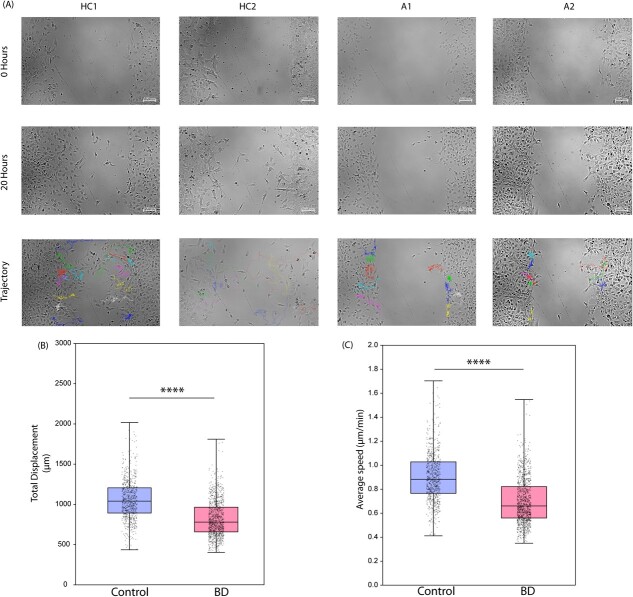
Bipolar disorder (BD) is a severe mental illness that can result from neurodevelopmental aberrations, particularly in familial BD, which may include causative genetic variants. In the present study, we derived cortical organoids from BD patients and healthy (control) individuals from a clinically dense family in the Indian population. Our data reveal that the patient organoids show neurodevelopmental anomalies, including organisational, proliferation and migration defects. The BD organoids show a reduction in both the number of neuroepithelial buds/cortical rosettes and the ventricular zone size. Additionally, patient organoids show a lower number of SOX2-positive and EdU-positive cycling progenitors, suggesting a progenitor proliferation defect. Further, the patient neurons show abnormal positioning in the ventricular/intermediate zone of the neuroepithelial bud. Transcriptomic analysis of control and patient organoids supports our cellular topology data and reveals dysregulation of genes crucial for progenitor proliferation and neuronal migration. Lastly, time-lapse imaging of neural stem cells in 2D in vitro cultures reveals abnormal cellular migration in BD samples. Overall, our study pinpoints a cellular and molecular deficit in BD patient-derived organoids and neural stem cell cultures.
Keywords: bipolar disorder patients; cellular migration; cortical organoids; neuroepithelial bud organization.
© The Author(s) 2024. Published by Oxford University Press.
Conflict of interest statement
The authors declare that they have no conflict of interest.
Figures
Similar articles
-
Bipolar disorder-iPSC derived neural progenitor cells exhibit dysregulation of store-operated Ca2+ entry and accelerated differentiation.Mol Psychiatry. 2023 Dec;28(12):5237-5250. doi: 10.1038/s41380-023-02152-6. Epub 2023 Jul 4. Mol Psychiatry. 2023. PMID: 37402854 Free PMC article.
-
Human iPSC-Derived Cerebral Organoids Model Cellular Features of Lissencephaly and Reveal Prolonged Mitosis of Outer Radial Glia.Cell Stem Cell. 2017 Apr 6;20(4):435-449.e4. doi: 10.1016/j.stem.2016.12.007. Epub 2017 Jan 19. Cell Stem Cell. 2017. PMID: 28111201 Free PMC article.
-
Comparative Transcriptomic Analysis of Cerebral Organoids and Cortical Neuron Cultures Derived from Human Induced Pluripotent Stem Cells.Stem Cells Dev. 2020 Nov 1;29(21):1370-1381. doi: 10.1089/scd.2020.0069. Epub 2020 Sep 22. Stem Cells Dev. 2020. PMID: 32862797 Free PMC article.
-
Cortical Organoids to Model Microcephaly.Cells. 2022 Jul 7;11(14):2135. doi: 10.3390/cells11142135. Cells. 2022. PMID: 35883578 Free PMC article. Review.
-
Stem cell-based region-specific brain organoids: Novel models to understand neurodevelopmental defects.Birth Defects Res. 2022 Oct 1;114(16):1003-1013. doi: 10.1002/bdr2.2004. Epub 2022 Mar 25. Birth Defects Res. 2022. PMID: 35332709 Review.
Cited by
-
Human cerebral organoids: Complex, versatile, and human-relevant models of neural development and brain diseases.Neural Regen Res. 2026 Mar 1;21(3):837-854. doi: 10.4103/NRR.NRR-D-24-01639. Epub 2025 May 6. Neural Regen Res. 2026. PMID: 40364645 Free PMC article.
-
Transcriptomic and genetic analysis suggests a role for mitochondrial dysregulation in schizophrenia.medRxiv [Preprint]. 2025 Mar 15:2025.03.14.25323827. doi: 10.1101/2025.03.14.25323827. medRxiv. 2025. PMID: 40162239 Free PMC article. Preprint.
References
-
- DelBello MP, et al. Bipolar disorder. In: Squire LR, (ed.), Encyclopedia of Neuroscience. Oxford: Academic Press, 2009, 201–7
-
- Fernando SG. Diagnosis and management of bipolar disorders. BMJ 2023;381:e073591 - PubMed
-
- Ferrari AJ, Stockings E, Khoo JPet al. . The prevalence and burden of bipolar disorder: findings from the global burden of disease study 2013. Bipolar Disord 2016;18:440–50 - PubMed
Grants and funding
LinkOut - more resources
Full Text Sources