. 2024 Apr 3;6(2):fcae095.
doi: 10.1093/braincomms/fcae095. eCollection 2024.

Small fibre neuropathy in Fabry disease: a human-derived neuronal in vitro disease model and pilot data

Affiliations

Small fibre neuropathy in Fabry disease: a human-derived neuronal in vitro disease model and pilot data

Thomas Klein et al. Brain Commun. .

Abstract

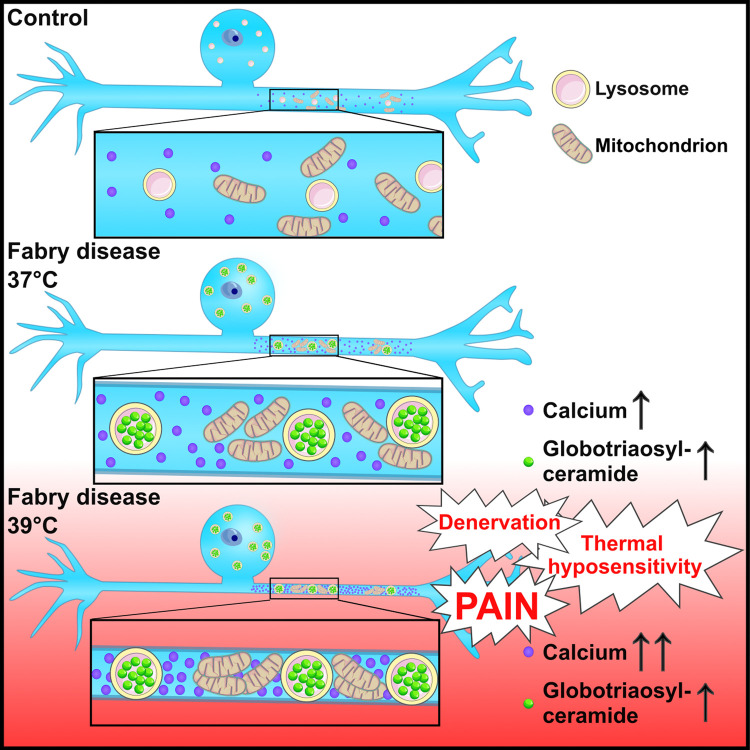
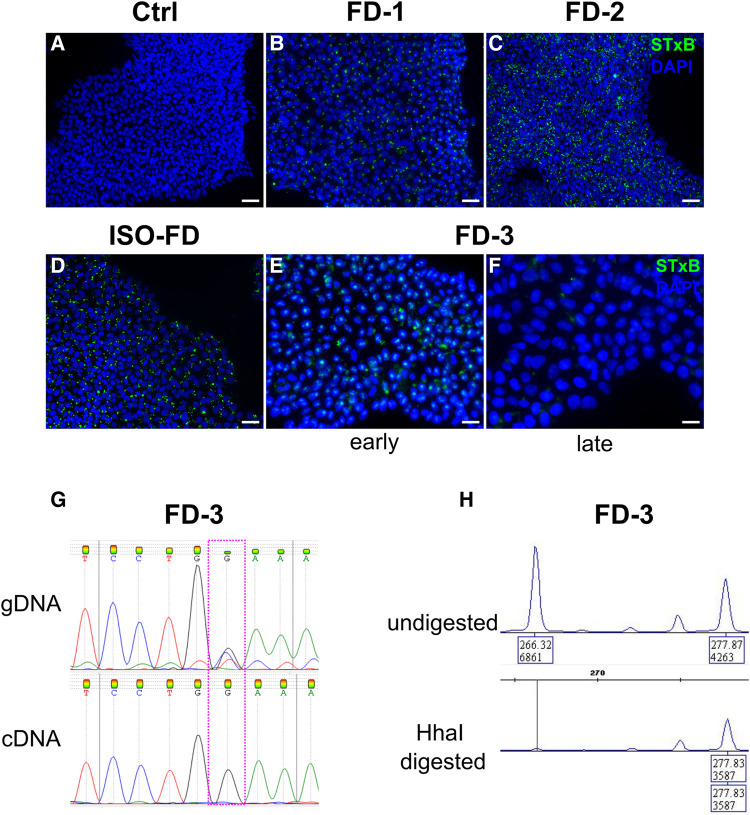
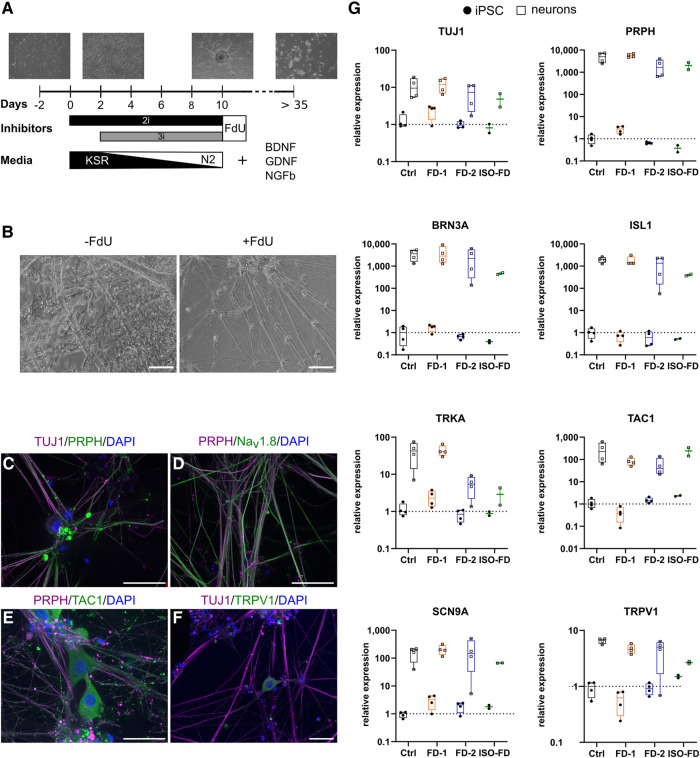
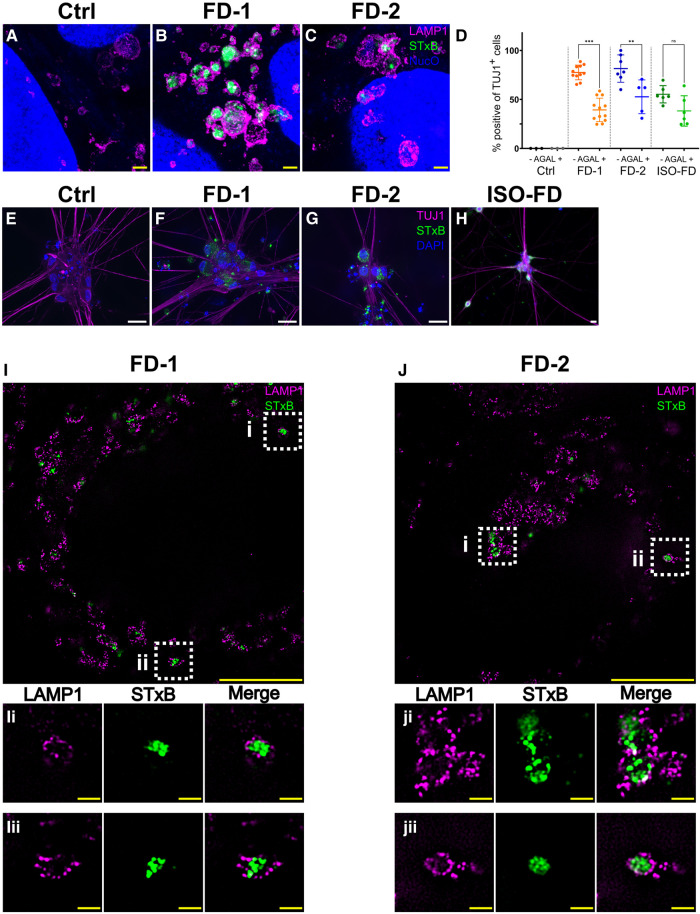
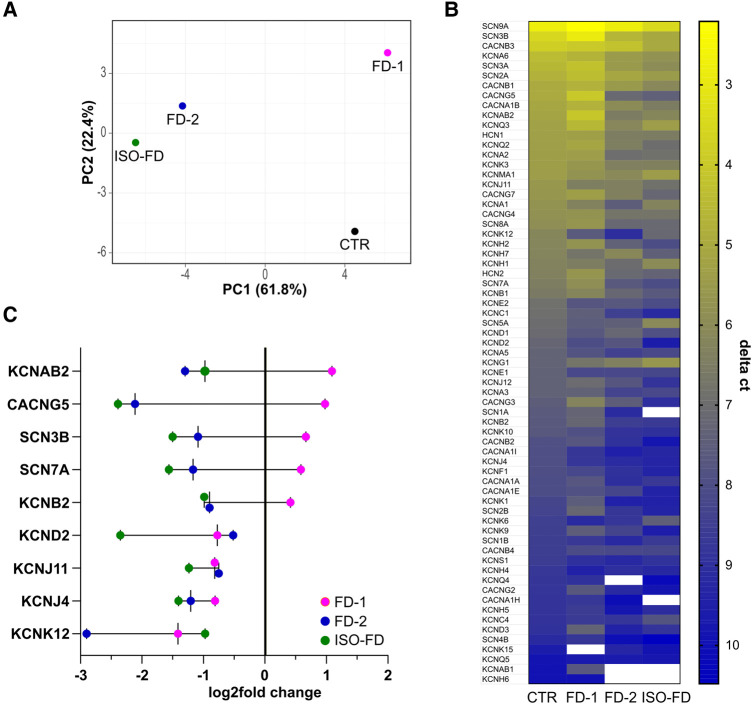
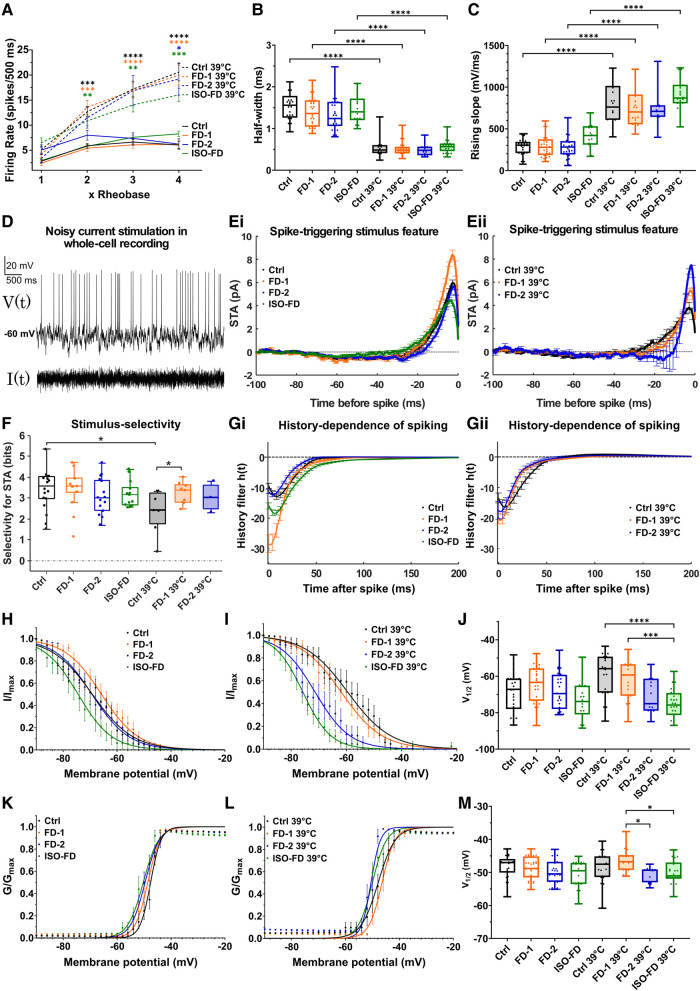
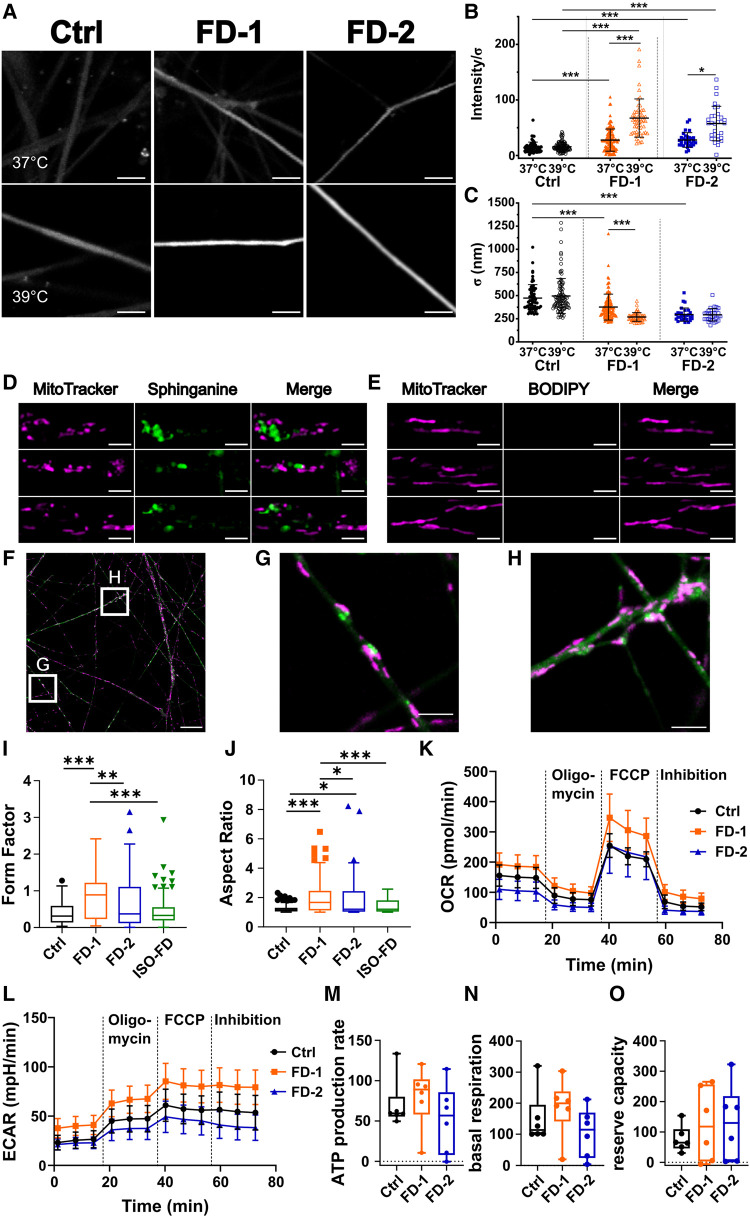
Acral burning pain triggered by fever, thermal hyposensitivity and skin denervation are hallmarks of small fibre neuropathy in Fabry disease, a life-threatening X-linked lysosomal storage disorder. Variants in the gene encoding alpha-galactosidase A may lead to impaired enzyme activity with cellular accumulation of globotriaosylceramide. To study the underlying pathomechanism of Fabry-associated small fibre neuropathy, we generated a neuronal in vitro disease model using patient-derived induced pluripotent stem cells from three Fabry patients and one healthy control. We further generated an isogenic control line via gene editing. We subjected induced pluripotent stem cells to targeted peripheral neuronal differentiation and observed intra-lysosomal globotriaosylceramide accumulations in somas and neurites of Fabry sensory neurons using super-resolution microscopy. At functional level, patch-clamp analysis revealed a hyperpolarizing shift of voltage-gated sodium channel steady-state inactivation kinetics in isogenic control neurons compared with healthy control neurons (P < 0.001). Moreover, we demonstrate a drastic increase in Fabry sensory neuron calcium levels at 39°C mimicking clinical fever (P < 0.001). This pathophysiological phenotype was accompanied by thinning of neurite calibres in sensory neurons differentiated from induced pluripotent stem cells derived from Fabry patients compared with healthy control cells (P < 0.001). Linear-nonlinear cascade models fit to spiking responses revealed that Fabry cell lines exhibit altered single neuron encoding properties relative to control. We further observed mitochondrial aggregation at sphingolipid accumulations within Fabry sensory neurites utilizing a click chemistry approach together with mitochondrial dysmorphism compared with healthy control cells. We pioneer pilot insights into the cellular mechanisms contributing to pain, thermal hyposensitivity and denervation in Fabry small fibre neuropathy and pave the way for further mechanistic in vitro studies in Fabry disease and the development of novel treatment approaches.

Keywords: Fabry disease; disease model; globotriaosylceramide; induced pluripotent stem cells; lysosomes.


Conflict of interest statement

The authors report no competing interests.

Figures

Graphical Abstract
Graphical Abstract
Figure 1
Figure 1
Gb3 accumulations in iPSC and skewed XCI. (A) Ctrl-iPSC show no Gb3 accumulations. Scale bar: 50 μm. (B)–(D) FD-1, FD-2 and ISO-FD iPSC display numerous Gb3 accumulations. Scale bars: 50 μm. (E) iPSC from the female FD-3 line shows Gb3 accumulations in early passages. Scale bar: 25 μm. (F) Gb3 accumulations are lost in iPSC of FD-3 during cultivation (>10 passages). Scale bar: 25 μm. (G) Analysis of gDNA via Sanger sequencing shows the expected heterozygous disease–associated mutation, whereas analysis of cDNA from late FD-3 cells (>10 passages) shows the wild-type sequence. (H) Analysis of X-chromosomal inactivation in late passage (>10 passages) by methylation-sensitive fragment analysis of the polymorphic (CAG)n repeat in the AR gene. FD-3 cells show a complete shift towards one allele. Ctrl, control; DAPI, 4′,6-diamidino-2-phenylindole; FD-1, FD-2, FD-3, patients with Fabry disease; ISO-FD, isogenic Fabry line.
Figure 2
Figure 2
Differentiation strategy and characterization of iPSC-derived sensory neurons. (A) A schematic overview of the differentiation from iPSC to sensory neurons depicting the time frame and media composition. (B) Incubation with FdU leads to a decrease in non-neuronal cell populations. Scale bars: 50 μm. (C) iPSC-derived sensory neurons show expression of neuronal (i.e. TUJ1) and peripheral (i.e. PRPH) markers. Scale bar: 25 μm. (D) Co-expression of TUJ1 and nociceptive Nav1.8. Scale bar: 25 μm. (E) Co-expression of TUJ1 and the peptidergic nerve fibre marker TAC1. Scale bar: 25 μm. (F) TRPV1, a marker for nociceptors, is co-expressed with TUJ1. Scale bar: 25 μm. (G) qPCR analysis of total mRNA from iPSC-derived neurons confirmed the expression of genes associated with the sensory and nociceptive lineage. Data are represented as mean ± SD. For (G), pooled data from n = 2 clones/line, obtained from two individual differentiations each. For ISO-FD, pooled data from n = 1 clone from n = 2 individual differentiations. Each data point represents a biological replicate. BDNF, brain-derived neurotrophic factor; Ctrl, control; DAPI, 4′;6-diamidino-2-phenylindole; FD-1, FD-2, FD-3, patients with Fabry disease; FdU, floxuridine; GDNF, glial cell-derived neurotrophic factor; ISL1, islet-1; ISO-FD, isogenic Fabry line; Nav1.8, voltage-gated sodium channel 1.8; NGFb, nerve growth factor, beta subunit; PRPH, peripherin; TAC1, tachykinin precursor 1; TRKA, tropomyosin receptor kinase A; TRPV1, transient receptor potential vanilloid type 1; TUJ1, βIII-tubulin.
Figure 3
Figure 3
AGAL incubation and in-depth analysis of Gb3 accumulations. (A) Lysosomes of expanded Ctrl-iPSC show no accumulations. Scale bar: 1 μm (expansion factor corrected). (B) Lysosomes of expanded FD-1 iPSC show prominent intra-lysosomal Gb3 accumulations. Scale bar: 1 μm (expansion factor corrected). (C) Lysosomes of expanded FD-2 iPSC show prominent intra-lysosomal Gb3 accumulations. Scale bar: 1 μm (expansion factor corrected). Nuclear orange (NucO) was used to visualize the nuclei; acquired with LSM700 (confocal). (D) Incubation with AGAL reduced Gb3 in FD-1 (untreated: n = 2 clones; Clone 1 = 457 cells, Clone 2 = 1050 cells; +AGAL: n = 2 clones; Clone 1 = 556 cells, Clone 2 = 1030 cells) and FD-2 (untreated: n = 2 clones; Clone 1 = 341 cells, Clone 2 = 300 cells; +AGAL: n = 2 clones; Clone 1 = 476 cells, Clone 2 = 150 cells) neurons. AGAL incubation decreased Gb3 deposits also in ISO-FD, although statistics did not reach significance (untreated: n = 1 clone, n = 628 cells; +AGAL: n = 1 clone, n = 610 cells). Ctrl neurons did not show any accumulations before (n = 1 clone, 150 cells) and after (n = 1 clone, 150 cells) AGAL incubation. Each data point represents the mean value of Gb3-positive neurons from one individual coverslip. Data are presented as mean ± SD. Coverslips from ≥3 independent differentiations were used for analysis. One-way ANOVA [F(7,45) = 34.42, P < 0.001] followed by Sidak’s multiple comparison correction. (E) No Gb3 depositions were detected in Ctrl neurons. Scale bar: 25 μm. (F)–(H) FD-1, FD-2 and ISO-FD-neurons showed massive Gb3 accumulations. Scale bars: 25 μm. (I) Super-resolution image of an expanded FD-1 neuron showing intra-lysosomal Gb3 accumulations. Scale bar: 5 μm (expansion factor corrected). (Ii) and (Iii) ROIs cropped from (I). Scale bars: 0.5 μm (expansion factor corrected). (J) Super-resolution image of an expanded FD-2 neuron showing intra-lysosomal Gb3 accumulations. Scale bar: 5 μm (expansion factor corrected). (Ji) and (Jii) ROIs cropped from (J). Scale bars: 0.5 μm (expansion factor corrected). AGAL, agalsidase-beta; Ctrl, control; DAPI, 4′,6-diamidino-2-phenylindole; FD-1, FD-2, patients with Fabry disease; Gb3, globotriaosylceramide; ISO-FD, isogenic Fabry line; LAMP1, lysosomal associated membrane protein 1; ROI, region of interest; NucO, nuclear orange; PRPH, peripherin; TUJ1, Class III beta-tubulin. *P < 0.05; **P < 0.01; ***P < 0.001. For expansion factors, see also Supplementary Figs 1 and 2.
Figure 4
Figure 4
Ion channel gene expression of sensory neurons. (A) Principle component analysis of voltage-gated ion channel array expression. (B) Heatmap of expressed (CtCTR < 33) genes from highest (low delta ct) to lowest (high delta ct) expression indicated as ΔCt. (C) Exemplary gene transcripts illustrating the inverse regulation between FD-1 versus FD-2 and ISO-FD and a subgroup of unanimously downregulated genes compared with Ctrl baseline. Each data point represents pooled cDNA from n = 2 clones/line, obtained from two individual differentiations each. For ISO-FD, cDNA from n = 1 clone from n = 2 individual differentiations was pooled. Ctrl, control; Ct, cycle threshold; FD-1, FD-2, patients with Fabry disease; ISO-FD, isogenic Fabry line; PCA, principal component analysis.
Figure 5
Figure 5
Electrophysiological characterization of sensory neurons. (A) No differences were found in action potential firing rates upon injection of 1×, 2×, 3× and 4× rheobase current between cell lines. Increased firing rates were observed at 39°C compared with RT at 2× and 3× rheobase for Ctrl (n = 2 clones; RT: Clone 1 = 7 cells, Clone 2 = 21 cells; 39°C: Clone 1 = 16 cells, Clone 2 = 4 cells), FD-1 (n = 2 clones; RT: Clone 1 = 11 cells, Clone 2 = 16 cells; 39°C: Clone 1 = 18 cells, Clone 2 = 5 cells) and ISO-FD (n = 1 clone; RT: 19 cells, 39°C: 26 cells) neurons. At 4× rheobase, all cell lines (FD-2: n = 2 clones; RT: Clone 1 = 5 cells, Clone 2 = 18 cells; 39°C: Clone 1 = 15 cells) showed increased firing rates at 39°C compared with RT. Data are represented as mean ± SEM. Two-way ANOVA [F(21, 513) = 12.43, P < 0.0001] followed by Sidak’s multiple comparison correction. (B) Half-width of action potentials was comparable between all cell lines at RT and 39°C. Reduced half-widths at 39°C for all cell lines compared with RT. Linear mixed-effects model analysis accounting for repeated measurements (different clones per cell line) followed by Bonferroni’s multiple comparison correction. Detailed test statistics are given in Supplementary Table 4. (C) Rising slope of action potentials was not different between the cell lines at RT and 39°C. Increased rising slopes at 39°C for all cell lines compared with RT. Linear mixed-effects model analysis accounting for repeated measurements (different clones per cell line) followed by Bonferroni’s multiple comparison correction. Detailed test statistics are given in Supplementary Table 5. (D) Neurons were stimulated with Gaussian white current in patch-clamp whole-cell recordings: voltage response (upper) and noisy stimulus (lower). Representative recording was shown. (E) STA illustrates mean current eliciting action potentials calculated via spike-triggered reverse correlation. Positive values indicate depolarizing current; t = 0 indicates the time of spiking. At RT, FD-1 neurons required a larger depolarizing STA compared with the other cell lines (Ei). At 39°C, both FD cell lines encoded larger depolarizations compared with Ctrl (Eii). Data are represented as mean ± SEM. (F) Stimulus selectivity for STAs shown in Ei and Eii measured in bits was comparable between the cell lines at RT but increased in FD-1 at 39°C. Large values indicate high selectivity for STA, i.e. the spike-triggering subspace defined by STA is very different from the overall Gaussian stimulus distribution. Rank-sum test. (G) History dependence of neuron populations, h(t), calculated via generalized linear model framework (see ‘Materials and methods’ section) showed a higher refractoriness of FD-1 compared with the other cell lines at RT (Gi), which largely disappeared at 39°C (Gii). Data are represented as mean ± SEM. (H) Steady-state inactivation curves of voltage-gated sodium channels at RT. ISO-FD neurons showed negative shift of inactivation compared with Ctrl. Data are represented as mean ± SEM. (I) Steady-state inactivation curves of voltage-gated sodium channels at 39°C. FD-2 and ISO-FD neurons displayed negative shift of inactivation compared with Ctrl. Data are represented as mean ± SEM. (J) V1/2 steady-state inactivation was comparable among Ctrl, FD-1, FD-2 and ISO-FD neurons at RT. However, at 39°C, V1/2 was decreased in ISO-FD, and FD-2 showed a trend towards decreased V1/2 compared with Ctrl and FD-1. One-way ANOVA [F(7, 183) = 6.68, P < 0.0001] followed by Sidak’s multiple comparison correction. (K) Steady-state activation curves of voltage-gated sodium channels at RT were comparable between the cell lines at RT. Data are represented as mean ± SEM. (L) Steady-state activation curves of voltage-gated sodium channels at 39°C displayed a negative shift of FD-2 and ISO-FD compared with Ctrl and FD-1. Data are represented as mean ± SEM. (M) V1/2 steady-state activation was comparable among Ctrl, FD-1, FD-2 and ISO-FD neurons at RT. At 39°C, V1/2 showed a trend towards decreased values for FD-2 and ISO-FD compared with Ctrl. One-way ANOVA [F(7, 184) = 3.64, P < 0.01] followed by Sidak’s multiple comparison correction. For (B, C, H–M): for Ctrl (n = 2 clones; RT: Clone 1 = 8 cells, Clone 2 = 21 cells; 39°C: Clone 1 = 16 cells, Clone 2 = 4 cells), FD-1 (n = 2 clones; RT: Clone 1 = 15 cells, Clone 2 = 16 cells; 39°C: Clone 1 = 18 cells, Clone 2 = 5 cells), FD-2 (n = 2 clones; RT: Clone 1 = 11 cells, Clone 2 = 18 cells; 39°C: Clone 1 = 15 cells) and ISO-FD (n = 1 clone; RT: 19 cells, 39°C: 26 cells) pooled data obtained from ≥3 individual differentiations were used. For (DG): group sizes for RT and (39°C) were n = 18 (7), 14 (9), 15 (3) and 13 (4) for Ctrl, FD-1, FD-2 and ISO-FD, respectively. Data were pooled from two clones per cell line (exc. ISO-FD). For (B, C, F, J and M): each data point represents measurement of one cell. Data are represented as box-and-whisker plots with dots as individual values. The box width indicates the first and third quartiles, the line indicates the median and the whiskers of the box plot indicate the smallest and largest values. Ctrl, control; FD-1, FD-2, patients with Fabry disease; ISO-FD, isogenic Fabry line. *P < 0.05; **P < 0.01; ***P < 0.001; ****P < 0.0001.
Figure 6
Figure 6
Sensory neuron heat stimulation and mitochondrial characteristics. (A) Exemplified micrographs from firing neurons at 37°C (upper row) and 39°C (lower row). Scale bars: 5 μm. (B) FD-1 and FD-2 neurons show higher activity at 37°C (FD-1: n = 1 clone, 179 neurites; FD-2: n = 1 clone, 30 neurites) and increased calcium signalling after incubation at 39°C (FD-1: n = 1 clone; 56 neurites; FD-2: n = 1 clone, 31 neurites), whereas the Ctrl did not show an increase upon heat (37°C: n = 1 clone, 63 neurites; 39°C: n = 1 clone, 103 neurites). Each data point shows activity of one neurite, and data are represented as mean ± SD. Kruskal–Wallis (χ2 = 181.1, P < 0.0001) followed by Dunn’s multiple comparison test. (C) FD-1 and FD-2 neurons show a generalized decrease in neurite diameter, and FD-1 shows further thinning upon heat stimulation. n = 1 clone (B). Each data point shows diameter of one neurite, and data are represented as mean ± SD. Kruskal–Wallis (χ2 = 173.1, P < 0.0001) followed by Dunn’s multiple comparison test. (D) Metabolic labelling with sphinganine in Ctrl neurons reveals mitochondrial fragmentation in the vicinity of accumulations. Scale bars: 2 μm. (E) In contrast, incubation of Ctrl neurons with BODIPY only shows normal mitochondrial morphology. Scale bars: 2 μm. (F) Still image of mitochondria tracking of FD-1 neurons. Scale bar: 25 μm. (G) Still image of mitochondria/sphinganine interaction. Scale bar: 5 μm. (H) Still image of potential mitochondrial block by sphinganine. Scale bar: 5 μm. (G) + (H) Cropped from (F). (I) FD-1 neurons show mitochondria with an increased form factor compared to all other cell lines. Kruskal–Wallis (χ2 = 36.8, P < 0.0001) followed by Dunn’s multiple comparison test. (J) FD-1 and FD-2 neuronal mitochondria show an increased aspect ratio compared with Ctrl. Aspect ratio of FD-1 neuronal mitochondria is increased compared with FD-2. Kruskal–Wallis (χ2 = 35.41, P < 0.0001) followed by Dunn’s multiple comparison test. For (I) + (J): pooled data from n = 2 clones/line, obtained from three individual differentiations each was used (20 photomicrographs per differentiation = 60 per clone were analysed). Data are represented as Tukey boxplot. (K) Comparison of OCR of Ctrl and FD neurons using Seahorse assay showed no difference in cellular metabolism. Two-way ANOVA [F(22, 165) = 12.43, P = 0.39] followed by Sidak’s multiple comparison correction. (L) ECAR was similar between neurons from Ctrl and neurons from FD patients. Two-way ANOVA [F(22, 165) = 1.52, P = 0.07] followed by Sidak’s multiple comparison correction. For (KL): each data point represents the mean ± SEM of three individual differentiations of n = 2 clones/line. (M) Seahorse assay showed no difference in ATP production. Kruskal–Wallis (χ2 = 6.75, P = 0.08) followed by Dunn’s multiple comparison test. (N) No differences in basal respiration. Kruskal–Wallis (χ2 = 7.4, P = 0.06) followed by Dunn’s multiple comparison test. (O) Reserve capacity was comparable between Ctrl and Fabry patients. Kruskal–Wallis (χ22 = 2.09, P = 0.55) followed by Dunn’s multiple comparison test. For (M–O): each data point (n = 6) represents measurement of one individual differentiation from one clone. Data are represented as Tukey boxplot. Seahorse assay was performed from three individual differentiations of n = 2 clones/line. Ctrl, control; FD-1, FD-2, patients with Fabry disease; ECAR, extracellular acidification rate; FCCP, carbonyl cyanide-p-trifluoromethoxyphenylhydrazone; ISO-FD, isogenic Fabry line; OCR, oxygen consumption rate. *P < 0.05; **P < 0.01; ***P < 0.001.

References

    1. Brady RO, Gal AE, Bradley RM, Martensson E, Warshaw AL, Laster L. Enzymatic defect in Fabry’s disease. Ceramidetrihexosidase deficiency. N Engl J Med. 1967;276(21):1163–1167. - PubMed
    1. Germain DP. Fabry disease. Orphanet J Rare Dis. 2010;5:30. - PMC - PubMed
    1. Schiffmann R. Fabry disease. Pharmacol Ther. 2009;122(1):65–77. - PubMed
    1. Üçeyler N, Ganendiran S, Kramer D, Sommer C. Characterization of pain in Fabry disease. Clin J Pain. 2014;30(10):915–920. - PubMed
    1. Ohshima T, Murray GJ, Swaim WD, et al. . α-Galactosidase A deficient mice: A model of Fabry disease. Proc Natl Acad Sci USA. 1997;94(6):2540–2544. - PMC - PubMed

LinkOut - more resources