Axon morphology and intrinsic cellular properties determine repetitive transcranial magnetic stimulation threshold for plasticity
- PMID: 38638302
- PMCID: PMC11025360
- DOI: 10.3389/fncel.2024.1374555
Axon morphology and intrinsic cellular properties determine repetitive transcranial magnetic stimulation threshold for plasticity
Abstract
Introduction: Repetitive transcranial magnetic stimulation (rTMS) is a widely used therapeutic tool in neurology and psychiatry, but its cellular and molecular mechanisms are not fully understood. Standardizing stimulus parameters, specifically electric field strength, is crucial in experimental and clinical settings. It enables meaningful comparisons across studies and facilitates the translation of findings into clinical practice. However, the impact of biophysical properties inherent to the stimulated neurons and networks on the outcome of rTMS protocols remains not well understood. Consequently, achieving standardization of biological effects across different brain regions and subjects poses a significant challenge.
Methods: This study compared the effects of 10 Hz repetitive magnetic stimulation (rMS) in entorhino-hippocampal tissue cultures from mice and rats, providing insights into the impact of the same stimulation protocol on similar neuronal networks under standardized conditions.
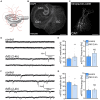
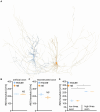
Results: We observed the previously described plastic changes in excitatory and inhibitory synaptic strength of CA1 pyramidal neurons in both mouse and rat tissue cultures, but a higher stimulation intensity was required for the induction of rMS-induced synaptic plasticity in rat tissue cultures. Through systematic comparison of neuronal structural and functional properties and computational modeling, we found that morphological parameters of CA1 pyramidal neurons alone are insufficient to explain the observed differences between the groups. Although morphologies of mouse and rat CA1 neurons showed no significant differences, simulations confirmed that axon morphologies significantly influence individual cell activation thresholds. Notably, differences in intrinsic cellular properties were sufficient to account for the 10% higher intensity required for the induction of synaptic plasticity in the rat tissue cultures.
Conclusion: These findings demonstrate the critical importance of axon morphology and intrinsic cellular properties in predicting the plasticity effects of rTMS, carrying valuable implications for the development of computer models aimed at predicting and standardizing the biological effects of rTMS.
Keywords: axons; excitation; inhibition; morphology; organotypic tissue cultures; synaptic plasticity; whole-cell patch-clamp recordings.
Copyright © 2024 Galanis, Neuhaus, Hananeia, Turi, Jedlicka and Vlachos.
Conflict of interest statement
The authors declare that the research was conducted in the absence of any commercial or financial relationships that could be construed as a potential conflict of interest. The author(s) declared that they were an editorial board member of Frontiers, at the time of submission. This had no impact on the peer review process and the final decision.
Figures


Update of
-
Axon morphology and intrinsic cellular properties determine repetitive transcranial magnetic stimulation threshold for plasticity.bioRxiv [Preprint]. 2023 Oct 26:2023.09.25.559399. doi: 10.1101/2023.09.25.559399. bioRxiv. 2023. Update in: Front Cell Neurosci. 2024 Apr 03;18:1374555. doi: 10.3389/fncel.2024.1374555. PMID: 37808716 Free PMC article. Updated. Preprint.
Similar articles
-
Axon morphology and intrinsic cellular properties determine repetitive transcranial magnetic stimulation threshold for plasticity.bioRxiv [Preprint]. 2023 Oct 26:2023.09.25.559399. doi: 10.1101/2023.09.25.559399. bioRxiv. 2023. Update in: Front Cell Neurosci. 2024 Apr 03;18:1374555. doi: 10.3389/fncel.2024.1374555. PMID: 37808716 Free PMC article. Updated. Preprint.
-
Repetitive magnetic stimulation induces functional and structural plasticity of excitatory postsynapses in mouse organotypic hippocampal slice cultures.J Neurosci. 2012 Nov 28;32(48):17514-23. doi: 10.1523/JNEUROSCI.0409-12.2012. J Neurosci. 2012. PMID: 23197741 Free PMC article.
-
Repetitive magnetic stimulation induces plasticity of excitatory postsynapses on proximal dendrites of cultured mouse CA1 pyramidal neurons.Brain Struct Funct. 2015 Nov;220(6):3323-37. doi: 10.1007/s00429-014-0859-9. Epub 2014 Aug 10. Brain Struct Funct. 2015. PMID: 25108309
-
Intrinsic Plasticity Mechanisms of Repetitive Transcranial Magnetic Stimulation.Neuroscientist. 2024 Apr;30(2):260-274. doi: 10.1177/10738584221118262. Epub 2022 Sep 5. Neuroscientist. 2024. PMID: 36059273 Free PMC article. Review.
-
Releasing the Cortical Brake by Non-Invasive Electromagnetic Stimulation? rTMS Induces LTD of GABAergic Neurotransmission.Front Neural Circuits. 2016 Nov 28;10:96. doi: 10.3389/fncir.2016.00096. eCollection 2016. Front Neural Circuits. 2016. PMID: 27965542 Free PMC article. Review.
Cited by
-
Statistical method accounts for microscopic electric field distortions around neurons when simulating activation thresholds.Brain Stimul. 2025 Mar-Apr;18(2):280-286. doi: 10.1016/j.brs.2025.02.007. Epub 2025 Feb 10. Brain Stimul. 2025. PMID: 39938863 Free PMC article.
-
Repetitive magnetic stimulation with iTBS600 induces persistent structural and functional plasticity in mouse organotypic slice cultures.bioRxiv [Preprint]. 2025 Feb 25:2025.02.23.639712. doi: 10.1101/2025.02.23.639712. bioRxiv. 2025. Update in: Brain Stimul. 2025 Jul 28;18(5):1392-1402. doi: 10.1016/j.brs.2025.07.008. PMID: 40060641 Free PMC article. Updated. Preprint.
-
Statistical method accounts for microscopic electric field distortions around neurons when simulating activation thresholds.bioRxiv [Preprint]. 2025 Feb 5:2024.10.25.619982. doi: 10.1101/2024.10.25.619982. bioRxiv. 2025. Update in: Brain Stimul. 2025 Mar-Apr;18(2):280-286. doi: 10.1016/j.brs.2025.02.007. PMID: 39484517 Free PMC article. Updated. Preprint.
References
Grants and funding
LinkOut - more resources
Full Text Sources
Miscellaneous

