. 2024 Apr 4:15:1356614.
doi: 10.3389/fneur.2024.1356614. eCollection 2024.

TMC function, dysfunction, and restoration in mouse vestibular organs

Affiliations

TMC function, dysfunction, and restoration in mouse vestibular organs

Evan M Ratzan et al. Front Neurol. .

Abstract

Tmc1 and Tmc2 are essential pore-forming subunits of mechanosensory transduction channels localized to the tips of stereovilli in auditory and vestibular hair cells of the inner ear. To investigate expression and function of Tmc1 and Tmc2 in vestibular organs, we used quantitative polymerase chain reaction (qPCR), fluorescence in situ hybridization - hairpin chain reaction (FISH-HCR), immunostaining, FM1-43 uptake and we measured vestibular evoked potentials (VsEPs) and vestibular ocular reflexes (VORs). We found that Tmc1 and Tmc2 showed dynamic developmental changes, differences in regional expression patterns, and overall expression levels which differed between the utricle and saccule. These underlying changes contributed to unanticipated phenotypic loss of VsEPs and VORs in Tmc1 KO mice. In contrast, Tmc2 KO mice retained VsEPs despite the loss of the calcium buffering protein calretinin, a characteristic biomarker of mature striolar calyx-only afferents. Lastly, we found that neonatal Tmc1 gene replacement therapy is sufficient to restore VsEP in Tmc1 KO mice for up to six months post-injection.

Keywords: TMC1; TMC2; hair cell; saccule; semicircular canal; utricle; vestibular.


Conflict of interest statement

The authors declare that the research was conducted in the absence of any commercial or financial relationships that could be construed as a potential conflict of interest.

Figures
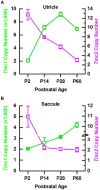
Figure 1
Figure 1
qPCR data indicate Tmc1 levels increase while Tmc2 levels decrease. (A) qPCR results for 10 utricles (B) and 10 saccules for each time point. Tmc1 is indicated by green circles corresponding to the left y-axis, and Tmc2 is indicated by magenta squares corresponding to the right y-axis. Data points represent mean ± SEM.
Figure 2
Figure 2
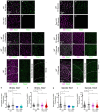
FISH-HCR analysis of Tmc1 and Tmc2 expression in vestibular maculas. (A,A′) Gfi1 and Tmc1 expression in wholemount P2 WT and (B,B′) Tmc1 KO utricles. (C,C′) Gfi1 and Tmc1 expression in WT P3 utricle extrastriolar and striolar regions. (D) Striolar domain of the utricle defined by Ocm (dashed lines) and hair cells by Gfi1. Tmc2 expression was seen throughout the sensory epithelia. (E) Quantification of Tmc1 expression normalized to Gfi1 in the extrastriolar versus striolar domain of utricle. (F) Quantification of normalized Tmc2 expression in the extrastriolar versus striolar domain of the utricle. (G,G′) Gfi1 and Tmc1 expression in wholemount P2 WT and (H,H′) Tmc1 KO saccules. (I,I′) Gfi1 and Tmc1 expression WT P3 saccule extrastriolar and striolar regions. (J) Striolar domain of the saccule defined by Ocm (dashed lines) and hair cells by Gfi1. Tmc2 expression was seen throughout the sensory epithelia. (K) Quantification of Tmc1 expression normalized to Gfi1 in the extrastriolar versus striolar domain of saccule. (L) Quantification of normalized Tmc2 expression in the extrastriolar versus striolar domain of the saccule. Individual data points and mean ± SEM are shown for panels E,F,K,L. Horizontal bars and stars (*) indicate statistical significance, p < 0.05. Scale bars = 10 μm in all images.
Figure 3
Figure 3
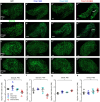
FM1-43 labeling of vestibular maculas from WT and Tmc mutant mice. (A–A‴) Saccules, (B–B‴) utricles, and (C–C‴) cristas collected from P60 mice IP-injected with 5 mg/kg of FM1-43/FX. Tissue was collected 24 h later, decalcified for 48 h, stained, and imaged. (D–D‴) P3 saccules labeled with bath-applied FM1-43 (not fixable). Scale bars = 100 μm.
Figure 4
Figure 4
Myosin 7a staining in vestibular maculas of WT and Tmc mutant mice. (A–A‴) Confocal images of P60 saccules labeled with Myo7a from genotypes indicated above. (B–B‴) P180 saccules labeled with Myo7a antibody except where absent (arrow). (C–C‴) P60 utricles labeled with Myo7a antibody (D–D‴). P180 utricles labeled with Myo7a antibody. (E) Quantification of Myo7a signal in P60 saccules across genotypes. (F) Quantification of Myo7a signal in P180 saccules across genotypes. (G) Quantification of Myo7a signal in P60 utricles. (H) Quantification of Myo7a signal in P180 utricles. Data points indicate number hair cells per tissue sample for each genotype with bars showing mean ± SEM in panels E–H. Horizontal bars and stars (*) indicate statistical significance, p < 0.05. Scale bars = 100 μm.
Figure 5
Figure 5
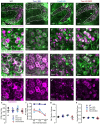
Immunostaining of P60 saccules from WT and Tmc mutant mice. (A–A‴) Saccular striola is defined by OCM labeling present in all genotypes (dashed lines) with higher magnification ROI indicated by square. (B–B‴) Type I striolar hair cells labeled by OCM (magenta) are contacted by calyxes labeled with βIII tubulin (green) in the striolar domain. (C–C‴) Calretinin expression labels striolar calyxes across all genotypes (magenta) and βIII tubulin expression labels calyxes across all genotypes (green). (D–D‴) Calretinin signal labels complex calyxes (magenta). (E) Quantification of total type I striolar hair cell numbers across genotypes at P60. (F) Quantification of the portion of striolar βIII tubulin(+) calyxes that also express calretinin across genotypes at P60. Horizontal bars and stars (*) indicate statistical significance, p < 0.05. (G) Quantification of the total number of βIII tubulin calyxes in the striola across genotypes at P60. (H) Quantification of striolar area based on OCM signal normalized to the total sensory domain labeled by phalloidin. Scale bars = 50 μm for A, and 10 μm for B–D. Data points indicate values for each genotype with bars showing mean ± SEM in panels E–H.
Figure 6
Figure 6
Immunostaining of P180 saccules from WT and Tmc mutant mice. (A–A‴) Saccule striola defined by OCM labeling present in all genotypes (dashed lines) with higher magnification ROI indicated by square. (B–B‴) Type I striolar hair cells are labeled by OCM (magenta) are contacted by calyxes labeled with βIII tubulin (green) in the striolar domain. (C–C‴) Calretinin expression labels striolar calyxes across all genotypes (magenta) and βIII tubulin expression labels calyxes across all genotypes (green). (D–D‴) Calretinin signal labels complex calyxes (magenta). (E) Quantification of total type I striolar hair cell numbers across genotypes at P180. (F) Quantification of the portion of striolar βIII tubulin(+) calyxes that also express calretinin across genotypes at P180. Stars (*) indicate statistical significance, p < 0.05. (G) Quantification of the total number of βIII tubulin calyxes in the striola across genotypes at P180. (H) Quantification of striolar area based on OCM signal normalized to the total sensory domain labeled by phalloidin. Scale bars = 50 μm for A, and 10 μm for B–D. Data points indicate values for each genotype with bars showing mean ± SEM in panels E–H.
Figure 7
Figure 7
Phenotypic characterization of WT and Tmc mutant mice. (A) Schematic of VsEP stimulation and acquisition, modified from (30). (B) Representative VsEP waveforms of WT (black), Tmc1 KO (blue), Tmc2 KO (light blue), and Tmc1/2 DKO (red) mice evoked by 1.6 dB re: 1 g/ms stimulation. Scale bars apply to all traces. (C) VsEP thresholds for individual mice (data points) and mean ± SEM values (bars). (D,E) Mean ± SEM rotational VOR (rVOR) response gains with and without visual stimulation in adult mice for each genotype with numbers mice tested indicated. (F) Mean ± SEM translational (tVOR) response gains in adult mice for each genotype.
Figure 8
Figure 8
Recovery of VsEP thresholds after gene replacement with AAV-Tmc1. (A) Utricle injection of AAV-GFP in the utricle (A) and saccule (A′). Scale bars = 50 μm. (B) FM1-43/FX uptake in the utricle (B) and saccule of a Tmc1 KO mouse (B′) following AAV-Tmc1 injection. Scale bars = 50 μm. (C) Representative VsEP traces evoked by −4.4 dB re: 1 g/ms stimulation and recorded from P60 mice for the genotypes and conditions indicated. Scale bars apply to all traces. (D) Mean ± SEM VsEP thresholds at P60 mice for the genotypes and conditions indicated. (E) VsEP thresholds from individual mice (WT, Tmc1 KO and AAV-Tmc1-injected) recorded at P60, P120, and P180.
Figure 9
Figure 9
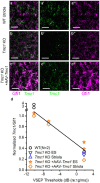
VsEP thresholds correlate with Tmc1 transcript levels. (A–A″) Wholemount FISH-HCR of P60 WT mouse utricle, labeled with Gfi1 and Tmc1. (B–B″) Tmc1 KO and (C–C″) Tmc1 KO mice injected at P1 with AAV-CMV-Tmc1ex1-WPRE. Mice with variable VsEP recoveries were also examined with FISH-HCR. Scale bars = 10 μm. (D) Quantification of Tmc1 normalized to Gfi1 from individual mice revealed higher expression level in mice with lower VsEP thresholds in both striolar and extrastriolar domains. Data were fitted with a linear regression with a slope of −0.059 and R2 = 0.93.
Figure 10
Figure 10
Model of Tmc1-dependent VsEP generation in the mouse saccule. (A) WT saccules express Tmc2 (green) early during neonatal development, but it is no longer present in mature saccules. Tmc1 expression (magenta) increases with maturity and is sufficient to maintain VsEPs in adulthood. (B) In Tmc1 KO mice, Tmc2 expression is not sufficient to maintain adult VsEP signals. (C) In Tmc2 KO mice, remaining Tmc1 expression is sufficient to maintain adult VsEP responses.

References

    1. Koffler T, Ushakov K, Avraham KB. Genetics of hearing loss: syndromic. Otolaryngol Clin N Am. (2015) 48:1041–61. doi: 10.1016/j.otc.2015.07.007, PMID: - DOI - PMC - PubMed
    1. World Health Organization (2020). Deafness and hearing loss. Available at: https://www.who.int/news-room/fact-sheets/detail/deafness-and-hearing-loss
    1. Shearer AE, Hildebrand MS, Schaefer AM, Smith RJH. Genetic hearing loss overview In: Adam MP, Mirzaa GM, Pagon RA, Wallace SE, Bean LJH, Gripp KW, et al., editors. GeneReviews®. Seattle, WA: University of Washington; (1993).
    1. Ward BK, Agrawal Y, Hoffman HJ, Carey JP, Della Santina CC. Prevalence and impact of bilateral vestibular hypofunction: results from the 2008 US National Health Interview Survey. JAMA Otolaryngol Head Neck Surg. (2013) 139:803–10. doi: 10.1001/jamaoto.2013.3913, PMID: - DOI - PMC - PubMed
    1. Kawashima Y, Geleoc GS, Kurima K, Labay V, Lelli A, Asai Y, et al. . Mechanotransduction in mouse inner ear hair cells requires transmembrane channel-like genes. J Clin Invest. (2011) 121:4796–809. doi: 10.1172/JCI60405, PMID: - DOI - PMC - PubMed