. 2024 Apr 3:15:1232070.
doi: 10.3389/fimmu.2024.1232070. eCollection 2024.

Diverse potential of secretome from natural killer cells and monocyte-derived macrophages in activating stellate cells

Affiliations

Diverse potential of secretome from natural killer cells and monocyte-derived macrophages in activating stellate cells

Julia Sauer et al. Front Immunol. .

Abstract

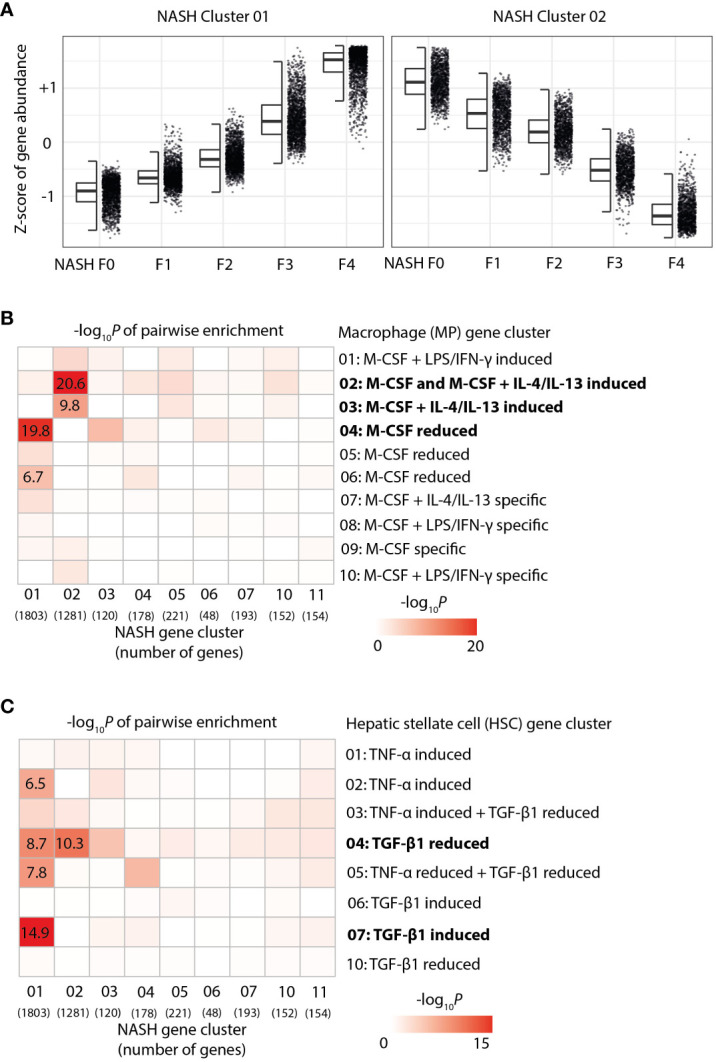
Chronic liver diseases, such as non-alcoholic steatohepatitis (NASH)-induced cirrhosis, are characterized by an increasing accumulation of stressed, damaged, or dying hepatocytes. Hepatocyte damage triggers the activation of resident immune cells, such as Kupffer cells (KC), as well as the recruitment of immune cells from the circulation toward areas of inflammation. After infiltration, monocytes differentiate into monocyte-derived macrophages (MoMF) which are functionally distinct from resident KC. We herein aim to compare the in vitro signatures of polarized macrophages and activated hepatic stellate cells (HSC) with ex vivo-derived disease signatures from human NASH. Furthermore, to shed more light on HSC activation and liver fibrosis progression, we investigate the effects of the secretome from primary human monocytes, macrophages, and NK cells on HSC activation. Interleukin (IL)-4 and IL-13 treatment induced transforming growth factor beta 1 (TGF-β1) secretion by macrophages. However, the supernatant transfer did not induce HSC activation. Interestingly, PMA-activated macrophages showed strong induction of the fibrosis response genes COL10A1 and CTGF, while the supernatant of IL-4/IL-13-treated monocytes induced the upregulation of COL3A1 in HSC. The supernatant of PMA-activated NK cells had the strongest effect on COL10A1 induction in HSC, while IL-15-stimulated NK cells reduced the expression of COL1A1 and CTGF. These data indicate that other factors, aside from the well-known cytokines and chemokines, might potentially be stronger contributors to the activation of HSCs and induction of a fibrotic response, indicating a more diverse and complex role of monocytes, macrophages, and NK cells in liver fibrosis progression.

Keywords: NASH - non-alcoholic steatohepatitis; NK cells; inflammation; liver fibrosis; monocyte-derived macrophage (MDM).


Conflict of interest statement

Author MM is employed by the company Ardigen. Authors JS, AS-K, SG, JR, SB, DB, TS, CL, VF, ES, OK, and EB are employed by the company Boehringer Ingelheim.

Figures

Figure 1
Figure 1
Transcriptome analysis of activated hepatic stellate cells (HSCs). (A) Volcano plot of differentially expressed genes in TNF-α-, TGF-β1-, and IL-13-activated HSC versus the untreated control. (B) Heat map of Z-score normalized gene expression after hierarchical clustering for gene clusters 01–07 and 10, as identified for control and IL-13-, TGF-β1-, and TNF-α-stimulated HSC. (C) Gene set enrichment analysis for the main gene clusters 01 to 07. The color code indicates the significance of the enrichment for the specified gene set in the corresponding cluster (adjusted p-value for multiple testing).
Figure 2
Figure 2
RNA sequencing analysis of macrophage activation patterns. (A) Volcano plot of differentially expressed genes in macrophage colony-stimulating factor 1 (M-CSF) and M-CSF with either IL-4/IL-13- or LPS/IFN-γ-activated MF versus untreated MoMF control. (B) Heat map of Z-score-normalized gene expression after hierarchical clustering for clusters 01 to 10. (C) Gene set enrichment analysis for the main gene clusters MF 01 to 07, 08, and 10. The color code indicates the significance of the enrichment for the specified gene set in the corresponding cluster (adjusted p-value for multiple testing).
Figure 3
Figure 3
Enrichment of hepatic stellate cells (HSC) and macrophage gene signatures in human non-alcoholic steatohepatitis (NASH) liver biopsies. (A) Z-score-normalized gene expression by fibrosis stage F0 to F4 in the two main gene clusters—identified by hierarchical clustering from the RNA-Seq of human NASH liver biopsies. (B) Pairwise enrichment of NASH gene cluster with gene clusters from the activated macrophages. the color code indicates -log10 p-value. (C) Pairwise enrichment of NASH gene cluster with gene clusters from activated HSC. the color code indicates -log10 p-value of the enrichment score.
Figure 4
Figure 4
Experimental design and quality controls of monocyte-derived macrophages (MoMF) experiments. (A) Schematic illustration of the experimental workflow for monocytes, MoMF, and NK cells. (B) Enrichment of CD14+ monocytes by magnetic-activated cell sorting (MACS) determined by flow cytometry (FACS). Cell type proportions before (red) and after (blue) monocyte enrichment. (C) Cell surface markers, CD80 and CD260, measurement on M1- and M2-polarized MoMF. (D) qPCR quantification of cytokines/chemokines of M1–M2 MoMF. (E) macrophage colony-stimulating factor 1 (M-CSF)-differentiated macrophage-secreted IL-6, IL-8, TNF-α, and TGF-β1 as quantified by MSD-ELISA. One-way ANOVA with Benjamini–Krieger correction; *p < 0.05, **p < 0.01, ***p < 0.001, ****p < 0.0001.
Figure 5
Figure 5
Limited fibrotic capacity of macrophage colony-stimulating factor 1 (M-CSF)-dependent macrophages. (A) Myofibroblast (MFB) activation after macrophage supernatant transfer as quantified by qPCR. (B, C) Bar plots presenting scratch assay and proliferation experiment. (B) The supernatant from stimulated monocyte-derived macrophages (MoMF) cells [from four independent peripheral blood mononuclear cells (PBMCs)] was used to activate hepatic stellate cells (HSCs) in the scratch assay. The area under the curve for all the stimulation conditions was calculated and used for the statistics. (C) The proliferation of HSCs following supernatant transfer assay (from three independent PBMCs) was qualified in the BrdU incorporation experiment in four independent HSCs. All data are displayed as mean ± SEM, n ≥ 8; data from three individual experiments. One-way ANOVA with Benjamini–Krieger correction; *p < 0.05, ***p < 0.001, ****p < 0.0001.
Figure 6
Figure 6
Limited fibrotic capacity of CD14+ monocytes. (A) IL-6, IL-8, TNF-α, and TGF-β1 secretion from CD14+ monocytes stimulated with IL-4, IL-13, TNF-α, or phorbol 12-myristate 13-acetate (PMA) as quantified by MSD-ELISA. (B) Myofibroblast (MFB) activation after monocyte supernatant transfer as measured by qPCR. All data are displayed as mean ± SEM, n ≥ 8; data from three individual experiments. One-way ANOVA with Benjamini–Krieger correction; *p < 0.05, **p < 0.01, ***p < 0.001, ****p < 0.0001.
Figure 7
Figure 7
NK cell stimulation and activation. (A) Enrichment of CD56+ NK cells by magnetic-activated cell sorting (MACS) as quantified by flow cytometry (FACS). Normalized enrichment after MACS purification against the other cell type proportions before enrichment. (B) FACS plots of NK cell activation markers. The cell surface markers CD69 and NKp30 were stained and measured in NK cells stimulated with phorbol 12-myristate 13-acetate (PMA) or IL-2+IL-15. (C) Relative mRNA expression of NK cell activation markers. NK cells were stimulated for 6 h and used for the qPCR quantification of IL-1β, CD69, and NKp30. (D) CD56+ NK cells secreted IL-6, IL-8, TNF-α, TGF-β1, Granzyme A, and IFN-Υ as quantified by MSD-ELISA. One-way ANOVA with Benjamini–Krieger correction; *p < 0.05, **p < 0.01, ****p < 0.0001.
Figure 8
Figure 8
Variable response of NK cells to phorbol 12-myristate 13-acetate (PMA) hyperactivation. (A) Myofibroblast (MFB) activation after NK cell supernatant transfer as quantified by qPCR. COL1A1, COL3A1, COL10A1, CCL2, PDGFA, VEGFA, and CTGF were measured in NK cells stimulated with various stimuli. (B) Representative microscopy pictures of the scratch assay in response to phosphate-buffered saline (PBS), phorbol 12-myristate 13-acetate (PMA), or PDGF at two time points. Scale bar: 400 µm. (C, D) Bar plots presenting the scratch assay and the proliferation experiment. (C) Supernatant from stimulated NK cells [from four independent peripheral blood mononuclear cells (PBMCs)] was used to activate hepatic stellate cells (HSCs) in the scratch assay. The area under the curve (AUC) for all the stimulation conditions was calculated and used for the statistics. (D) The proliferation of HSCs following supernatant transfer assay (from three independent PBMCs) was qualified in the BrdU incorporation experiment in four independent HSCs. All data are displayed as mean ± SEM, n ≥ 8; data from three individual experiments. One-way ANOVA with Benjamini–Krieger correction; *p < 0.05, **p < 0.01, ***p < 0.001, ****p < 0.0001.
Figure 9
Figure 9
Ex vivo activation of murine hepatic stellate cells (HSCs) in precision-cut liver slices (PCLS). (A) Overview of tissue morphology in H&E (upper panel) and TUNEL expression (lower panel) in three independent PCLS. Bar scales: 250 µm in the left images and 100 µm in the right images. (B) Viability and total protein content of PCLS comparing day 0 (d0) to various treatments in day 1 (d1). (C) HSC activation markers were quantified following cytokine and phorbol 12-myristate 13-acetate (PMA) stimulation in three independent PCLS. One-way ANOVA with Benjamini–Krieger correction; *p < 0.05, **p < 0.01, ***p < 0.001, ****p < 0.0001.

References

    1. Parthasarathy G, Revelo X, Malhi H. Pathogenesis of nonalcoholic steatohepatitis: an overview. Hepatol Commun. (2020) 4:478–92. doi: 10.1002/hep4.1479 - DOI - PMC - PubMed
    1. Kisseleva T, Brenner D. Molecular and cellular mechanisms of liver fibrosis and its regression. Nat Rev Gastroentero. (2021) 18:151–66. doi: 10.1038/s41575-020-00372-7 - DOI - PubMed
    1. Guillot A, Tacke F. Liver macrophages: old dogmas and new insights. Hepatol Commun. (2019) 3:730–43. doi: 10.1002/hep4.1356 - DOI - PMC - PubMed
    1. Huby T, Gautier EL. Immune cell-mediated features of non-alcoholic steatohepatitis. Nat Rev Immunol. (2021) 22:429–43. doi: 10.1038/s41577-021-00639-3 - DOI - PMC - PubMed
    1. Schwabe RF, Tabas I, Pajvani UB. Mechanisms of fibrosis development in NASH. Gastroenterology. (2020) 158:1913–28. doi: 10.1053/j.gastro.2019.11.311 - DOI - PMC - PubMed