. 2024 Apr 4:17:1359154.
doi: 10.3389/fnmol.2024.1359154. eCollection 2024.

Mutations in the postsynaptic density signaling hub TNIK disrupt PSD signaling in human models of neurodevelopmental disorders

Affiliations

Mutations in the postsynaptic density signaling hub TNIK disrupt PSD signaling in human models of neurodevelopmental disorders

Jianzhi Jiang et al. Front Mol Neurosci. .

Abstract

A large number of synaptic proteins have been recurrently associated with complex brain disorders. One of these proteins, the Traf and Nck interacting kinase (TNIK), is a postsynaptic density (PSD) signaling hub, with many variants reported in neurodevelopmental disorder (NDD) and psychiatric disease. While rodent models of TNIK dysfunction have abnormal spontaneous synaptic activity and cognitive impairment, the role of mutations found in patients with TNIK protein deficiency and TNIK protein kinase activity during early stages of neuronal and synapse development has not been characterized. Here, using hiPSC-derived excitatory neurons, we show that TNIK mutations dysregulate neuronal activity in human immature synapses. Moreover, the lack of TNIK protein kinase activity impairs MAPK signaling and protein phosphorylation in structural components of the PSD. We show that the TNIK interactome is enriched in NDD risk factors and TNIK lack of function disrupts signaling networks and protein interactors associated with NDD that only partially overlap to mature mouse synapses, suggesting a differential role of TNIK in immature synapsis in NDD.

Keywords: PSD signaling; glutamatergic neurons; induced pluripotent stem cell (iPSC); neurodevelopment; phosphoproteomics; proteomics.


Conflict of interest statement

The authors declare the research was conducted in the absence of any commercial or financial relationships that could be construed as a potential conflict of interest.

Figures
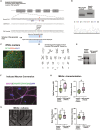
Figure 1
Figure 1
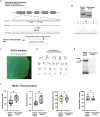
Generation and characterization of TNIK p.Arg180*(Patient) and the isogenic control: Corrected TNIK pArg180* (Patient) cell lines. (A) Diagram illustrating the generation of the novel isogenic control TNIK cell line derived from a patient carrying a homozygous p.Arg180* (R180X) truncation mutation. It was performed by CRSPR/Cas9 genome engineering, including guide RNA, ssDNA donor, and HDR (Top Panel). Schematic representation of the cell lines generated (Bottom Panel). (B) Agarose gels showing polymerase chain reaction followed by restriction enzyme digest screening for TNIK p.Arg180* (Patient) cell line and the isogenic control (Top panel). Sanger sequencing confirmation for the isogenic control cell line: Corrected patient missense mutation TNIKpArg180* (bottom panel). (C) Expression of pluripotent stem cell markers OCT4 and SSE4 in TNIK p.Arg180* (Patient) iPSCs. (D) Karyotyping of the isogenic control (corrected TNIK pArg180* Patient line) shows no gross abnormalities. (E) Western blot (WB) showing the homozygous TNIK p.Arg180* (Patient) truncation mutation generated a cell line with no detectable TNIK protein levels compared with its isogenic control. (F) Induced neuronal conversion of the TNIK p.Arg180* (Patient), and its correspondent isogenic control using Neurogenin-2 (NGN2) induction (iN). (G) Multi-electrode array (MEA) cultures of iPSC-derived neurons. (H) Recording of the electrical activity of iPSC-derived neurons using multi-electrode arrays (MEAs): TNIK cell line containing the patient-derived mutation TNIK pArg180* (Patient) shows increased spike frequency and number of bursts per second, compared with its isogenic control. Each data point represents a recording well. Detection thresholds were set to a fixed level of −25 μV. * p < 0.001.
Figure 2
Figure 2
Generation and characterization of the TNIK p.Arg180* (03231). (A) Diagram illustrating the generation of TNIK p.Arg180* cell line by CRISPR/Cas9 genome engineering in WT iPSCs 03231, including guide RNA, ssDNA donor, and HDR. (Top Panel). Schematic representation of the cell lines generated (Bottom Panel). (B) Agarose gels showing polymerase chain reaction followed by restriction enzyme digest screening for TNIK p.Arg180* (03231) cell line and the isogenic control (Top panel). Sanger sequencing confirmation of cell lines homozygous for TNIK p.Arg180* (03231; Bottom panel). (C) Expression of pluripotent stem cell markers OCT4 and SSE4 in the TNIK p.Arg180* (03231) iPSCs. (D) Karyotyping of TNIK p.Arg180* (03231) cell line shows no gross abnormalities. (E) Western blot (WB) showing the homozygous TNIK p.Arg180* (03231) truncation mutation generated a cell line with no detectable TNIK protein levels compared with its isogenic control. (F) Recording of the electrical activity of iPSC-derived neurons using multi-electrode arrays (MEAs): TNIK cell line containing the patient-derived mutation in the WT03231 background [TNIK pArg180* (03231)] shows increased spike frequency and number of bursts per second, compared with its isogenic control. Each data point represents a recording well. Detection thresholds were set to a fixed level of −25 μV. *p < 0.001.
Figure 3
Figure 3
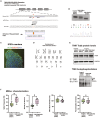
Generation and characterization of TNIK K54R kinase dead (KD; 03231) cell line. (A) Diagram illustrating the generation of TNIK K54R (KD) cell line by CRISPR/Cas9 genome engineering in WT 03231 iPSCs, including guide RNA, ssDNA donor, and HDR (Top Panel). Schematic representation of the cell lines generated (Bottom Panel). (B) Agarose gels showing polymerase chain reaction followed by restriction enzyme digest screening for TNIK K54R (KD; 03231; Top panel). Sanger sequencing confirmation of cell lines homozygous for TNIK K54R (KD; 03231; Bottom panel). (C) Expression of pluripotent stem cell markers OCT4 and SSE4 in TNIK K54R (KD; 03231) iPSCs. (D) Karyotyping of TNIK K54R (KD; 03231) cell line shows no gross abnormalities. (E) Top panel: Immunoprecipitation of TNIK followed by immunoblot using an antibody directed against TNIK shows normal expression of TNIK protein in TNIK K54R (KD; 03231) cell line compared to its isogenic control. Bottom panel shows immunoprecipitation of TNIK followed by immunoblot using an antibody against TNIK autophosphorylation site (T181). Representative WB shows that TNIK K54R (KD; 03231) has no protein kinase activity in hiPSC-derived neurons. (F) Recording of the electrical activity of iPSC-derived neurons using multi-electrode arrays (MEAs): TNIK K54R (KD; 03231) cell line shows the same phenotype as TNIK p.Arg180* (Patient) with increased spikes frequency and number of bursts per second. Each data point represents a recording well. Detection thresholds were set to a fixed level of −25 μV. *p < 0.001.
Figure 4
Figure 4
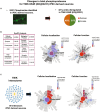
(A) Immunofluorescence for iN and results from mass spectrometry analysis of TNIK K54R (KD; 03231) and its isogenic control (03231) iN. Figure shows total numbers of phosphorylation sites identified in iN (9,301 phosphorylation sites) and number of phosphorylation sites showing decrease or increase in protein phosphorylation (dysregulated: 408 phosphorylation sites) in total lysates from TNIK K54R (KD; 03231) iN. (B) SynGO analysis of dysregulated p-sites. Analysis shows that the lack of TNIK protein kinase activity dysregulates phosphorylation in proteins localized at the PSD (cellular localization) and proteins associated with the cytoskeletal organization of the PSD (cellular function). (C) TNIK interactome isolated from iN. Right panels show SynGO analysis of TNIK interactome with a significant enrichment in PSD proteins and structural components of the PSD. A total neuronal proteome of NGN2 iN was used as background control for SynGO analysis.
Figure 5
Figure 5
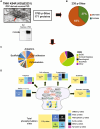
(A) Representative electron microscope picture of a synapse including the PSD region from iPSC-derived excitatory neurons. Lower panel: representative WB showing enrichment of the PSD marker PSD95 in PSD fractions when compared to soluble fractions from 21DIV iN. (B) Analysis of the phosphoproteome of TNIK K54R (KD; 03231) PSDs. Figure shows a higher percentage of dephosphorylated proteins at the PSD (63%). (C) Left pie chart shows protein function categories dysregulated by lack of TNIK protein kinase activity. Chart highlights the top four functional categories: cytoskeletal, adaptors, scaffold, and cell adhesion proteins. Right pie chart shows dysregulated proteins corresponding to genes included in Online Mendelian Inheritance in Man (OMIM) catalog with Mendelian mutations. Chart shows increased numbers of intellectual disability (ID), developmental delay (DD), and cortical dysplasia mutations in components of the PSD from TNIK K54R (KD; 03231) neurons. (D) Distribution of protein kinase families predicted to phosphorylate the total number of proteins (bottom) and each functional category (individual panels). Color code shows a large dysregulation of CMCG family of protein kinases across different functional categories together with individual patterns for each functional category. Panels show number of dysregulated phosphorylation sites and individual percentages for most abundant categories. Cartoon of the postsynaptic site shows protein kinases dysregulated in TNIK K54R (KD; 03231) PSDs. Color code shows in red protein kinases with decreased activity and in green protein kinases with increased activity. Protein kinases with dysregulated phosphorylation sites of unknown function are shown in black.
Figure 6
Figure 6
(A) Bar graph shows number of phosphorylation sites upregulated (green) and downregulated (red) in iN PSDs. Graph shows kinase families predicted to phosphorylate dysregulated sites. (B) Graph shows individual protein kinases predicting to phosphorylate upregulated and downregulated sites at the PSD of TNIK K54R (KD; 03231) neurons, with a larger number of p-sites corresponding to the MAPK family of protein kinases. (C) Representative WBs show decreased phosphorylation levels of the P38 family of protein kinases together with JNK1-3 and normal phosphorylation of ERK2 at the PSD of TNIK K54R (KD; 03231) neurons, suggesting a role in the decrease of phosphorylation sites corresponding to MAPK/CMCG kinases. Samples were processed in at least seven replicates per genotype corresponding to two different differentiations. Unpaired t-test p < 0.001.

References

    1. Anazi S., Shamseldin H. E., AlNaqeb D., Abouelhoda M., Monies D., Salih M. A., et al. . (2016). A null mutation in TNIK defines a novel locus for intellectual disability. Hum. Genet. 135, 773–778. doi: 10.1007/s00439-016-1671-9, PMID: - DOI - PubMed
    1. Arons M. H., Thynne C. J., Grabrucker A. M., Li D., Schoen M., Cheyne J. E., et al. . (2012). Autism-associated mutations in ProSAP2/Shank3 impair synaptic transmission and neurexin-neuroligin-mediated transsynaptic signaling. J. Neurosci. 32, 14966–14978. doi: 10.1523/JNEUROSCI.2215-12.2012, PMID: - DOI - PMC - PubMed
    1. Burette A. C., Phend K. D., Burette S., Lin Q., Liang M., Foltz G., et al. . (2015). Organization of TNIK in dendritic spines. J. Comp. Neurol. 523, 1913–1924. doi: 10.1002/cne.23770, PMID: - DOI - PMC - PubMed
    1. Camargo L. M., Wang Q., Brandon N. J. (2008). What can we learn from the disrupted in schizophrenia 1 interactome: Lessons for target identification and disease biology? Novartis Found. Symp. 289, 208–216. doi: 10.1002/9780470751251.ch17, PMID: - DOI - PubMed
    1. Carter J. L., Halmai J., Fink K. D. (2020). The iNs and outs of direct reprogramming to induced neurons. Front Genome Ed 2:7. doi: 10.3389/fgeed.2020.00007, PMID: - DOI - PMC - PubMed