. 2024 Nov;61(11):9383-9401.
doi: 10.1007/s12035-024-04129-0. Epub 2024 Apr 19.

NFATc4 Knockout Promotes Neuroprotection and Retinal Ganglion Cell Regeneration After Optic Nerve Injury

Affiliations

NFATc4 Knockout Promotes Neuroprotection and Retinal Ganglion Cell Regeneration After Optic Nerve Injury

Joanna Mackiewicz et al. Mol Neurobiol. 2024 Nov.

Abstract

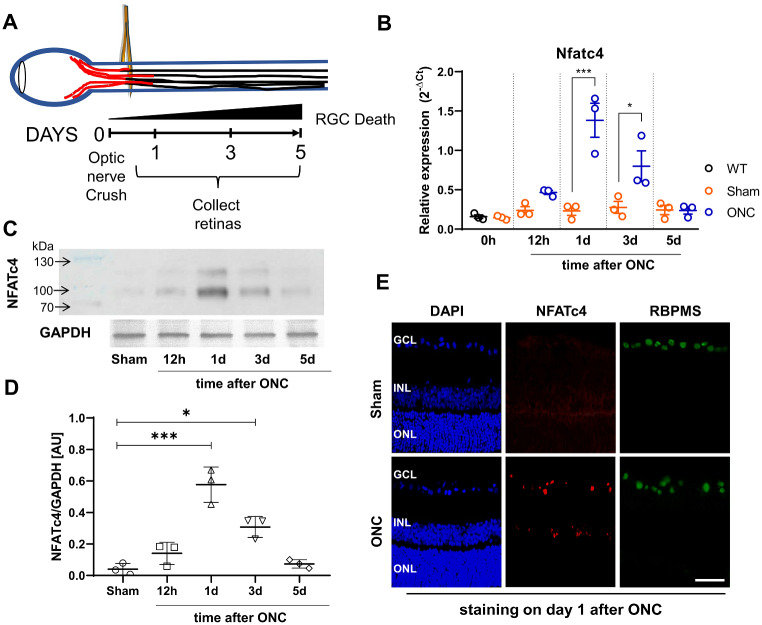
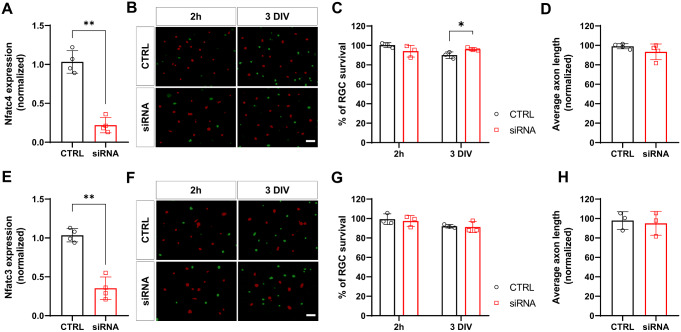
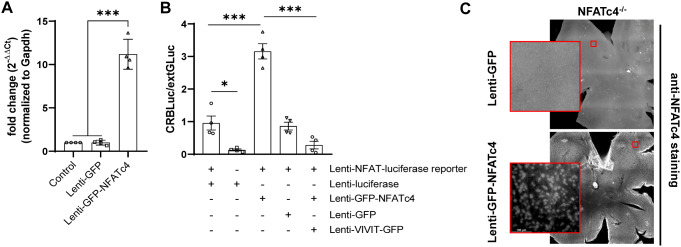
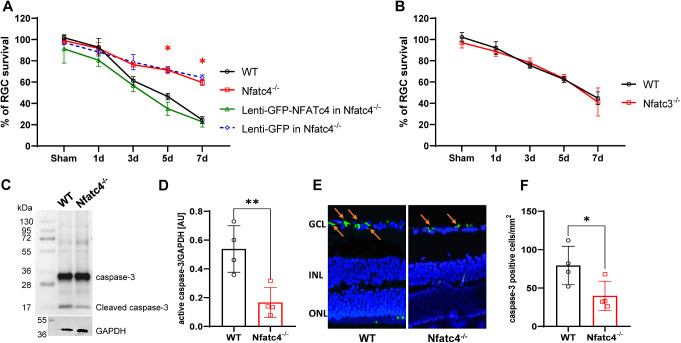
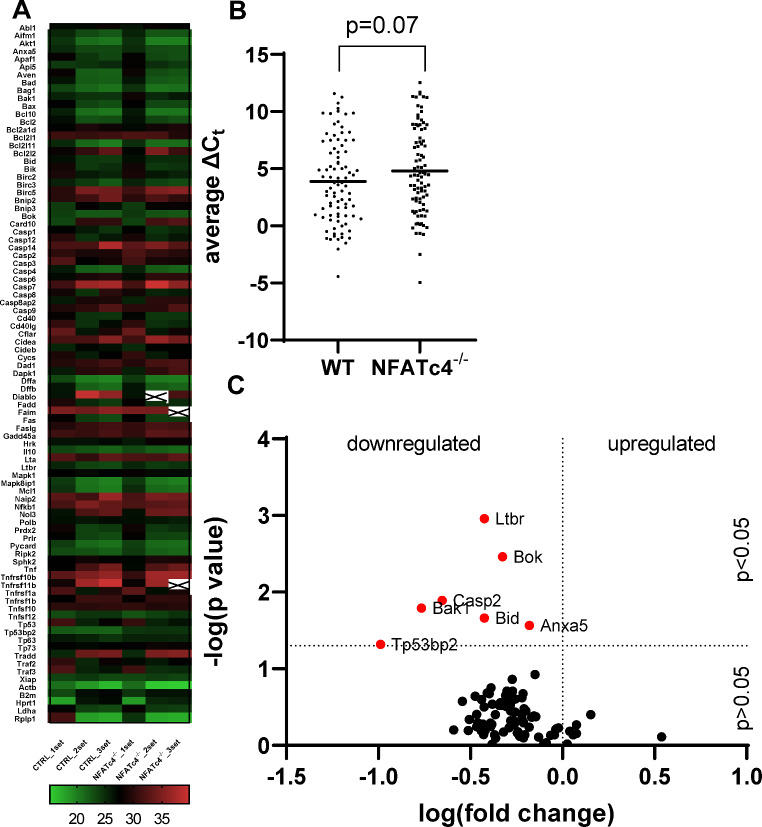
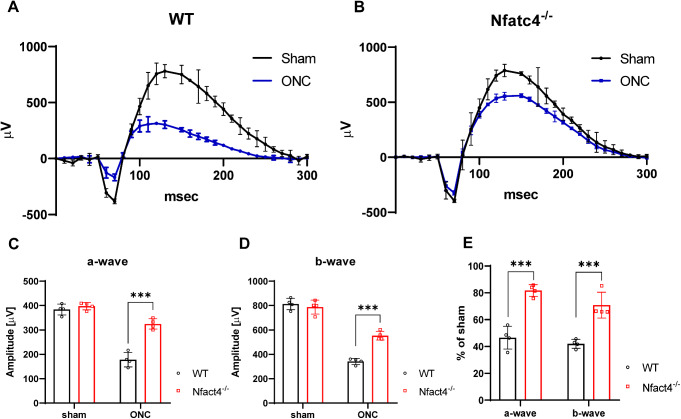
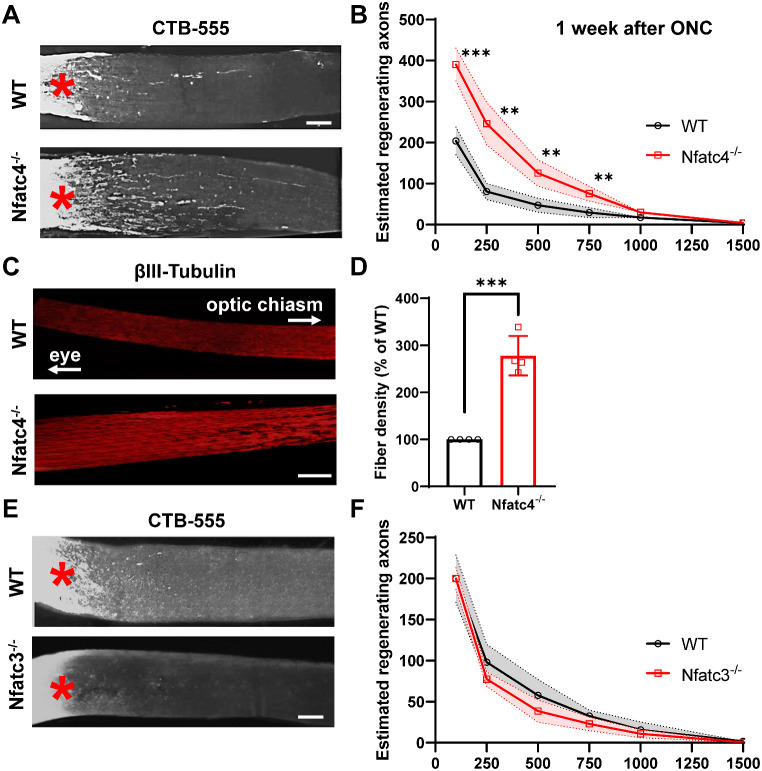
Retinal ganglion cells (RGCs), neurons transmitting visual information via the optic nerve, fail to regenerate their axons after injury. The progressive loss of RGC function underlies the pathophysiology of glaucoma and other optic neuropathies, often leading to irreversible blindness. Therefore, there is an urgent need to identify the regulators of RGC survival and the regenerative program. In this study, we investigated the role of the family of transcription factors known as nuclear factor of activated T cells (NFAT), which are expressed in the retina; however, their role in RGC survival after injury is unknown. Using the optic nerve crush (ONC) model, widely employed to study optic neuropathies and central nervous system axon injury, we found that NFATc4 is specifically but transiently up-regulated in response to mechanical injury. In the injured retina, NFATc4 immunolocalized primarily to the ganglionic cell layer. Utilizing NFATc4-/- and NFATc3-/- mice, we demonstrated that NFATc4, but not NFATc3, knockout increased RGC survival, improved retina function, and delayed axonal degeneration. Microarray screening data, along with decreased immunostaining of cleaved caspase-3, revealed that NFATc4 knockout was protective against ONC-induced degeneration by suppressing pro-apoptotic signaling. Finally, we used lentiviral-mediated NFATc4 delivery to the retina of NFATc4-/- mice and reversed the pro-survival effect of NFATc4 knockout, conclusively linking the enhanced survival of injured RGCs to NFATc4-dependent mechanisms. In summary, this study is the first to demonstrate that NFATc4 knockout may confer transient RGC neuroprotection and decelerate axonal degeneration after injury, providing a potent therapeutic strategy for optic neuropathies.

Keywords: Apoptotic gene expression; Intravitreal gene delivery; NFATc4 transcription factor; Optic nerve injury; Retinal ganglion cell survival.


Conflict of interest statement

The authors declare that the research was conducted in the absence of any commercial or financial relationships that could be construed as a potential conflict of interest.

Figures

Fig. 1
Fig. 1
The changes in NFATc4 in the adult retina following optic nerve crush (ONC). (A) Experimental design scheme. Retinas were collected at different time points (either 12 h, 1, 3 or 5 days) after ONC for subsequent experiments. (B) Changes in NFATc4 mRNA expression level measured by real-time PCR. Raw data were normalized to Gapdh expression, and the relative fold change was calculated using 2−ΔCt method, n = 3 at different time points after ONC. (C) Representative western blot for NFATc4 and quantification of protein expression after normalization to GAPDH protein level, n = 3 at different time points after ONC. Data are presented as means ± SEM with individual values indicated on graphs. * P < 0.05, ** P < 0.01, *** P < 0.001. (D) Quantification of NFATc4 protein level in Sham-operated or ONC retinas following normalization to endogenous GAPDH level, n = 3. AU – arbitrary units. (E) NFATc4 expression in sectioned adult retina following optic nerve injury. Representative micrographs of retina sections were evaluated for NFATc4 expression on day 1 after optic nerve crush. RBPMS was stained to visualize RGCs, and DAPI was used to locate ganglion cell layer (GCL), inner nuclear layer (INL), and outer nuclear layer (ONL). Strong immunoreactivity was present within the GCL. Scale bar: 50 μm
Fig. 2
Fig. 2
NFATc4 in RGC survival and axon elongation in vitro. (A) The efficiency of Nfatc4 silencing calculated using 2−ΔΔCt method relative to scrambled siRNA control. The data were normalized to the endogenous Gapdh expression level, n = 4. (B) Purified RGCs were electroporated with either NFATc4 siRNA or control and stained with Annexin V-FITC and Calcein Red to visualize apoptotic (green) and live (red) cells, respectively, at different time points. Scale bar: 100 μm. (C) RGC survival normalized to scrambled siRNA-treated RGCs for indicated time points. n = 3. (D) Average axon length of the Nfatc4 siRNA group at DIV3 normalized to control RGCs. n = 3. (E) The efficiency of Nfatc3 silencing calculated with 2−ΔΔCt method after normalization to Gapdh expression. The expression level in scrambled siRNA-transfected cells was taken as 1. n = 4. (F) Purified RGCs electroporated with either control or NFATc3 siRNA stained with Annexin V-FITC (green) and Calcein Red (red). Scale bar: 100 μm. (G) RGC survival following NFATc3 siRNA treatment normalized to scrambled siRNA control for respective time points. n = 3. (H) Average axon length of Nfatc3 siRNA-treated cells at DIV3 normalized to control RGCs. n = 3. The data are presented as means ± SEM. * P < 0.05, ** P < 0.01
Fig. 3
Fig. 3
NFATc4 expression and NFAT transcriptional activity following lentiviral transduction. (A) Nfatc4 mRNA expression was assessed in primary hippocampal neurons following transduction with either Lenti-GFP-NFATc4 or Lenti-GFP, using real-time PCR. Raw data were normalized to Gapdh endogenous expression and calculated using 2−ΔΔCt method. Nfatc4 expression level in non-transduced cells was set as 1. The data are presented as means ± SEM, with individual values obtained from n = 4 replicate treatment. (B) Primary hippocampal neurons were co-transduced with NFAT dual-reporter lentivirus and Lenti-GFP-NFATc4 (or other viruses as indicated on the graph) on DIV0 and cultured until DIV3. NFAT transcriptional activity was determined in cell lysates by measuring luciferase activity (n = 4). The results are expressed as a fold induction above baseline activity. The data are presented as means ± SEM, with individual values indicated on the graphs. * P < 0.05, *** P < 0.001. (C) Lenti-GFP or Lenti-GFP-NFATc4 were intravitreally injected into NFATc4−/− retinas, followed by NFATc4 staining three weeks later. The retinas were stained using the antibodies indicated in Retina cryosection staining (primary: NFATc4, 1:500, Merck, USA; secondary: anti-rabbit conjugated to Alexa Fluor 488, 1:500, Thermo Fisher, USA). Representative images are presented. Scale bar: 100 μm
Fig. 4
Fig. 4
Nfatc4−/− mice exhibit increased RGC survival after optic nerve injury. (A) The time course of RGC death after optic nerve injury in WT or Nfatc4−/− mice with or without intravitreal injection with Lenti-GFP-NFATc4 or Lenti-GFP control virus. All points are n = 4 animals per point, normalized to naïve WT eyes. (B) The time course of RGC death after ONC showing no difference between WT and Nfatc3−/− group, n = 4 animals per time point. RGC survival was normalized to WT naïve eyes. (C) Western blot analysis of caspase-3 and cleaved caspase-3 in a whole retina isolated on day 5 after ONC. GAPDH was used as a loading control. Representative blots are shown. (D) Quantification of cleaved caspase-3 protein level in WT or Nfatc4−/− retinas following normalization to endogenous GAPDH level, n = 4. AU – arbitrary units. (E) Representative micrographs showing active caspase-3 staining in retina cryosections done on day 5 following ONC. The arrows indicate puncta corresponding to cleaved caspase-3 located in the ganglion cell layer (GCL). (F) Bar charts showing the quantitative analyses of average cleaved caspase-3–positive cell counts in the retina (n = 4, two images per sample). The data on the graph are presented as means ± SEM. * P < 0.05, ** P < 0.01
Fig. 5
Fig. 5
NFATc4 knockout downregulates pro-apoptotic signaling pathways 5 days after ONC.(A) Heat map adjusted to reflect variations in individual genes for each run. The map was generated using GraphPad Prism based on the microarray data. (B) Dot plot comparison of average Ct values of screened genes. The average is presented as a black horizontal line. (C) The volcano plot showing whole retina gene expression in WT and NFATc4-/- mice following ONC. Genes (NFATc4-/- vs. WT) with P<0.05 and fold change less than -2 are highlighted in red. Indicates undetected gene expression. Indicates undetected gene expression
Fig. 6
Fig. 6
Effect of NFATc4 knockout on electroretinogram responses. (A) Representative ERG traces for wild-type mice recorded before and 5 days after ONC. (B) Representative ERG traces for Nfatc4−/− mice recorded before and 5 days after ONC. Each ERG was obtained by averaging two responses to 2.48 cd-s/m2 flashes with an interstimulus interval of 2 minutes. (C) Analysis of ERG a-wave amplitudes in WT and Nfatc4−/− mice before and 5 days after ONC. (D) Analysis of ERG b-wave amplitudes in WT and Nfatc4−/− mice before and 5 days after ONC. (E) Normalized a-wave and b-wave amplitudes 5 days after ONC. The data on the graph are presented as means ± SEM. *** P < 0.001, n = 4
Fig. 7
Fig. 7
Effect of NFATc4 knockout on axon regeneration after optic nerve crush (A) Representative images showing CTB-labelled regenerating axons in NFATc4−/− mice on day 7 after optic nerve crush. (B) Quantification of regenerating axons from the injury site, n = 6 per group. (C) βIII-tubulin staining showing delayed optic nerve degeneration in NFATc4−/− mice. (D) Quantification of fiber density, n = 4. (E) Representative images of regenerating axons in NFATc3−/− mice on day 7 post-crush. (F) Quantification of regenerating axons, n = 6 per group. Asterisks mark the crush site. The data on the graph are presented as means ± SEM. ** P < 0.01, *** P < 0.001. Scale bar: 250 μm

Similar articles

Cited by

References

    1. Hurley DJ, Normile C, Irnaten M, O’Brien C (2022) The Intertwined Roles of Oxidative Stress and Endoplasmic Reticulum Stress in Glaucoma, (in eng), Antioxidants (Basel) 11(5), Apr 29 10.3390/antiox11050886 - PMC - PubMed
    1. Rolle T, Ponzetto A, Malinverni L (2020) The Role of Neuroinflammation in Glaucoma: An Update on Molecular Mechanisms and New Therapeutic Options, (in eng), Front Neurol 11:612422, 10.3389/fneur.2020.612422 - PMC - PubMed
    1. Zhang ZQ, Xie Z, Chen SY, Zhang X (2023) Mitochondrial dysfunction in glaucomatous degeneration, (in eng). Int J Ophthalmol 16(5):811–823. 10.18240/ijo.2023.05.20 - PMC - PubMed
    1. Chidlow G, Wood JPM, Casson RJ (2017) Investigations into Hypoxia and oxidative stress at the Optic nerve head in a rat model of Glaucoma, (in eng). Front Neurosci 11:478. 10.3389/fnins.2017.00478 - PMC - PubMed
    1. Wang X et al (17, Aug 25 2023) The Association between Vascular Abnormalities and Glaucoma-what comes first? (in eng). Int J Mol Sci 24. 10.3390/ijms241713211 - PMC - PubMed

Substances