A Novel Machine Learning Algorithm for Creating Risk-Adjusted Payment Formulas
- PMID: 38639980
- PMCID: PMC11065160
- DOI: 10.1001/jamahealthforum.2024.0625
A Novel Machine Learning Algorithm for Creating Risk-Adjusted Payment Formulas
Abstract
Importance: Models predicting health care spending and other outcomes from administrative records are widely used to manage and pay for health care, despite well-documented deficiencies. New methods are needed that can incorporate more than 70 000 diagnoses without creating undesirable coding incentives.
Objective: To develop a machine learning (ML) algorithm, building on Diagnostic Item (DXI) categories and Diagnostic Cost Group (DCG) methods, that automates development of clinically credible and transparent predictive models for policymakers and clinicians.
Design, setting, and participants: DXIs were organized into disease hierarchies and assigned an Appropriateness to Include (ATI) score to reflect vagueness and gameability concerns. A novel automated DCG algorithm iteratively assigned DXIs in 1 or more disease hierarchies to DCGs, identifying sets of DXIs with the largest regression coefficient as dominant; presence of a previously identified dominating DXI removed lower-ranked ones before the next iteration. The Merative MarketScan Commercial Claims and Encounters Database for commercial health insurance enrollees 64 years and younger was used. Data from January 2016 through December 2018 were randomly split 90% to 10% for model development and validation, respectively. Deidentified claims and enrollment data were delivered by Merative the following November in each calendar year and analyzed from November 2020 to January 2024.
Main outcome and measures: Concurrent top-coded total health care cost. Model performance was assessed using validation sample weighted least-squares regression, mean absolute errors, and mean errors for rare and common diagnoses.
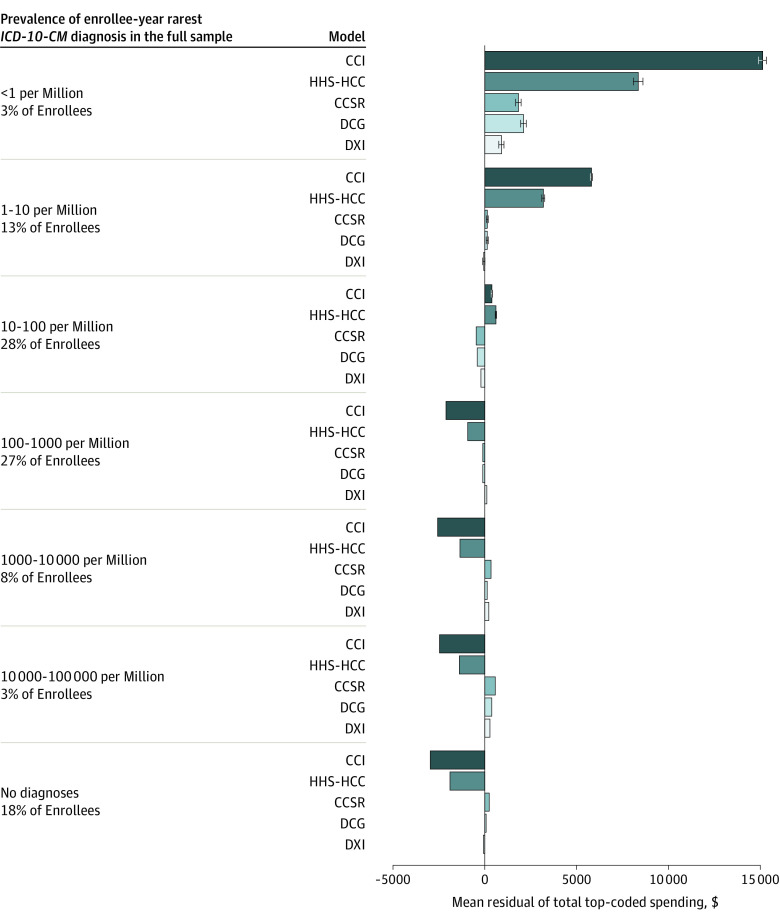
Results: This study included 35 245 586 commercial health insurance enrollees 64 years and younger (65 901 460 person-years) and relied on 19 clinicians who provided reviews in the base model. The algorithm implemented 218 clinician-specified hierarchies compared with the US Department of Health and Human Services (HHS) hierarchical condition category (HCC) model's 64 hierarchies. The base model that dropped vague and gameable DXIs reduced the number of parameters by 80% (1624 of 3150), achieved an R2 of 0.535, and kept mean predicted spending within 12% ($3843 of $31 313) of actual spending for the 3% of people with rare diseases. In contrast, the HHS HCC model had an R2 of 0.428 and underpaid this group by 33% ($10 354 of $31 313).
Conclusions and relevance: In this study, by automating DXI clustering within clinically specified hierarchies, this algorithm built clinically interpretable risk models in large datasets while addressing diagnostic vagueness and gameability concerns.
Conflict of interest statement
Figures


Similar articles
-
Development and Assessment of a New Framework for Disease Surveillance, Prediction, and Risk Adjustment: The Diagnostic Items Classification System.JAMA Health Forum. 2022 Mar 25;3(3):e220276. doi: 10.1001/jamahealthforum.2022.0276. eCollection 2022 Mar. JAMA Health Forum. 2022. PMID: 35977291 Free PMC article.
-
Plan Selection, Enrollee Risk, and Health Spending on the Patient Protection and Affordable Care Act Individual Marketplaces, 2019.JAMA Netw Open. 2023 Mar 1;6(3):e234529. doi: 10.1001/jamanetworkopen.2023.4529. JAMA Netw Open. 2023. PMID: 36995715 Free PMC article.
-
Diagnostic Category Prevalence in 3 Classification Systems Across the Transition to the International Classification of Diseases, Tenth Revision, Clinical Modification.JAMA Netw Open. 2020 Apr 1;3(4):e202280. doi: 10.1001/jamanetworkopen.2020.2280. JAMA Netw Open. 2020. PMID: 32267514 Free PMC article.
-
Mental Health Risk Adjustment with Clinical Categories and Machine Learning.Health Serv Res. 2018 Aug;53 Suppl 1(Suppl Suppl 1):3189-3206. doi: 10.1111/1475-6773.12818. Epub 2017 Dec 15. Health Serv Res. 2018. PMID: 29244202 Free PMC article.
-
Bundled Payment Models for Actinic Keratosis Management.JAMA Dermatol. 2016 Jul 1;152(7):789-97. doi: 10.1001/jamadermatol.2016.0502. JAMA Dermatol. 2016. PMID: 27028662
Cited by
-
Artificial Intelligence in Relation to Accurate Information and Tasks in Gynecologic Oncology and Clinical Medicine-Dunning-Kruger Effects and Ultracrepidarianism.Diagnostics (Basel). 2025 Mar 15;15(6):735. doi: 10.3390/diagnostics15060735. Diagnostics (Basel). 2025. PMID: 40150078 Free PMC article. Review.
-
Algorithms to Improve Fairness in Medicare Risk Adjustment.JAMA Health Forum. 2025 Aug 1;6(8):e252640. doi: 10.1001/jamahealthforum.2025.2640. JAMA Health Forum. 2025. PMID: 40880105 Free PMC article.
-
Algorithms to Improve Fairness in Medicare Risk Adjustment.medRxiv [Preprint]. 2025 Jan 27:2025.01.25.25321057. doi: 10.1101/2025.01.25.25321057. medRxiv. 2025. Update in: JAMA Health Forum. 2025 Aug 1;6(8):e252640. doi: 10.1001/jamahealthforum.2025.2640. PMID: 39974004 Free PMC article. Updated. Preprint.
References
-
- Pope GC, Ellis RP, Ash AS, et al. . Diagnostic Cost Group hierarchical condition category models for Medicare risk adjustment: Final Report. Accessed January 15, 2024. https://www.cms.gov/Research-Statistics-Data-and-Systems/Statistics-Tren...
-
- US Centers for Medicare & Medicaid Services . Patient protection and Affordable Care Act; HHS notice of benefit and payment parameters for 2018. Accessed January 15, 2024. https://www.gpo.gov/fdsys/pkg/FR-2016-09-06/pdf/2016-20896.pdf
MeSH terms
LinkOut - more resources
Full Text Sources
Medical