. 2024 Apr 19:12:RP88225.
doi: 10.7554/eLife.88225.

The CD4 transmembrane GGXXG and juxtamembrane (C/F)CV+C motifs mediate pMHCII-specific signaling independently of CD4-LCK interactions

Affiliations

The CD4 transmembrane GGXXG and juxtamembrane (C/F)CV+C motifs mediate pMHCII-specific signaling independently of CD4-LCK interactions

Mark S Lee et al. Elife. .

Abstract

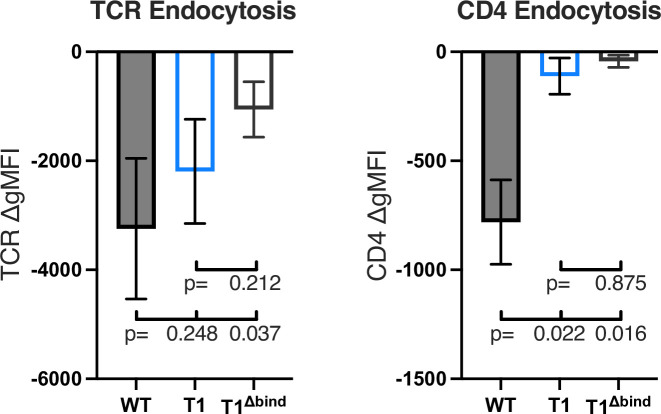
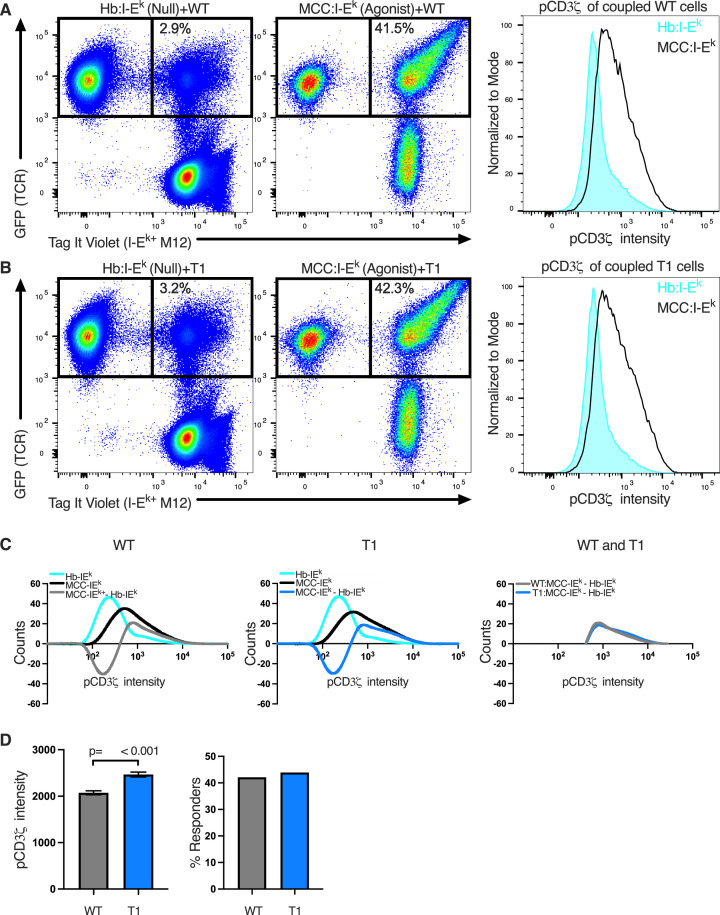
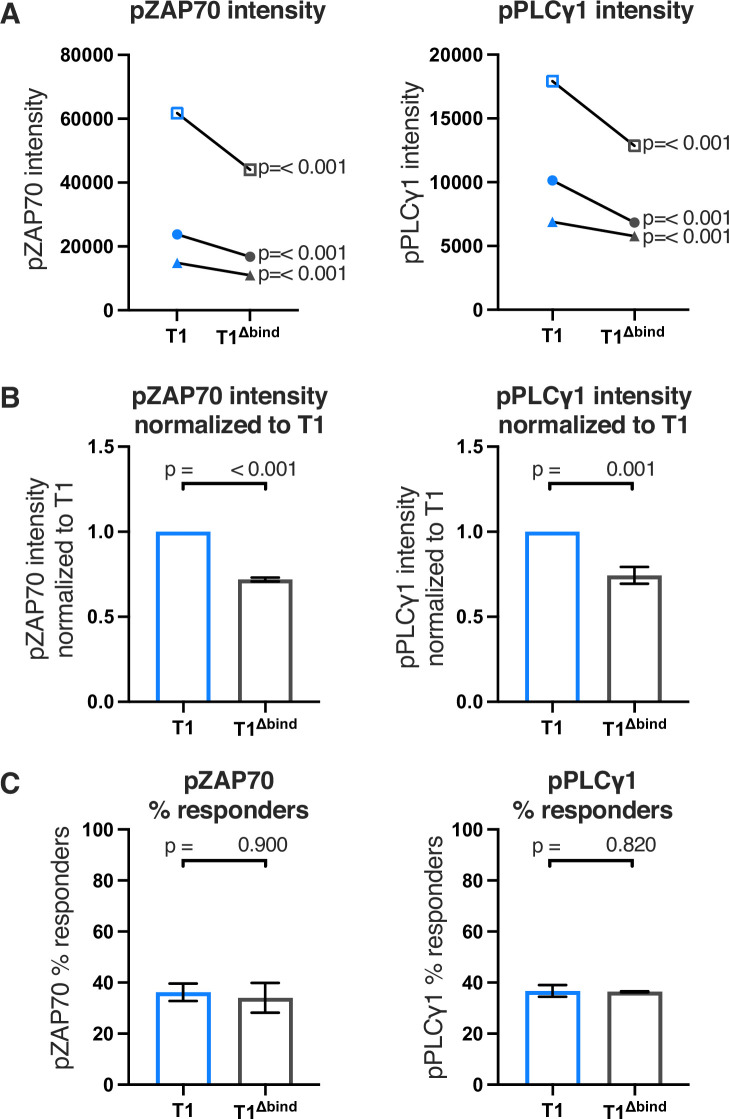
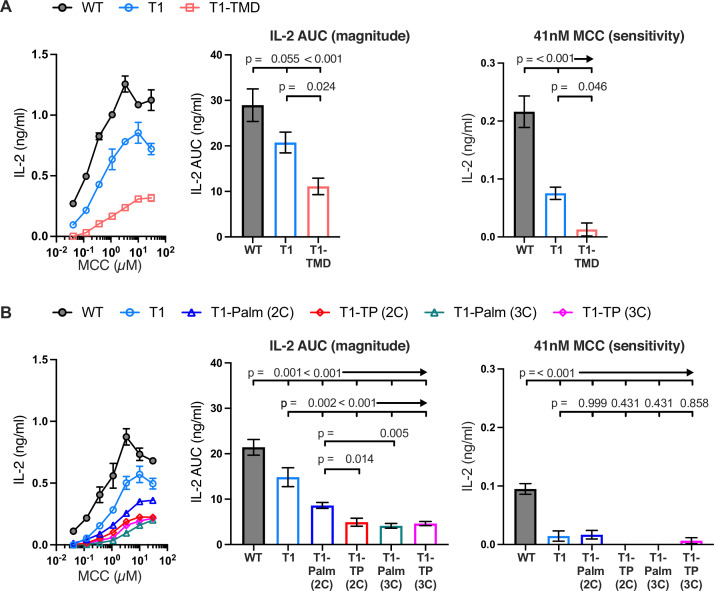
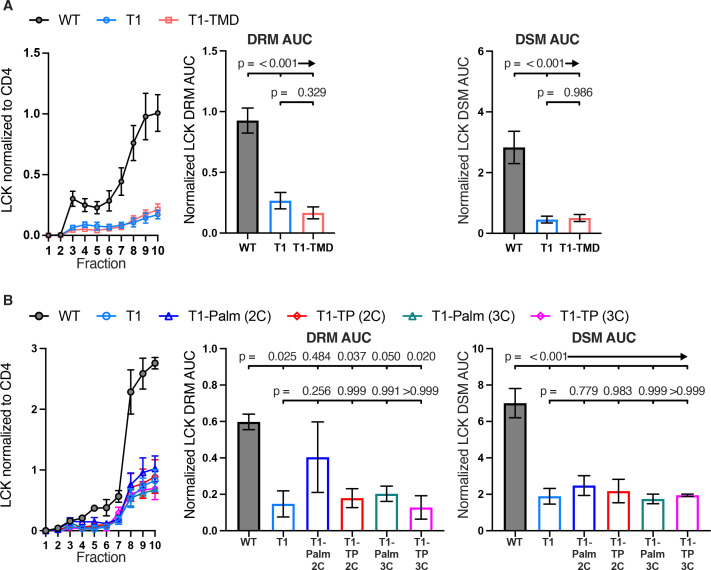
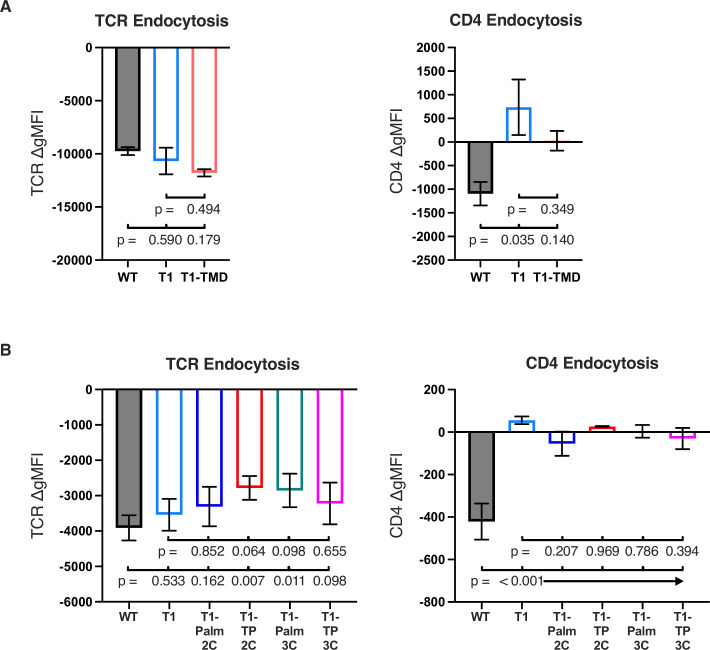
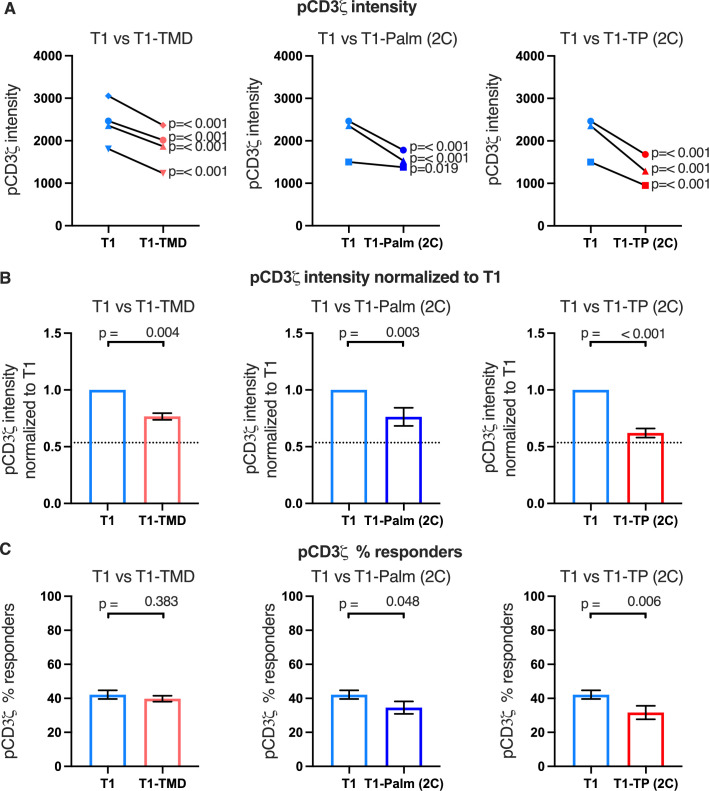
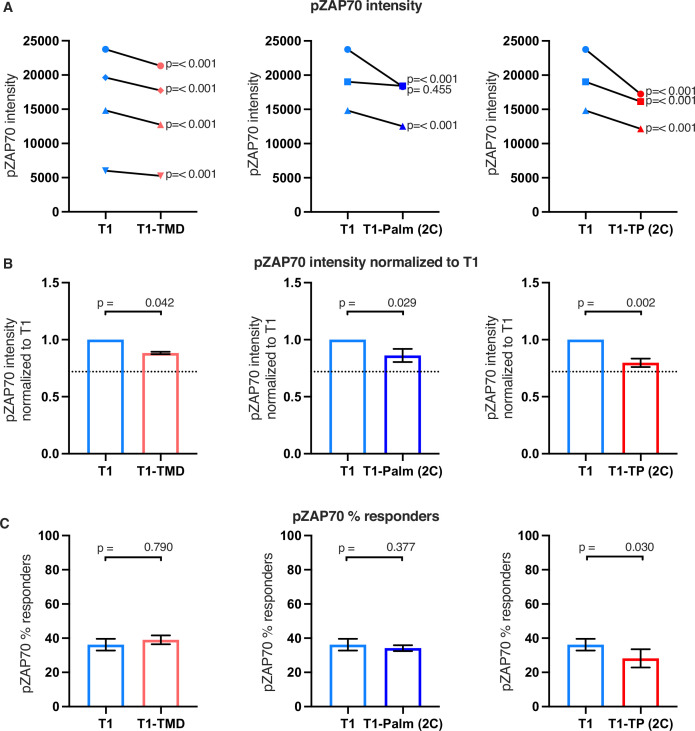
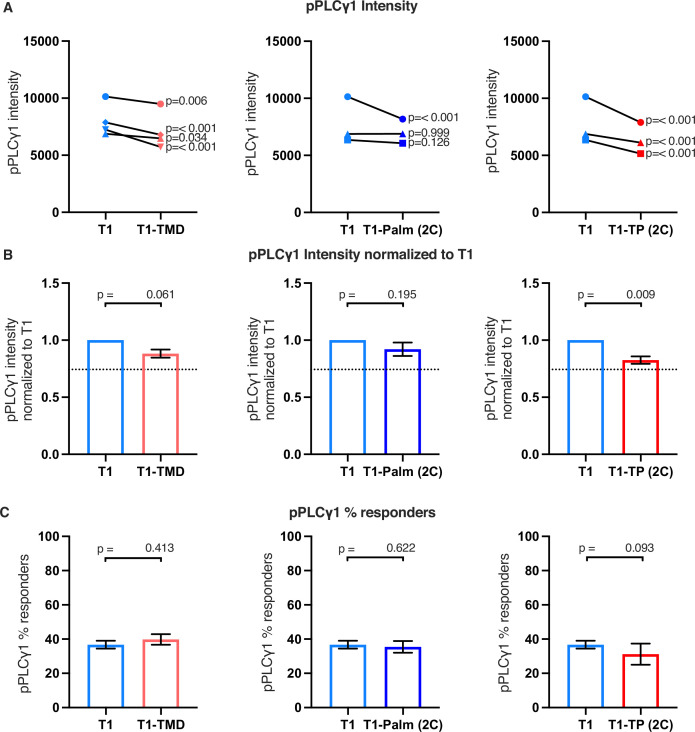
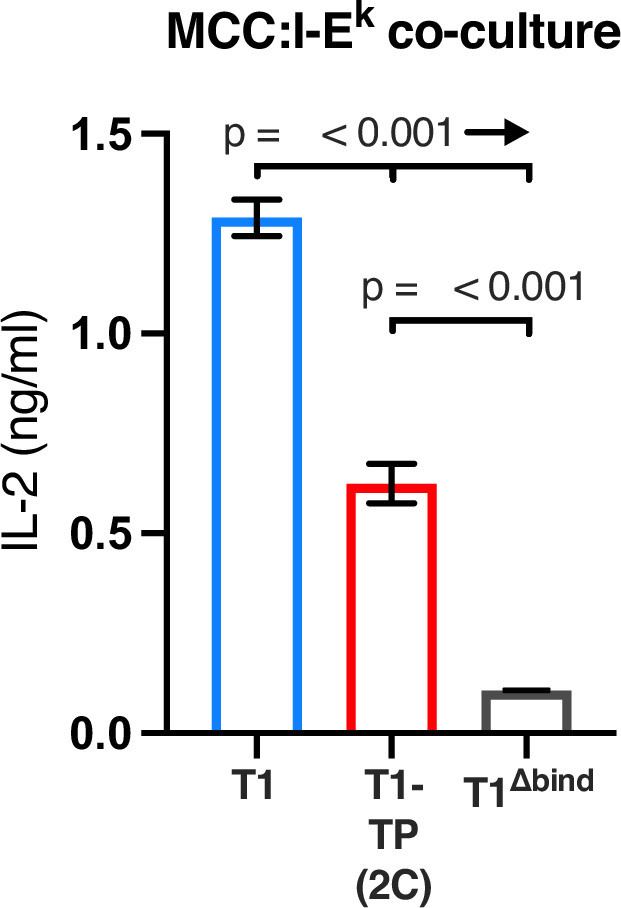
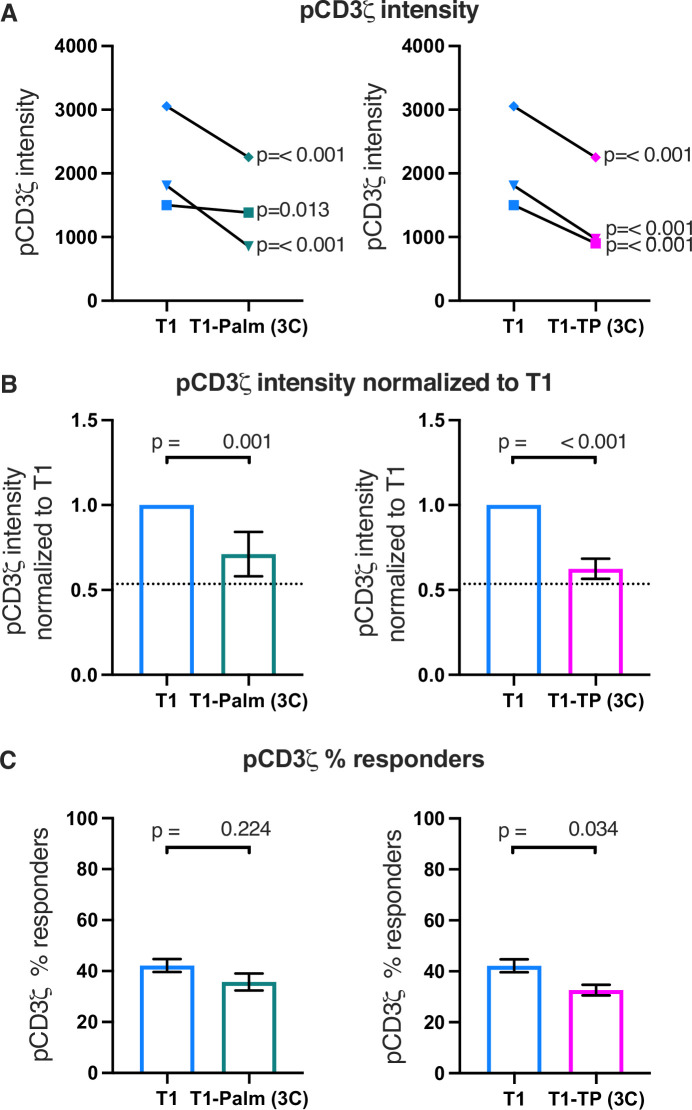
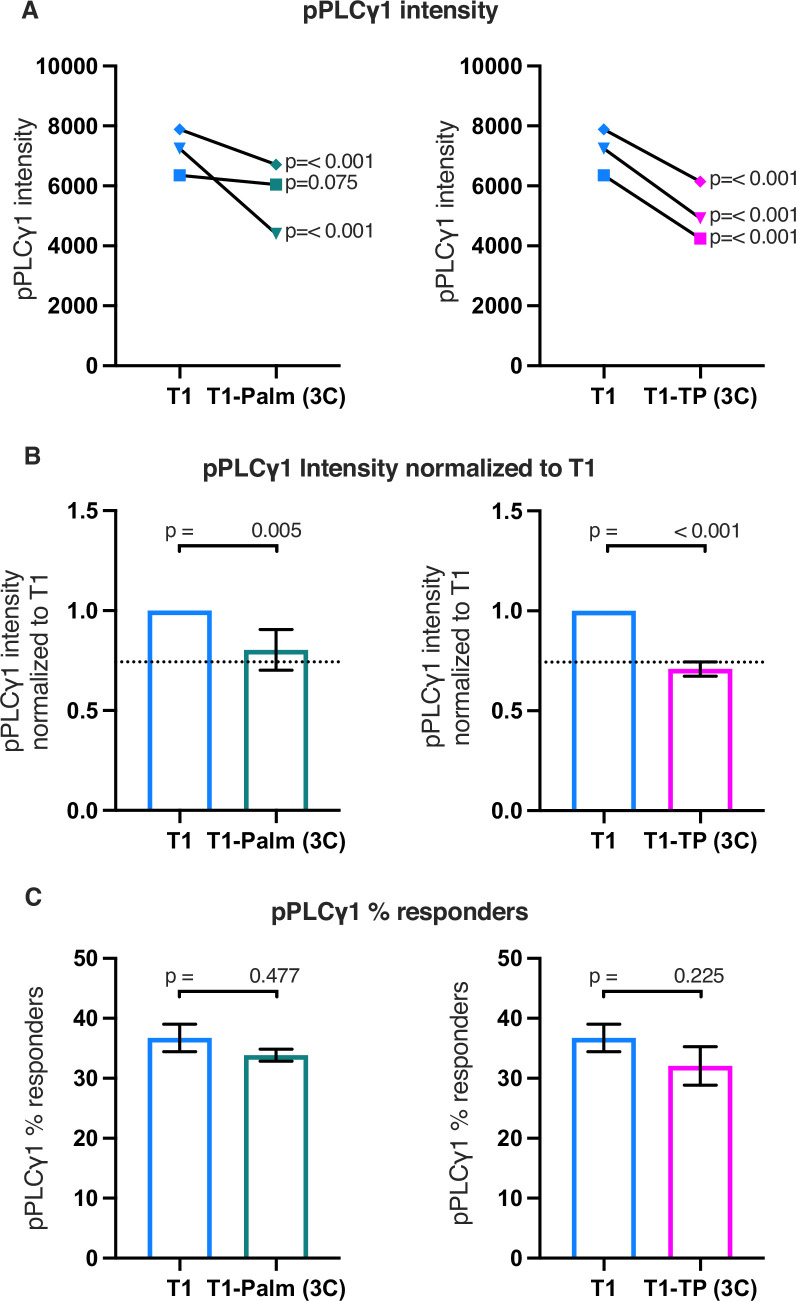
CD4+ T cell activation is driven by five-module receptor complexes. The T cell receptor (TCR) is the receptor module that binds composite surfaces of peptide antigens embedded within MHCII molecules (pMHCII). It associates with three signaling modules (CD3γε, CD3δε, and CD3ζζ) to form TCR-CD3 complexes. CD4 is the coreceptor module. It reciprocally associates with TCR-CD3-pMHCII assemblies on the outside of a CD4+ T cells and with the Src kinase, LCK, on the inside. Previously, we reported that the CD4 transmembrane GGXXG and cytoplasmic juxtamembrane (C/F)CV+C motifs found in eutherian (placental mammal) CD4 have constituent residues that evolved under purifying selection (Lee et al., 2022). Expressing mutants of these motifs together in T cell hybridomas increased CD4-LCK association but reduced CD3ζ, ZAP70, and PLCγ1 phosphorylation levels, as well as IL-2 production, in response to agonist pMHCII. Because these mutants preferentially localized CD4-LCK pairs to non-raft membrane fractions, one explanation for our results was that they impaired proximal signaling by sequestering LCK away from TCR-CD3. An alternative hypothesis is that the mutations directly impacted signaling because the motifs normally play an LCK-independent role in signaling. The goal of this study was to discriminate between these possibilities. Using T cell hybridomas, our results indicate that: intracellular CD4-LCK interactions are not necessary for pMHCII-specific signal initiation; the GGXXG and (C/F)CV+C motifs are key determinants of CD4-mediated pMHCII-specific signal amplification; the GGXXG and (C/F)CV+C motifs exert their functions independently of direct CD4-LCK association. These data provide a mechanistic explanation for why residues within these motifs are under purifying selection in jawed vertebrates. The results are also important to consider for biomimetic engineering of synthetic receptors.

Keywords: CD4; Lck; T cell; TCR-CD3; evolution; evolutionary biology; immunology; inflammation; mouse; pMHCII.


Conflict of interest statement

ML, PT, CK, PY, KL, HP, KV No competing interests declared, MK Has disclosed an outside interest in Module Therapeutics to the University of Arizona. Conflicts of interest resulting from this interest are being managed by the University of Arizona in accordance with their policies

Figures

Figure 1.
Figure 1.. Computational reconstruction of CD4 evolution.
The maximum likelihood phylogenetic tree clusters mammalian CD4 sequences. The tree highlights ancestral reconstructions of CD4 sequences from marsupials (kangaroo silhouette), Atlantogenata (elephant), and Boreoeutheria (wildcat). The logoplot of extant eutherian (Atlantogenata and Boreoeutheria) CD4 sequences show sequence conservation over evolutionary time. In these plots, the height of symbols indicates the relative frequency of each amino acid at that specific position. The mouse CD4 numbering (uniprot) is used as a reference, and residues are color-coded based on sidechain polarity. Evolutionary insertion or deletion events are indicated by dashes (-). Most recent common ancestor (MRCA) sequences are shown at each node in the tree (Nodes 1–4). As in our previous study (Lee et al., 2022), the ratio of synonymous (dS) and nonsynonymous (dN) substitution rates was calculated. Black dots indicate dN/dS ratios that are significantly below 1 across the entire dataset. Red dots indicate residues under purifying selection in the mammalian only dataset. Previously identified motifs are indicated by boxes, while the intracellular domain helix is shaded gray. The arrow at position 422 indicates where CD4 was truncated (CD4-T1), while TMD and T1-Palm show the mutations studied in this study.
Figure 2.
Figure 2.. Truncating CD4 does not reduce CD3ζ phosphorylation.
(A) Representative IL-2 production is shown in response to a titration of moth cytochrome c (MCC) peptide from one experiment (left). Experiments were performed in triplicate and each symbol equals the mean± SEM at that peptide concentration. Area under the curve (AUC) analysis for the dose response is shown as a measure of the response magnitude for the average of three independent experiments performed with one independently generated set of cell lines (center). The average response to a low dose (41 nM) of peptide is shown as a measure of sensitivity for three independent experiments performed with one independently generated set of cell lines (right). The data are representative of those obtained with four (WT vs T1) or two (WT vs T1Δbind) independently generated sets of cell lines. (B) Phosphorylation intensity of CD3ζ (pCD3ζ) for WT and CD4-T1 (T1) (left), normalized pCD3ζ intensity for WT and T1 (center), and average % responders of pCD3ζ for WT and T1 (right). Five independently generated cell lines (biological replicates) were tested for WT and T1. For phosphorylation intensity, each pair of lines (connected symbols) was tested in three independent experiments. Data were analyzed and collected as in Figure 2—figure supplement 3. One-way ANOVA was performed with a Dunnett’s post-test using GraphPad Prism 9. For normalized intensity, all individual mutant cell line values were normalized to their paired control values. Average % responders are presented. Bars represent the mean± SEM. One-way ANOVA with paired comparisons was performed with a Sidak’s post-test for specific comparisons of normalized values using GraphPad Prism 9. All generated cells lines were considered for the multiple comparisons. (C) Phosphorylation intensity of pCD3ζ for T1 and T1Δbind (left), normalized pCD3ζ intensity for T1 and T1Δbind (center), and % responders of pCD3ζ for T1 and T1Δbind (right) were performed and analyzed as in B, with the exception that the open symbols represent data from a single experiment whereas the closed symbols represent aggregate data from three independent experiments. Two-tailed t-tests were performed to compare the single T1 vs T1Δbind samples as no other samples were collected in parallel.
Figure 2—figure supplement 1.
Figure 2—figure supplement 1.. Flow cytometry analysis of CD4 (left) and T cell receptor (TCR) (right) expression on 58α-β- hybridoma cells.
Parental 58α-β- hybridoma cells served as negative control for surface expression (open black histogram trace).
Figure 2—figure supplement 2.
Figure 2—figure supplement 2.. T cell receptor (TCR) (left) and CD4 (right) endocytosis after pMHCII engagement is shown for the indicated cell lines after 16 hr coculture with antigen presenting cells (APCs) in the presence of 10 μM moth cytochrome c (MCC) peptide.
The change in TCR and CD4 gMFI, as measured by flow cytometry, is shown for each cell line relative to an equivalent sample cultured with APCs in the absence of MCC peptide. Each data point represents the mean± SEM for three independent experiments. For endocytosis, measurements were performed in triplicate for each experiment. One-way ANOVA was performed with a Dunnett’s post-test.
Figure 2—figure supplement 3.
Figure 2—figure supplement 3.. Example of intracellular signaling analysis workflow.
(A) Flow cytometry analysis of wildtype (WT) 58α-β- hybridoma:M12 cell couples. Representative dot plots are shown for TCRβGFP+ CD4+ 58α-β- hybridoma cells coupled to Tag-it Violet-labeled M12s expressing the indicated tethered null Hb:I-Ek (left) and agonist MCC:I-Ek pMCHII (center). Representative histograms of WT 58α-β- hybridoma cells coupled to M12 cells transduced to express the indicated tethered pMHCII are shown for pCD3ζ intensity (right). 10,000 coupled cells were collected per individual experiment. (B) Flow cytometry analysis of T1 58α-β- hybridoma-M12 cell couples. Representative dot plots are shown for TCRβGFP+ CD4+ 58α-β- hybridoma cells coupled to Tag-it Violet-labeled Hb:I-Ek+ (left) and MCC:I-Ek+ (center) M12 cells. Representative histograms of T1 58α-β- hybridoma cells coupled to M12 cells expressing the indicated tethered pMHCII are shown for pCD3ζ intensity (right). 10,000 coupled cells were collected per individual experiment. (C) A representative smoothed overlapping histogram of pCD3ζ intensity is shown for 58α-β- cells coupled to Hb:I-Ek+ (cyan) or MCC:I-Ek+ (black) M12 cells. Histogram of pCD3ζ intensity for 58α-β- cells coupled to MCC:I-Ek+ M12 cells subtracted from Hb:I-Ek+ M12 cell couples show the difference in pCD3ζ intensity on a bin-by-bin basis after stimulation with agonist MCC:I-Ek compared with null Hb:I-Ek for WT (left) and T1 (center) cells. Overlapping pCD3ζ histogram (right) of cells responding to MCC:I-Ek after Hb:I-Ek subtraction shows the responding populations for the WT and T1 cell lines. Data represent the aggregate from three individual experiments (30,000 couples analyzed). One-way ANOVA was performed with a Dunnett’s post-test for comparison with the WT sample because other mutants were simultaneously analyzed in this experiment (not shown). (D) Concatenated pCD3ζ average intensity± SEM of WT and T1 cells (left) and the percent of responding WT and T1 cells (right). MHC, moth cytochrome c.
Figure 2—figure supplement 4.
Figure 2—figure supplement 4.. Raw and normalized pZAP70 and pPLCγ1analyses for WT and T1 mutant.
(A) ZAP70 (left) and PLCγ1 (right) phosphorylation intensity for wildtype (WT) and T1 are shown for paired (connecting line) WT and T1 cell lines. Five independently generated cell lines were tested (biological replicates). For phosphorylation intensity, each pair of lines (connected symbols) was tested in three independent experiments (technical replicates). The data from those experiments was aggregated, and the symbols represent the mean intensity of the aggregated pCD3ζ intensity values. One-way ANOVA was performed with a Dunnett’s post-test. (B) Average T1 phosphorylation for ZAP70 (left) and PLCγ1 (right) from A are shown normalized to the paired WT controls. Bars represent the mean± SEM. One-way ANOVA was performed with a Sidak’s post-test for specific comparisons. (C) Average WT and T1 % responders for pZAP70 (left), and pPLCγ1 (right) are shown for the cell lines shown in A. Bars represent the mean± SEM. One-way ANOVA was performed with a Sidak’s post-test for specific comparisons.
Figure 2—figure supplement 5.
Figure 2—figure supplement 5.. Raw and normalized pZAP70 and pPLCγ1analyses for T1 and T1Δbind mutant.
(A) Phosphorylation intensity for T1 and T1Δbind ZAP70 (left), and PLCγ1 (right) are shown for paired (connecting line) T1 and T1Δbind cell lines. Three independently generated cell lines were tested (biological replicates). Analysis was performed as in Figure 2—figure supplement 4 with the exception that the open symbols represent data from a single experiment whereas the closed symbols represent the average of aggregated data from three independent experiments. For the open symbol comparisons we performed a two-tailed t-test as no other samples were collected in parallel. (B) Average T1Δbind cell line phosphorylation intensity for ZAP70 (left), and PLCγ1 (right) are shown normalized to the average intensity of the paired T1 control cells shown in A. Analysis was performed as in Figure 2—figure supplement 4. (C) Average T1 and T1Δbind cell line % responders for pZAP70 (left) and pPLCγ1 (right) are shown. Analysis was performed as in Figure 2—figure supplement 4.
Figure 3.
Figure 3.. The GGXXG and CV+C motifs are key determinants of CD4 function.
(A, B) Representative IL-2 production is shown in response to a titration of moth cytochrome c (MCC) peptide from one experiment (left). Experiments were performed in triplicate and each symbol equals the mean± SEM at that peptide concentration. Area under the curve (AUC) analysis for the dose response is shown as a measure of the response magnitude for the average of three independent experiments performed with one independently generated set of cell lines (center). The average response to a low dose (41 nM) of peptide is shown as a measure of sensitivity for three independent experiments performed with one independently generated set of cell lines (right). Results are representative of those obtained with at least three independently generated sets of cell lines. One-way ANOVA was performed with a Dunnett’s post-test for comparisons with wildtype (WT) and T1 samples, and a Sidak’s post-test for comparisons between selected samples.
Figure 3—figure supplement 1.
Figure 3—figure supplement 1.. Flow cytometry measurements of CD4 and TCR surface expression.
(A, B) Flow cytometry analysis of CD4 (left) and T cell receptor (TCR) (right) expression on 58α-β- hybridoma cells. Parental 58α-β- hybridoma cells served as negative control for surface expression (open black histogram trace).
Figure 3—figure supplement 2.
Figure 3—figure supplement 2.. Sucrose gradient analysis of CD4-Lck association.
(A, B) LCK signal is shown for each sucrose fraction normalized to the CD4 signal detected in the corresponding fraction (left). The area under the curve (AUC) is shown for the normalized LCK signal in the detergent resistant membrane (DRM) (center) and detergent soluble membrane (DSM) (right) fractions. Each data point represents the mean± SEM for three independent experiments with the same cell line. Data are representative of experiments performed with three independently generated sets of lines for TMD, Palm(3C), and TP(3C) mutants. Analysis was performed with two set of lines for the Palm(2C) and TP(2C) mutants. One-way ANOVA was performed with a Dunnett’s post-test for comparisons with WT and T1 samples, and a Sidak’s post-test for comparisons between selected samples.
Figure 3—figure supplement 3.
Figure 3—figure supplement 3.. Total Lck associated with Lck (DRMs + DSMs).
(A, B) Total LCK signal (total area under the curve [AUC] for sucrose gradient) normalized to CD4 signal is shown for the indicated cell lines. Each data point represents the mean± SEM for three independent experiments with the same cell line (experimental replicates). Data are representative of experiments performed with three independently generated sets of lines for TMD, Palm(3C), and TP(3C) mutants (biological replicates). Analysis was performed with two set of lines for the Palm(2C) and TP(2C) mutants. One-way ANOVA was performed with a Dunnett’s post-test for comparisons with wildtype (WT) and T1 samples, and a Sidak’s post-test for comparisons between selected samples.
Figure 3—figure supplement 4.
Figure 3—figure supplement 4.. Activation induced TCR and CD4 endocytosis.
(A, B) T cell receptor (TCR) (left) and CD4 (right) endocytosis after pMHCII engagement is shown for the indicated cell lines after 16 hr coculture with antigen presenting cells (APCs) in the presence of 10 μM moth cytochrome c (MCC) peptide. The change in TCR and CD4 gMFI, as measured by flow cytometry, is shown for each cell line relative to an equivalent sample cultured with APCs in the absence of MCC peptide. Each data point represents the mean± SEM for three independent experiments (experimental replicates). Data are representative of those acquired with at least two independently generated sets of cell lines (biological replicates). Endocytosis measurements were performed in triplicate (technical replicates) for each experiment. One-way ANOVA was performed with a Dunnett’s post-test for comparisons with wildtype (WT) and T1 samples.
Figure 4.
Figure 4.. The GGXXG and CV+C motifs reduce pCD3ζ levels.
(A) Phosphorylation intensity of CD3ζ for T1 and T1-TMD (left), T1 and T1-Palm (2C) (center), and T1 and T1-TP (2C) (right) are shown for independently generated pairs of (connecting line) T1 and T1-TMD (left), T1 and T1-Palm (2C) (center), and T1 and T1-TP (2C) (right) cell lines. Each pair of lines (connected closed symbols) was tested in three independent experiments (technical replicates). The data from those experiments was aggregated, and the symbols represent the mean intensity of the aggregated pCD3ζ intensity values. One-way ANOVA was performed with a Dunnett’s post-test using GraphPad Prim 9. (B) Data for each cell line in A are shown as the average pCD3ζ intensity for all T1-TMD (left), T1-Palm (2C) (center), and T1-TP (2C) (right) cell lines normalized to their paired T1 control. Dotted line is the normalized pCD3ζ intensity for T1Δbind as a visual reference point for the contributions of CD4-pMHCII interactions. Bars represent the mean± SEM. One-way ANOVA was performed with a Sidak’s post-test for specific comparisons using GraphPad Prim 9. (C) The average % responders for phosphorylation of CD3ζ is shown for T1-TMD (left), T1-Palm (2C) (center), and T1-TP (2C) (right) compared to the average of their paired T1 control lines. Bars represent the mean± SEM. One-way ANOVA was performed with a Sidak’s post-test for specific comparisons using GraphPad Prim 9.
Figure 4—figure supplement 1.
Figure 4—figure supplement 1.. Raw and normalized pZAP70 analyses.
(A) Phosphorylation intensity of ZAP70 for T1 and T1-TMD (left), T1 and T1-Palm (2C) (center), and T1 and T1-TP (2C) (right) are shown for paired (connecting line) cell lines. Analysis was performed as in Figure 4A. (B) Normalized phosphorylation intensity of ZAP70 for T1-TMD (left), T1-Palm (2C) (center), and T1-TP (2C) (right) are shown as bars. Analysis was performed as in Figure 4B. (C) Average % responders of the phosphorylation ZAP70 for T1-TMD (left), T1-Palm (2C) (center), and T1-TP (2C) (right) are shown as bars compared to the average of their paired T1 cell lines. Analysis was performed as in Figure 4C.
Figure 4—figure supplement 2.
Figure 4—figure supplement 2.. Raw and normalized pPLCγ1 analyses.
(A) Phosphorylation intensity of PLCγ1 for T1 and T1-TMD (left), T1 and T1-Palm (2C) (center), and T1 and T1-TP (2C) (right) are shown for paired (connecting line) cell lines. Analysis was performed as in Figure 4A. (B) Normalized phosphorylation intensity of PLCγ1 for T1-TMD (left), T1-Palm (2C) (center), and T1-TP (2C) (right) are shown as bars. Analysis was performed as in Figure 4B. (C) Average % responders of phosphorylated pPLCγ1 for T1-TMD (left), T1-Palm (2C) (center), and T1-TP (2C) (right) are shown as bars compared to the average of their paired T1 cell lines. Analysis was performed as in Figure 4C.
Figure 4—figure supplement 3.
Figure 4—figure supplement 3.. Representative IL-2 production is shown in response to M12 cells transduced to express tethered MCC:I-Ek constructs as used in phosphorylation analysis.
Experiments were performed in triplicate and each bar equals the mean± SEM at that peptide concentration. Results are representative of those obtained with two independently generated matched sets of cell lines. One-way ANOVA was performed with a Dunnett’s post-test for comparisons with wildtype (WT) and T1 samples, and a Sidak’s post-test for comparisons between selected samples. MCC, moth cytochrome c.
Figure 5.
Figure 5.. The (C/F)CVRC motifs reduce proximal T cell receptor (TCR)-CD3 signaling.
(A) Phosphorylation intensity of CD3ζ for T1 and T1-Palm (3C) (left) and T1 and T1-TP (3C) (right) are shown for independently generated pairs of (connecting lines) T1 and T1-Palm (3C) (left) and T1 and T1-TP (3C) (right) cell lines. Analysis was performed as in Figure 4A. (B) Data for each mutant cell line in A are shown as the average pCD3ζ intensity values for T1-Palm (3C) (left) and T1-TP (3C) (right) normalized to their paired T1 controls. The dotted line represents the normalized phosphorylation of CD3ζ intensity for T1Δbind as a visual reference for the contributions of CD4-pMHCII interactions. Analysis was performed as in Figure 4C. (C) Average % responders for phosphorylation of CD3ζ is shown for T1-Palm (3C) (left) and T1-TP (3C) (right) are shown compared to the average of their paired T1 control. Analysis was performed as in Figure 4C.
Figure 5—figure supplement 1.
Figure 5—figure supplement 1.. Raw and normalized pZAP70 analyses.
(A) Phosphorylation intensity of ZAP70 for T1 and T1-Palm (3C) (left) and T1 and T1-TP (3C) (right) are shown for paired (connecting line) cell lines. Analysis was performed as in Figure 5A. (B) Normalized phosphorylation intensity of ZAP70 for T1-Palm (3C) (left) and T1-TP (3C) (right) are shown as bars. Analysis was performed as in Figure 5B. (C) Average % responders of phosphorylated ZAP70 for T1-Palm (3C) (left) and T1-TP (3C) (right) are shown as bars compared to the average of their paired T1 controls. Analysis was performed as in Figure 5C.
Figure 5—figure supplement 2.
Figure 5—figure supplement 2.. Raw and normalized analysis of pPlCγ1.
(A) Phosphorylation intensity of PLCγ1 for T1 and T1-Palm (3C) (left) and T1 and T1-TP (3C) (right) are shown for paired (connecting line) cell lines. Analysis was performed as in Figure 5A. (B) Normalized phosphorylation intensity of PLCγ1 for T1-Palm (3C) (left) and T1-TP (3C) (right) are shown as bars. Analysis was performed as in Figure 5B. (C) Average % responders of phosphorylated PLCγ1 for T1-Palm (3C) (left) and T1-TP (3C) (right) are shown as bars compared to the average of their paired T1 controls. Analysis was performed as in Figure 5C.

Update of

Similar articles

References

    1. Aivazian D, Stern LJ. Phosphorylation of T cell receptor zeta is regulated by a lipid dependent folding transition. Nature Structural Biology. 2000;7:1023–1026. doi: 10.1038/80930. - DOI - PubMed
    1. Ashkenazy H, Erez E, Martz E, Pupko T, Ben-Tal N. ConSurf 2010: calculating evolutionary conservation in sequence and structure of proteins and nucleic acids. Nucleic Acids Research. 2010;38:W529–W533. doi: 10.1093/nar/gkq399. - DOI - PMC - PubMed
    1. Ashkenazy H, Abadi S, Martz E, Chay O, Mayrose I, Pupko T, Ben-Tal N. ConSurf 2016: an improved methodology to estimate and visualize evolutionary conservation in macromolecules. Nucleic Acids Research. 2016;44:W344–W350. doi: 10.1093/nar/gkw408. - DOI - PMC - PubMed
    1. Bosselut R, Zhang W, Ashe JM, Kopacz JL, Samelson LE, Singer A. Association of the adaptor molecule LAT with CD4 and CD8 coreceptors identifies a new coreceptor function in T cell receptor signal transduction. The Journal of Experimental Medicine. 1999;190:1517–1526. doi: 10.1084/jem.190.10.1517. - DOI - PMC - PubMed
    1. Buslje CM, Santos J, Delfino JM, Nielsen M. Correction for phylogeny, small number of observations and data redundancy improves the identification of coevolving amino acid pairs using mutual information. Bioinformatics. 2009;25:1125–1131. doi: 10.1093/bioinformatics/btp135. - DOI - PMC - PubMed

MeSH terms

Substances