

Haplotype function score improves biological interpretation and cross-ancestry polygenic prediction of human complex traits
- PMID: 38639992
- PMCID: PMC11031082
- DOI: 10.7554/eLife.92574
Haplotype function score improves biological interpretation and cross-ancestry polygenic prediction of human complex traits
Abstract
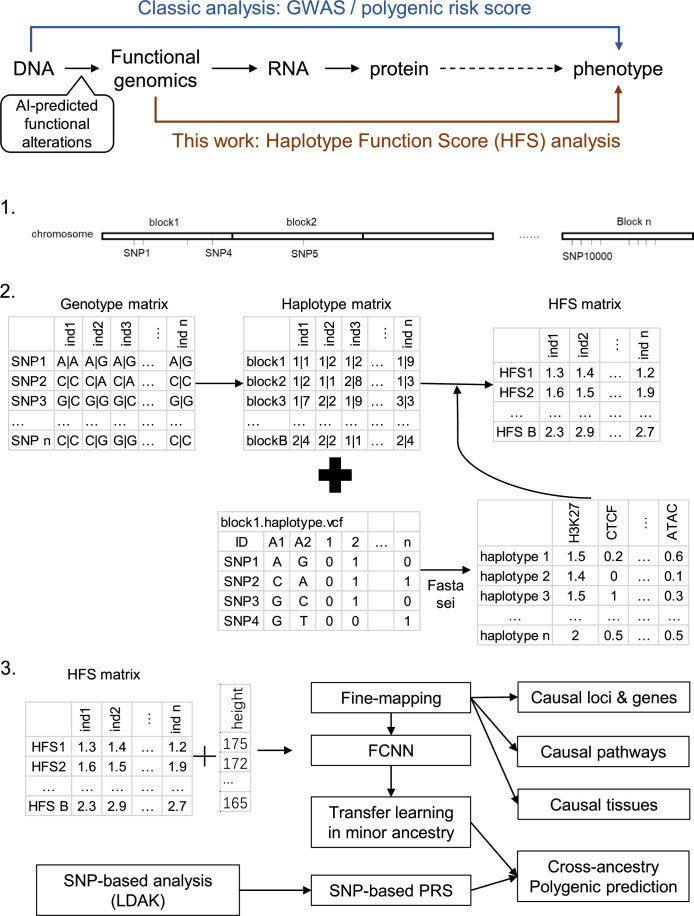
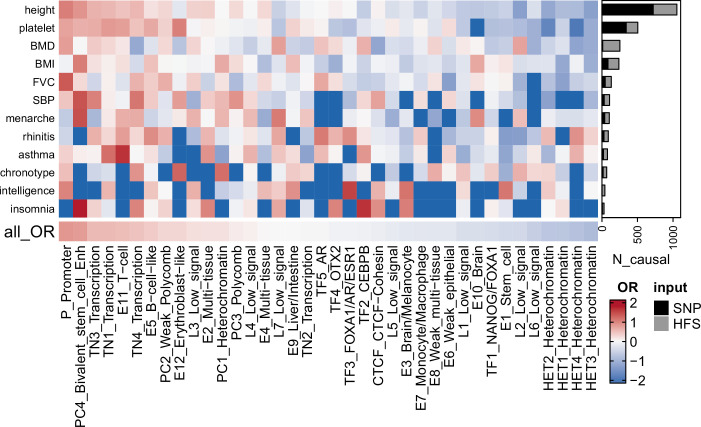
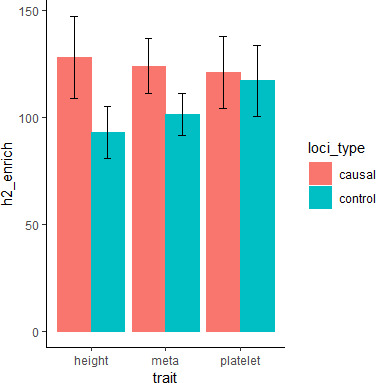
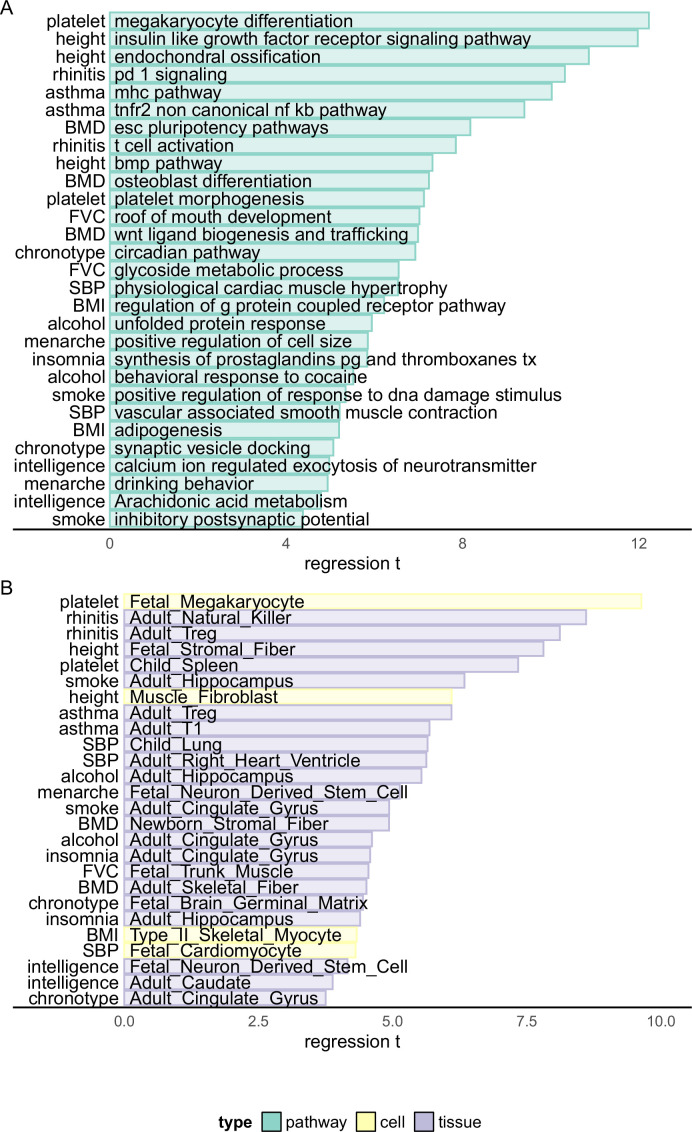
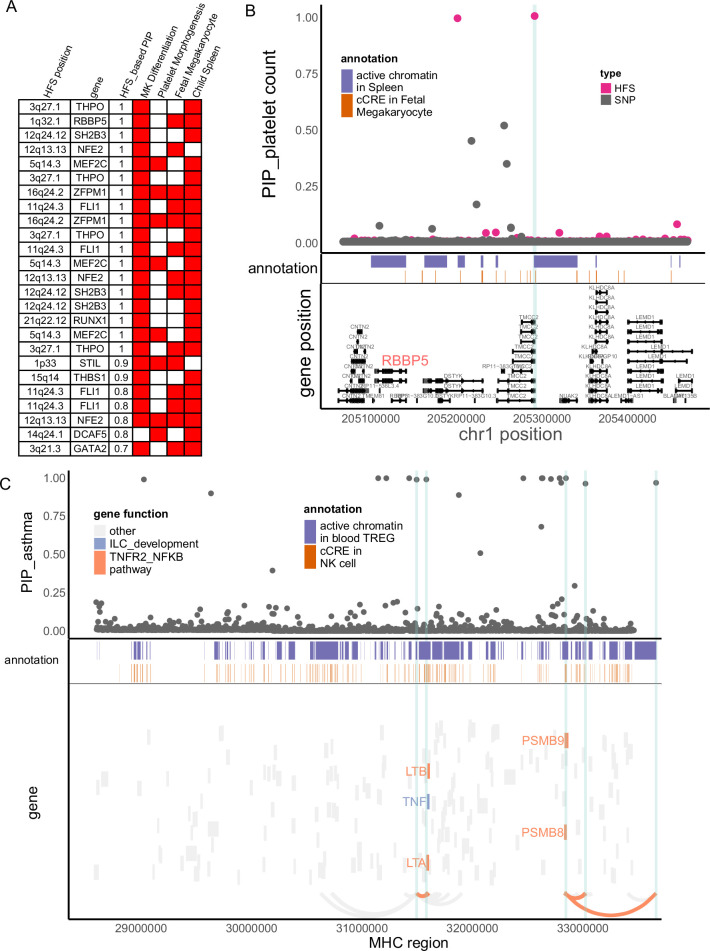
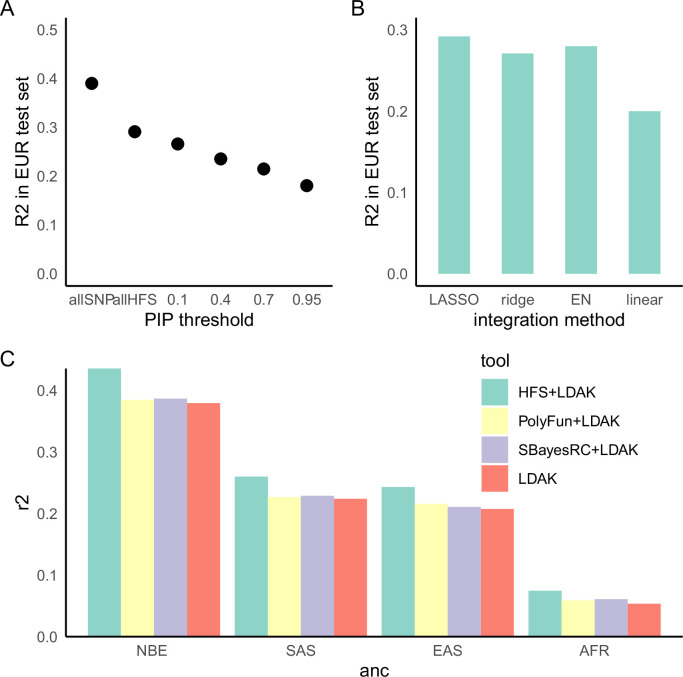
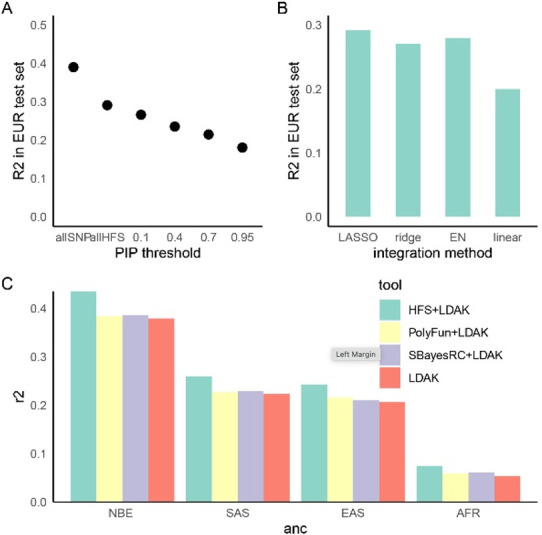
We propose a new framework for human genetic association studies: at each locus, a deep learning model (in this study, Sei) is used to calculate the functional genomic activity score for two haplotypes per individual. This score, defined as the Haplotype Function Score (HFS), replaces the original genotype in association studies. Applying the HFS framework to 14 complex traits in the UK Biobank, we identified 3619 independent HFS-trait associations with a significance of p < 5 × 10⁻⁸. Fine-mapping revealed 2699 causal associations, corresponding to a median increase of 63 causal findings per trait compared with single-nucleotide polymorphism (SNP)-based analysis. HFS-based enrichment analysis uncovered 727 pathway-trait associations and 153 tissue-trait associations with strong biological interpretability, including 'circadian pathway-chronotype' and 'arachidonic acid-intelligence'. Lastly, we applied least absolute shrinkage and selection operator (LASSO) regression to integrate HFS prediction score with SNP-based polygenic risk scores, which showed an improvement of 16.1-39.8% in cross-ancestry polygenic prediction. We concluded that HFS is a promising strategy for understanding the genetic basis of human complex traits.
Keywords: computational biology; deep learning; fine-mapping; functional genomics; genetics; genome-wide association study; genomics; human; polygenic prediction; systems biology.
Plain language summary
Scattered throughout the human genome are variations in the genetic code that make individuals more or less likely to develop certain traits. To identify these variants, scientists carry out Genome-wide association studies (GWAS) which compare the DNA variants of large groups of people with and without the trait of interest. This method has been able to find the underlying genes for many human diseases, but it has limitations. For instance, some variations are linked together due to where they are positioned within DNA, which can result in GWAS falsely reporting associations between genetic variants and traits. This phenomenon, known as linkage equilibrium, can be avoided by analyzing functional genomics which looks at the multiple ways a gene’s activity can be influenced by a variation. For instance, how the gene is copied and decoded in to proteins and RNA molecules, and the rate at which these products are generated. Researchers can now use an artificial intelligence technique called deep learning to generate functional genomic data from a particular DNA sequence. Here, Song et al. used one of these deep learning models to calculate the functional genomics of haplotypes, groups of genetic variants inherited from one parent. The approach was applied to DNA samples from over 350 thousand individuals included in the UK BioBank. An activity score, defined as the haplotype function score (or HFS for short), was calculated for at least two haplotypes per individual, and then compared to various complex traits like height or bone density. Song et al. found that the HFS framework was better at finding links between genes and specific traits than existing methods. It also provided more information on the biology that may be underpinning these outcomes. Although more work is needed to reduce the computer processing times required to calculate the HFS, Song et al. believe that their new method has the potential to improve the way researchers identify links between genes and human traits.
© 2023, Song et al.
Conflict of interest statement
WS, YS, GL No competing interests declared
Figures
Update of
- doi: 10.1101/2023.08.08.552392
- doi: 10.7554/eLife.92574.1
- doi: 10.7554/eLife.92574.2
Similar articles
-
Variable prediction accuracy of polygenic scores within an ancestry group.Elife. 2020 Jan 30;9:e48376. doi: 10.7554/eLife.48376. Elife. 2020. PMID: 31999256 Free PMC article.
-
A Selection Operator for Summary Association Statistics Reveals Allelic Heterogeneity of Complex Traits.Am J Hum Genet. 2017 Dec 7;101(6):903-912. doi: 10.1016/j.ajhg.2017.09.027. Am J Hum Genet. 2017. PMID: 29198721 Free PMC article.
-
Limited haplotype diversity underlies polygenic trait architecture across 70 years of wheat breeding.Genome Biol. 2021 May 6;22(1):137. doi: 10.1186/s13059-021-02354-7. Genome Biol. 2021. PMID: 33957956 Free PMC article.
-
The omnigenic model and polygenic prediction of complex traits.Am J Hum Genet. 2021 Sep 2;108(9):1558-1563. doi: 10.1016/j.ajhg.2021.07.003. Epub 2021 Jul 30. Am J Hum Genet. 2021. PMID: 34331855 Free PMC article. Review.
-
Complex-Trait Prediction in the Era of Big Data.Trends Genet. 2018 Oct;34(10):746-754. doi: 10.1016/j.tig.2018.07.004. Epub 2018 Aug 20. Trends Genet. 2018. PMID: 30139641 Free PMC article. Review.
References
-
- Aguet F, Barbeira AN, Bonazzola R, Brown A, Castel SE, Jo B, Kasela S, Kim-Hellmuth S, Liang Y, Oliva M, Flynn ED, Parsana P, Fresard L, Gamazon ER, Hamel AR, He Y, Hormozdiari F, Mohammadi P, Muñoz-Aguirre M, Park YS, Saha A, Strober BJ, Wen X, Wucher V, Ardlie KG, Battle A, Brown CD, Cox N, Das S, Dermitzakis ET, Engelhardt BE, Garrido-Martín D, Gay NR, Getz GA, Guigó R, Handsaker RE, Hoffman PJ, Im HK, Kashin S, Kwong A, Lappalainen T, Xiao L, MacArthur DG, Montgomery SB, Rouhana JM, Stephens M, Stranger BE, Todres E, Viñuela A, Wang G, Zou Y, Anand S, Gabriel S, Graubert A, Hadley K, Huang KH, Nguyen JL, Balliu DT, Conrad B, Cotter DF, Einson J, Eskin E, Eulalio TY, Ferraro NM, Gloudemans MJ, Hou L, Kellis M, Xin L, Mangul S, Nachun DC, Nobel AB, Park Y, Rao AS, Reverter F, Sabatti C, Skol AD, Teran NA, Wright F, Ferreira PG, Li G, Melé M, Yeger-Lotem E, Barcus ME, Bradbury D, Krubit T, McLean JA, Qi L, Robinson K, Smith AM, Sobin L, Tabor DE, Undale A, Bridge J, Brigham LE, Foster BA, Gillard BM, Hasz R, Hunter M, Johns C, Johnson M, Karasik E, Kopen G, Leinweber WF, McDonald A, Moser MT, Myer K, Ramsey KD, Roe B, Shad S, Thomas JA, Walters G, Washington M, Wheeler J, Jewell SD, Rohrer DC, Valley DR, Davis DA, Mash DC, Branton PA, Sobin L, Barker LK, Gardiner HM, Mosavel M, Siminoff LA, Flicek P, Haeussler M, Juettemann T, Kent WJ, Lee CM, Powell CC, Rosenbloom KR, Ruffier M, Sheppard D, Taylor K, Trevanion SJ, Zerbino DR, Abell NS, Akey J, Chen L, Demanelis K, Doherty JA, Feinberg AP, Hansen KD, Hickey PF, Hou L, Jasmine F, Jiang L, Kaul R, Kellis M, Kibriya MG, Li JB, Li Q, Lin S, Linder SE, Pierce BL, Rizzardi LF, Smith KS, Snyder M, Stamatoyannopoulos J, Tang H, Wang M, Branton PA, Carithers LJ, Guan P, Koester SE, Little AR, Moore HM, Nierras CR, Rao AK, Vaught JB, Volpi S. The GTEx Consortium atlas of genetic regulatory effects across human tissues. Science. 2020;369:1318–1330. doi: 10.1126/science.aaz1776. - DOI - PMC - PubMed
-
- Altshuler DM, Gibbs RA, Peltonen L, Altshuler DM, Gibbs RA, Peltonen L, Dermitzakis E, Schaffner SF, Yu F, Peltonen L, Dermitzakis E, Bonnen PE, Altshuler DM, Gibbs RA, de Bakker PIW, Deloukas P, Gabriel SB, Gwilliam R, Hunt S, Inouye M, Jia X, Palotie A, Parkin M, Whittaker P, Yu F, Chang K, Hawes A, Lewis LR, Ren Y, Wheeler D, Gibbs RA, Muzny DM, Barnes C, Darvishi K, Hurles M, Korn JM, Kristiansson K, Lee C, McCarrol SA, Nemesh J, Dermitzakis E, Keinan A, Montgomery SB, Pollack S, Price AL, Soranzo N, Bonnen PE, Gibbs RA, Gonzaga-Jauregui C, Keinan A, Price AL, Yu F, Anttila V, Brodeur W, Daly MJ, Leslie S, McVean G, Moutsianas L, Nguyen H, Schaffner SF, Zhang Q, Ghori MJR, McGinnis R, McLaren W, Pollack S, Price AL, Schaffner SF, Takeuchi F, Grossman SR, Shlyakhter I, Hostetter EB, Sabeti PC, Adebamowo CA, Foster MW, Gordon DR, Licinio J, Manca MC, Marshall PA, Matsuda I, Ngare D, Wang VO, Reddy D, Rotimi CN, Royal CD, Sharp RR, Zeng C, Brooks LD, McEwen JE. Integrating common and rare genetic variation in diverse human populations. Nature. 2010;467:52–58. doi: 10.1038/nature09298. - DOI - PMC - PubMed
-
- Ashburner M, Ball CA, Blake JA, Botstein D, Butler H, Cherry JM, Davis AP, Dolinski K, Dwight SS, Eppig JT, Harris MA, Hill DP, Issel-Tarver L, Kasarskis A, Lewis S, Matese JC, Richardson JE, Ringwald M, Rubin GM, Sherlock G. Gene Ontology: tool for the unification of biology. Nature Genetics. 2000;25:25–29. doi: 10.1038/75556. - DOI - PMC - PubMed
-
- Baca SC, Singler C, Zacharia S, Seo JH, Morova T, Hach F, Ding Y, Schwarz T, Huang CCF, Anderson J, Fay AP, Kalita C, Groha S, Pomerantz MM, Wang V, Linder S, Sweeney CJ, Zwart W, Lack NA, Pasaniuc B, Takeda DY, Gusev A, Freedman ML. Genetic determinants of chromatin reveal prostate cancer risk mediated by context-dependent gene regulation. Nature Genetics. 2022;54:1364–1375. doi: 10.1038/s41588-022-01168-y. - DOI - PMC - PubMed
MeSH terms
Grants and funding
- 2030 Science and Technology Innovation Key Program 2022ZD020910001/Ministry of Science and Technology
- 81971292/National Natural Science Foundation of China
- 82150610506/National Natural Science Foundation of China
- 21ZR1428600/Natural Science Foundation of Shanghai
- YG2022ZD026/Medical-Engineering Cross Foundation of Shanghai Jiao Tong University
LinkOut - more resources
Full Text Sources
