Editorial
. 2024 Jul 1;35(7):886-900.
doi: 10.1681/ASN.0000000000000350. Epub 2024 Apr 19.

The Clinical Relevance of the Infiltrating Immune Cell Composition in Kidney Transplant Rejection

Affiliations
Editorial

The Clinical Relevance of the Infiltrating Immune Cell Composition in Kidney Transplant Rejection

Thibaut Vaulet et al. J Am Soc Nephrol. .

Abstract

Key Points:

  1. The estimated composition of immune cells in kidney transplants correlates poorly with the primary rejection categories defined by Banff criteria.

  2. Spatial cell distribution could be coupled with a detailed cellular composition to assess causal triggers for allorecognition.

  3. Intragraft CD8temra cells showed strong and consistent association with graft failure, regardless of the Banff rejection phenotypes.

Background: The link between the histology of kidney transplant rejection, especially antibody-mediated rejection, T-cell–mediated rejection, and mixed rejection, and the types of infiltrating immune cells is currently not well charted. Cost and technical complexity of single-cell analysis hinder large-scale studies of the relationship between cell infiltrate profiles and histological heterogeneity.

Methods: In this cross-sectional study, we assessed the composition of nine intragraft immune cell types by using a validated kidney transplant–specific signature matrix for deconvolution of bulk transcriptomics in three different kidney transplant biopsy datasets (N=403, N=224, N=282). The association and discrimination of the immune cell types with the Banff histology and the association with graft failure were assessed individually and with multivariable models. Unsupervised clustering algorithms were applied on the overall immune cell composition and compared with the Banff phenotypes.

Results: Banff-defined rejection was related to high presence of CD8+ effector T cells, natural killer cells, monocytes/macrophages, and, to a lesser extent, B cells, whereas CD4+ memory T cells were lower in rejection compared with no rejection. Estimated intragraft effector memory–expressing CD45RA (TEMRA) CD8+ T cells were strongly and consistently associated with graft failure. The large heterogeneity in immune cell composition across rejection types prevented supervised and unsupervised methods to accurately recover the Banff phenotypes solely on the basis of immune cell estimates. The lack of correlation between immune cell composition and Banff-defined rejection types was validated using multiplex immunohistochemistry.

Conclusions: Although some specific cell types (FCGR3A+ myeloid cells, CD14+ monocytes/macrophages, and NK cells) partly discriminated between rejection phenotypes, the overall estimated immune cell composition of kidney transplants was ill-related to main Banff-defined rejection categories and added to the Banff lesion scoring and evaluation of rejection severity. The estimated intragraft CD8temra cells bore strong and consistent association with graft failure and were independent of Banff-grade rejection.

Trial registration: ClinicalTrials.gov NCT02832661.


Conflict of interest statement

Disclosure forms, as provided by each author, are available with the online version of the article at http://links.lww.com/JSN/E633.

Figures

None
Graphical abstract
Figure 1
Figure 1
Overview of the immune cell estimation process with the deconvolution of bulk transcriptomics data and the multiplexed immunohistochemistry (MILAN). For the deconvolution, a signature matrix is first constructed on the basis of single-cell RNA data. This matrix consists of barcode genes (rows) pertaining to the individual cell types (columns). Note that the matrix also contains signature genes to identify structural kidney cell types, not represented here to simplify the figure. In a second stage, the same matrix is used to deconvolute the different bulk RNA datasets with CIBERSORTx software, resulting in estimation of cellular proportion for each individual biopsy. For the multiplexed immunohistochemistry (MILAN), the proportion of immune cells is directly observed from the images with the relevant markers. Detailed statistical methods are described in Supplemental Material. MILAN, Multiple Iterative Labeling by Antibody Neodeposition.
Figure 2
Figure 2
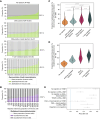
Extent of inflammation in the main Banff categories. (A) Extent of inflammation (%) as total number of estimated immune cells compared with the total number of estimated cells in each individual biopsy of the main Banff categories in Combined dataset 1 (N=596). (B) Extent of inflammation (%) as total number of counted immune cells compared with the total number of counted cells in each individual biopsy of the main Banff categories in MILAN Dataset (N=18). The dotted line represents the mean proportion of immune cells per Banff phenotype. (C) Overall distribution of the extent of inflammation per Banff phenotype in Combined dataset 1 (N=596). Pairwise comparisons are performed with Student t tests. (D) Overall distribution of the extent of inflammation per Banff phenotype in MILAN Dataset (N=18). (E) Pairwise discrimination performance of the total of estimated immune cells for the main diagnostic categories, measured with AUC (95% CI). AMR, antibody-mediated rejection; AUC, area under the receiver operating characteristic curve; CI, confidence interval; DSA, donor-specific antibodies; NR, no rejection; TCMR, T-cell–mediated rejection.
Figure 3
Figure 3
Association of the immune cell infiltration with the Banff histology. (A) Difference in normalized mean cellular contents between the rejection phenotypes and the no rejection category in the Combined dataset 1 (N=596). The immune cell types are quantified as fractions of all cell types per biopsy. DSA+ mixed rejection cases showed significant differences in various cell types compared with no rejection: NK cells (+1.7%, P < 0.001), FCGR3A+ myeloid cells (+2.6%, P < 0.001), B cells (+2.2%, P < 0.001), and CD4mem cells (−5.1%, P < 0.001). TCMR displayed the highest extent of inflammation (total immune cells) (+16.5%, P < 0.001), as well as notable increases in CD4naive (+1.8%, P < 0.001) and CD14+ mono/macro cells (+5.9%, P < 0.001). CD4mem cells were the only cells whose fractions were higher in no rejection than in any of the rejection categories (on average +3.1%, P < 0.001). CD4mem cells were the only cell type more abundant in no rejection compared with any of the rejection categories (+3.1% on average, P < 0.001). CD8effmem and CD8temra cells exhibited minimal differences between no rejection and the main rejection types. The 95% CI were constructed with bootstrap (m=2000 replications). The corresponding non-normalized mean differences and statistical tests are reported in Supplemental Table 2. (B) Difference in normalized mean cellular contents between the rejection phenotypes and the no rejection category in the MILAN dataset (N=18). The immune cell types are quantified as fractions of all cell types per biopsy. The effector cells (CD4eff and CD8eff), CD1c+ dendritic cells, neutrophils, and the total of immune cells demonstrate increased proportion in rejection phenotypes compared with no rejection. The CD8eff and the total of immune cells patterns are similar to those observed on deconvoluted data (A). Similarly, the NK cells also demonstrate a lower proportion in TCMR than in AMR or mixed, as found in deconvoluted data (A). CD4reg demonstrated a similar negative trend in rejection phenotypes compared with no rejection as CD4mem on deconvoluted data. The corresponding non-normalized mean differences and statistical tests are reported in Supplemental Table 3. (C) Association between the immune cell proportions, as a fraction of all cell types per biopsy, and the histological ordinal Banff lesion scores on the Biomargin dataset (N=224). The number represents the Kendall tau with the following significant levels: *<0.05, **<0.01, and ***<0.001. CD14+ mono/macro cells, FCGR3A+ myeloid cells, NK cells, and the total proportion of immune cells have a positive correlation with the set of acute lesion scores (i, t, v, g, ptc, and C4d). Tubulointerstitial lesions (t) and interstitial lesions (i) are mostly associated with CD4naive and CD8effmem cells, while CD4mem cells show a negative association with these lesions. By contrast, the different immune cell types demonstrate a weak association with the chronic lesions, except for B cells, which are significantly associated with all chronic lesion scores. (D) Association between the immune cell proportions, as a fraction of all cell types per biopsy analyzed using multiplexed immunohistochemistry, and the histological ordinal Banff lesion scores on the MILAN dataset (N=18). The number represents the Kendall tau with the following significant levels: *<0.05 and **<0.01. The effector cells (CD4eff and CD8 eff), neutrophils, and the total proportion of immune cells, and to a lesser extent B cells, macrophages, and S100+ dendritic cells, demonstrate a strong significant association with tubulointerstitial lesions (t) and/or interstitial lesions (i). NK cells are mostly associated with the g lesion and not with tubulointerstitial lesions, displaying a similar pattern as shown in the deconvoluted data. Similar to the CD4mem in deconvoluted data, the CD4reg cells show overall a negative correlation, although not reaching the significance threshold. As with the deconvoluted data, none of the chronic lesion scores were significantly associated with any of the observed immune cell types.
Figure 4
Figure 4
Unadjusted discrimination performance of the individual cell type proportions in Combined dataset 1 (N=596). (A) Discrimination performance between no rejection and any rejection (TCMR, DSA+ AMR, or DSA+ mixed rejection), reported with AUC (95% CI); all the immune cells demonstrated a better discrimination performance than a random estimator (represented by the dotted line at 0.5 AUC). Both types of monocytes/macrophages had the largest discrimination ability, followed by the total immune cells. (B) Overall discrimination performance between the four Banff phenotypes, including no rejection, reported with the PDI. Because there are four different classes to discriminate, the PDI baseline, corresponding to a random guess, is equal to 1/4=0.25. The ranking of the cell types is similar to (A) with AUC, with both monocyte/macrophage types having the largest discrimination power, followed by the total immune cells. (C) Overall discrimination performance (PDI) between the three main rejection phenotypes only (TCMR, DSA+ AMR, DSA+ mixed rejection). PDI baseline is equal to 1/3=0.333. Once the no rejection cases are excluded, the total of immune cells is the best discriminator (although a large overlap is present with other individual immune cell types). The FCGR3A+ myeloid cells ranked lower, suggesting similarity of its distribution within the rejection categories. PDI, Polytomous Discrimination Index.
Figure 5
Figure 5
Association with graft failure per immune cell type. The immune cell types are quantified as fractions of all cell types per biopsy. (A) HR from individual Cox models, adjusted for time post-transplantation for each immune cell type in Combined dataset 2 (N=506). CD8temra cells clearly dominate the ranking with a much stronger association (HR, 1.75 [95% CI, 1.48 to 2.073]). Note that although HR is unitless, it remains inherently linked to the original variable unit (% in this case), which provides direct interpretation of the HR. However, the comparison between cell types of different magnitude range is less apparent. (B) HR from individual Cox models, adjusted for time post-transplantation in the Biomargin (N=224) and GSE21374 (N=282) datasets. The association of CD8temra cells with graft failure remains largely superior to the other cell types in each individual dataset. Beside CD8temra, FCGR3A+ myeloid cells are the only cell type to remain significantly associated with graft failure in both subsets. (C) Kaplan–Meier curves for each tertile of the six individual cell types significantly associated with graft failure in Combined dataset 2 (N=506). Note the reversed ordering of the CD4mem Kaplan–Meier curves compared with the other cell types (reflecting its below-1 HR). HR, hazard ratio.

References

    1. Loupy A, Mengel M, Haas M. Thirty years of the International Banff Classification for Allograft Pathology: the past, present, and future of kidney transplant diagnostics. Kidney Int. 2022;101(4):678–691. doi: 10.1016/j.kint.2021.11.028 - DOI - PubMed
    1. Roufosse C Simmonds N Clahsen-van Groningen M, et al. A 2018 reference guide to the Banff classification of renal allograft pathology. Transplantation. 2018;102(11):1795–1814. doi: 10.1097/TP.0000000000002366 - DOI - PMC - PubMed
    1. Naesens M Roufosse C Colvin RB, et al. The Banff 2022 kidney meeting report: Re-appraisal of microvascular inflammation and the role of biopsy-based transcript diagnostics. SSRN Electron J. 2023. doi: 10.2139/ssrn.4447700. https://papers.ssrn.com/abstract=4447700. - DOI - PubMed
    1. Roufosse C Naesens M Colvin RB, et al. The Banff 2022 kidney meeting work plan: data-driven refinement of the Banff classification for renal allografts. SSRN Electron J. 2023. doi: 10.2139/ssrn.4444233. https://papers.ssrn.com/abstract=4444233. - DOI - PMC - PubMed
    1. Halloran PF, Famulski KS, Reeve J. Molecular assessment of disease states in kidney transplant biopsy samples. Nat Rev Nephrol. 2016;12(9):534–548. doi: 10.1038/nrneph.2016.85 - DOI - PubMed

Publication types

Associated data