

Multiparameter immunoprofiling for the diagnosis and differentiation of progressive versus nonprogressive nontuberculous mycobacterial lung disease-A pilot study
- PMID: 38640113
- PMCID: PMC11029658
- DOI: 10.1371/journal.pone.0301659
Multiparameter immunoprofiling for the diagnosis and differentiation of progressive versus nonprogressive nontuberculous mycobacterial lung disease-A pilot study
Abstract
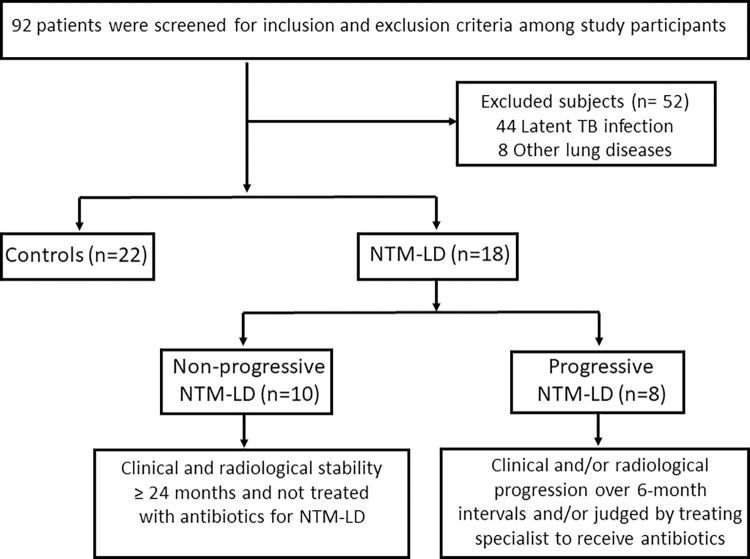
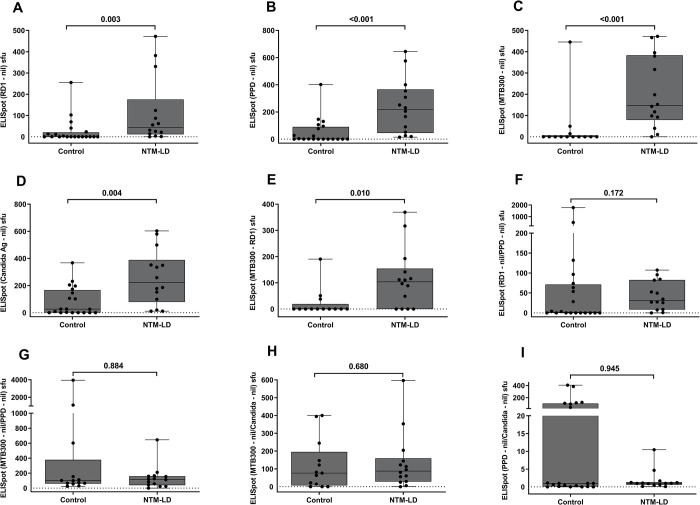
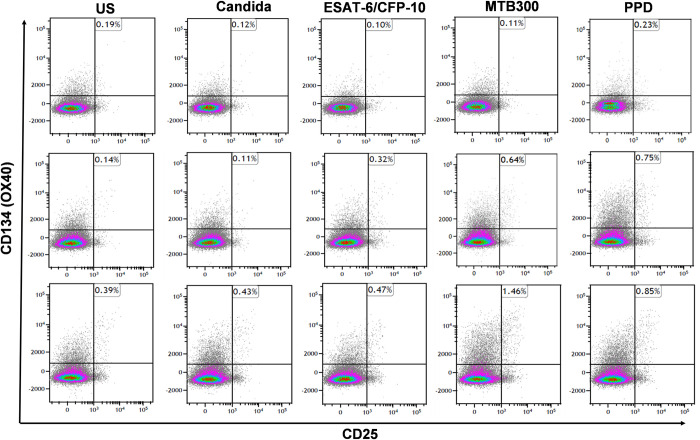
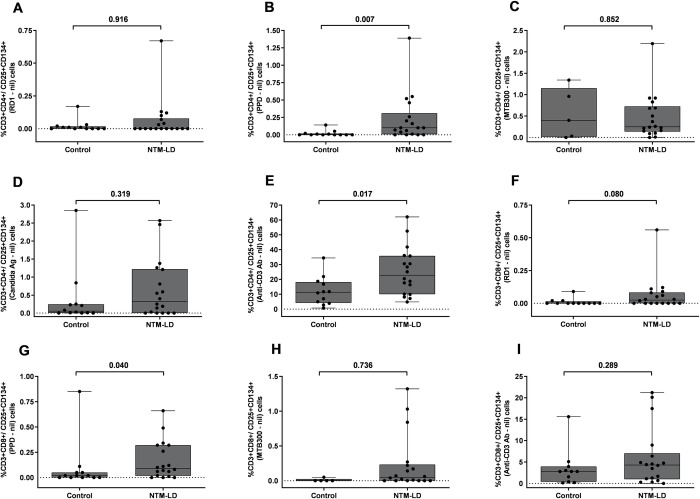
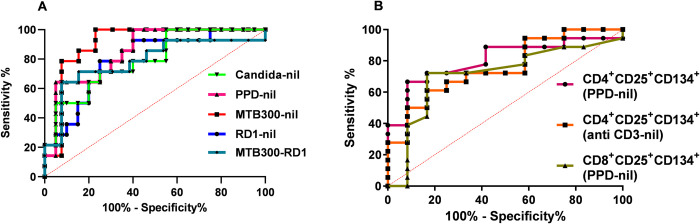
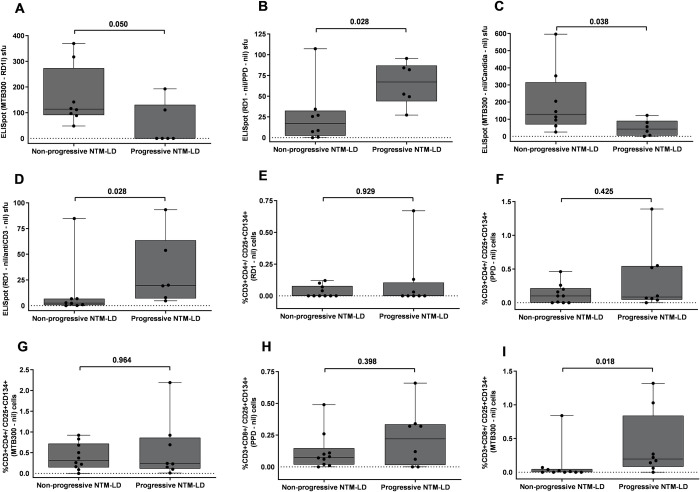
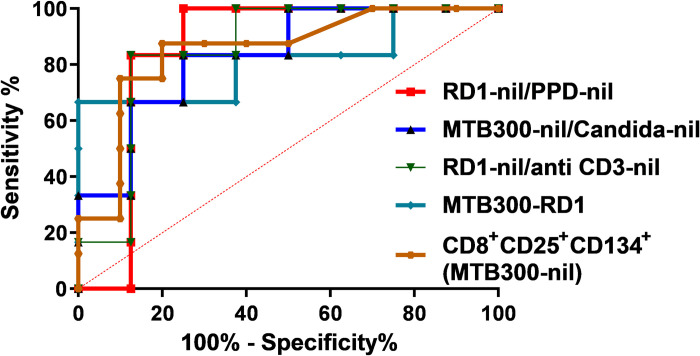
Clinical prediction of nontuberculous mycobacteria lung disease (NTM-LD) progression remains challenging. We aimed to evaluate antigen-specific immunoprofiling utilizing flow cytometry (FC) of activation-induced markers (AIM) and IFN-γ enzyme-linked immune absorbent spot assay (ELISpot) accurately identifies patients with NTM-LD, and differentiate those with progressive from nonprogressive NTM-LD. A Prospective, single-center, and laboratory technician-blinded pilot study was conducted to evaluate the FC and ELISpot based immunoprofiling in patients with NTM-LD (n = 18) and controls (n = 22). Among 18 NTM-LD patients, 10 NTM-LD patients were classified into nonprogressive, and 8 as progressive NTM-LD based on clinical and radiological features. Peripheral blood mononuclear cells were collected from patients with NTM-LD and control subjects with negative QuantiFERON results. After stimulation with purified protein derivative (PPD), mycobacteria-specific peptide pools (MTB300, RD1-peptides), and control antigens, we performed IFN-γ ELISpot and FC AIM assays to access their diagnostic accuracies by receiver operating curve (ROC) analysis across study groups. Patients with NTM-LD had significantly higher percentage of CD4+/CD8+ T-cells co-expressing CD25+CD134+ in response to PPD stimulation, differentiating between NTM-LD and controls. Among patients with NTM-LD, there was a significant difference in CD25+CD134+ co-expression in MTB300-stimulated CD8+ T-cells (p <0.05; AUC-ROC = 0.831; Sensitivity = 75% [95% CI: 34.9-96.8]; Specificity = 90% [95% CI: 55.5-99.7]) between progressors and nonprogressors. Significant differences in the ratios of antigen-specific IFN-γ ELISpot responses were also seen for RD1-nil/PPD-nil and RD1-nil/anti-CD3-nil between patients with nonprogressive vs. progressive NTM-LD. Our results suggest that multiparameter immunoprofiling can accurately identify patients with NTM-LD and may identify patients at risk of disease progression. A larger longitudinal study is needed to further evaluate this novel immunoprofiling approach.
Copyright: © 2024 Marty et al. This is an open access article distributed under the terms of the Creative Commons Attribution License, which permits unrestricted use, distribution, and reproduction in any medium, provided the original author and source are credited.
Conflict of interest statement
P.E. and T.P., and their institution have filed two patent applications related to immunodiagnostic laboratory methodologies for latent tuberculosis infection (Patent numbers: 9678071 and 10401360), which are not included in this manuscript. To date, there has been no income or royalties associated with those filed patent applications. This does not alter our adherence to PLOS ONE policies on sharing data and materials. PE participated in a short-term advisory scientific board for DiaSorin Molecular in 2020, which was outside the scope of the submitted manuscript, and honorarium was paid to Mayo Clinic. E.S.T serves as a consultant for Roche Diagnostics (Basel, Switzerland), Euroimmun US (Mountain Lakes, NJ, USA), and Seriummune Inc. (Goleta, CA, USA) on topics outside the scope of this manuscript. P.E., T.P., and E.S.T. have no other conflicts to declare. P.K.M., B.P., T.M.C., V.P.V, C.L.E., M.S., M.V., P.A.S., S.K., K.M.P., and C. S. L. A. have no conflicts to declare.
Figures
References
-
- Winthrop KL, Marras TK, Adjemian J, Zhang HX, Wang P, Zhang QW. Incidence and Prevalence of Nontuberculous Mycobacterial Lung Disease in a Large US Managed Care Health Plan, 2008–2015. Annals of the American Thoracic Society. 2020;17(2):178–85. doi: 10.1513/AnnalsATS.201804-236OC - DOI - PMC - PubMed
-
- Spaulding AB, Lai YL, Zelazny AM, Olivier KN, Kadri SS, Prevots DR, et al.. Geographic Distribution of Nontuberculous Mycobacterial Species Identified among Clinical Isolates in the United States, 2009–2013. Annals of the American Thoracic Society. 2017;14(11):1655–61. doi: 10.1513/AnnalsATS.201611-860OC - DOI - PMC - PubMed
MeSH terms
Grants and funding
LinkOut - more resources
Full Text Sources
Medical
Research Materials
