Clinical Trial
. 2024 Aug 27;8(16):4459-4475.
doi: 10.1182/bloodadvances.2023012467.

Multicenter, phase 1 study of etavopivat (FT-4202) treatment for up to 12 weeks in patients with sickle cell disease

Affiliations
Clinical Trial

Multicenter, phase 1 study of etavopivat (FT-4202) treatment for up to 12 weeks in patients with sickle cell disease

Santosh L Saraf et al. Blood Adv. .

Abstract

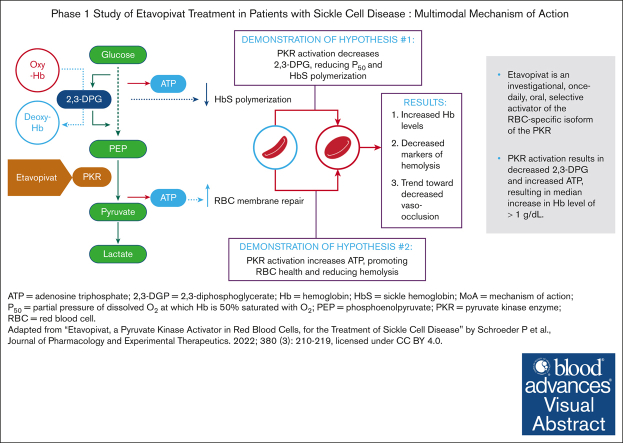
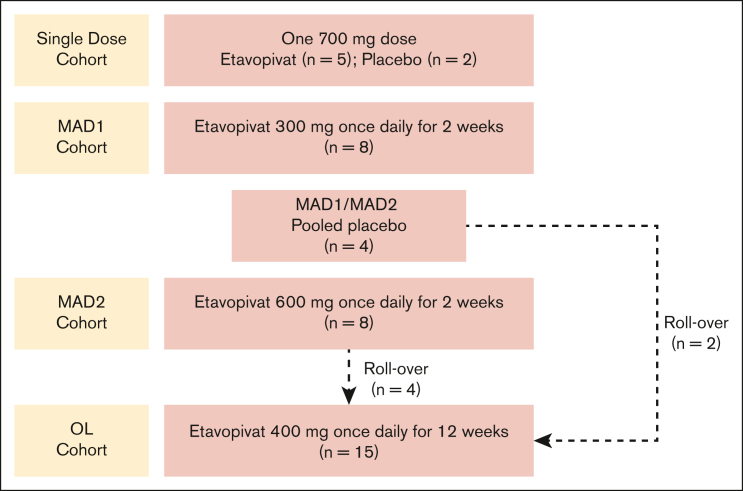
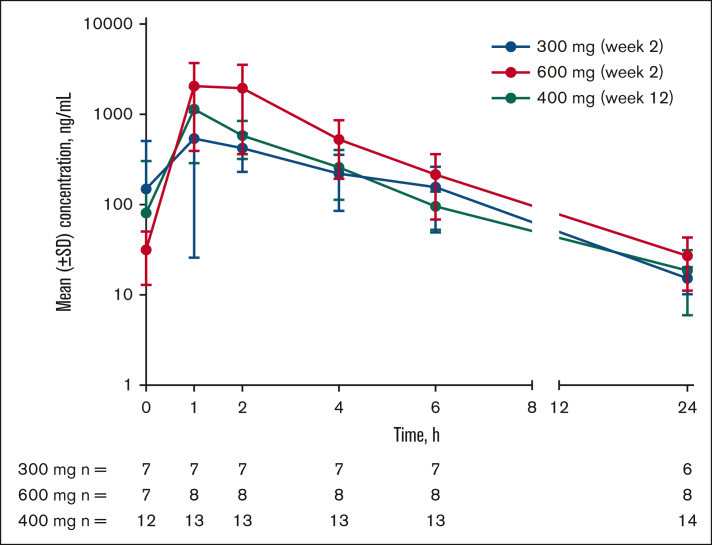
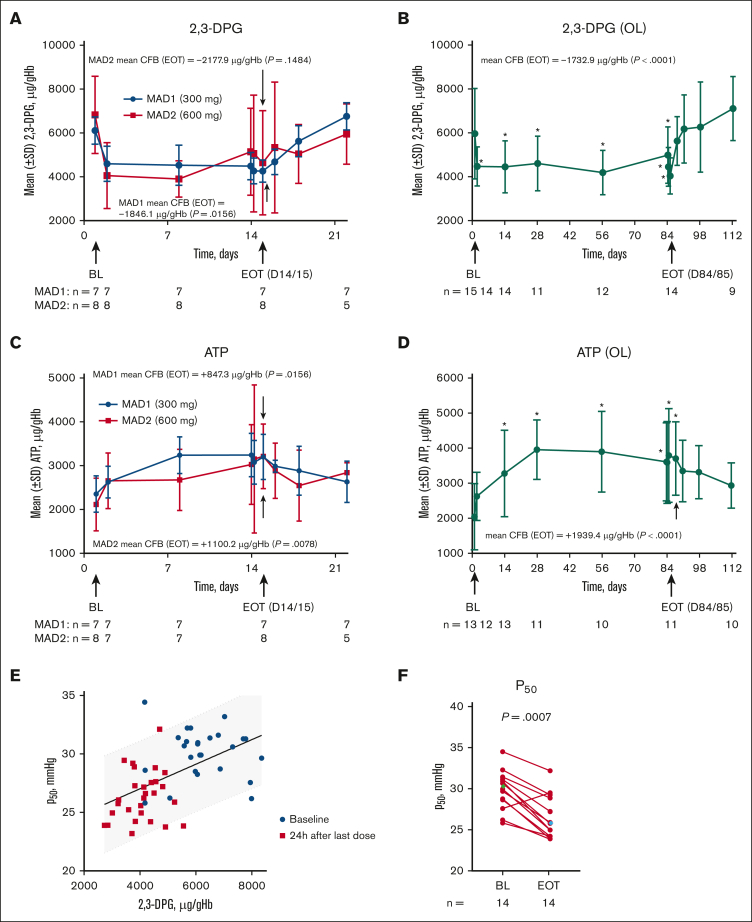
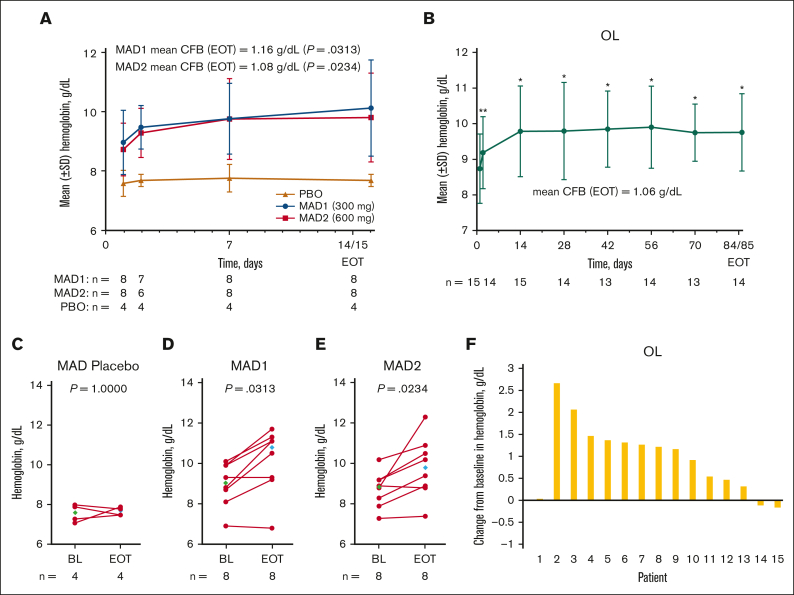
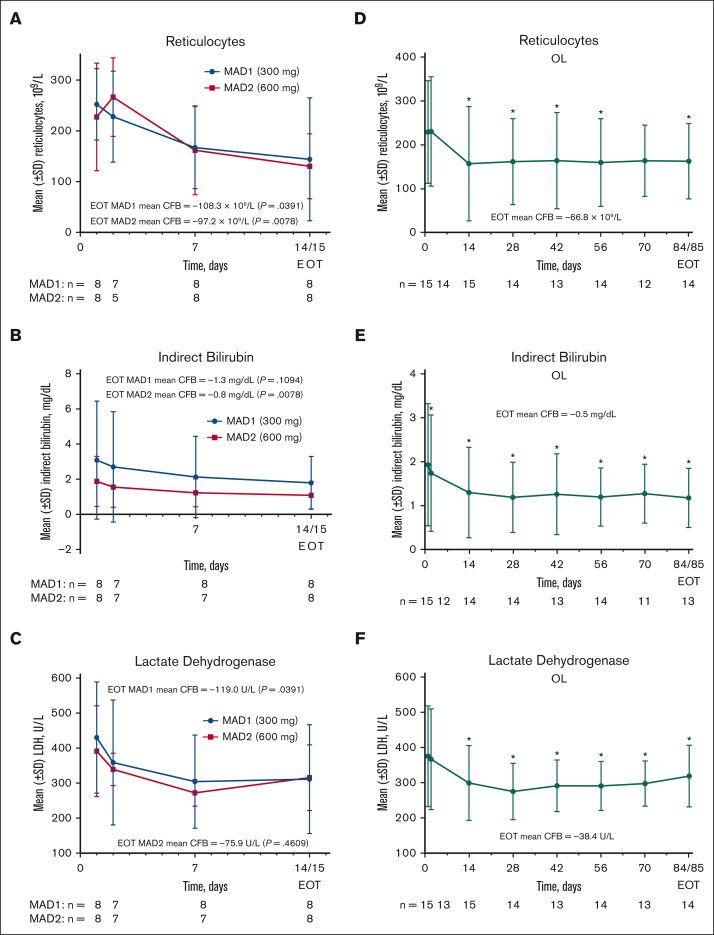
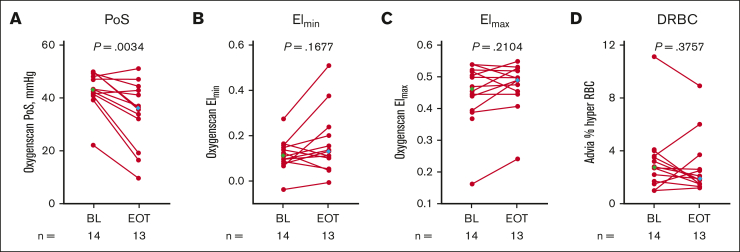
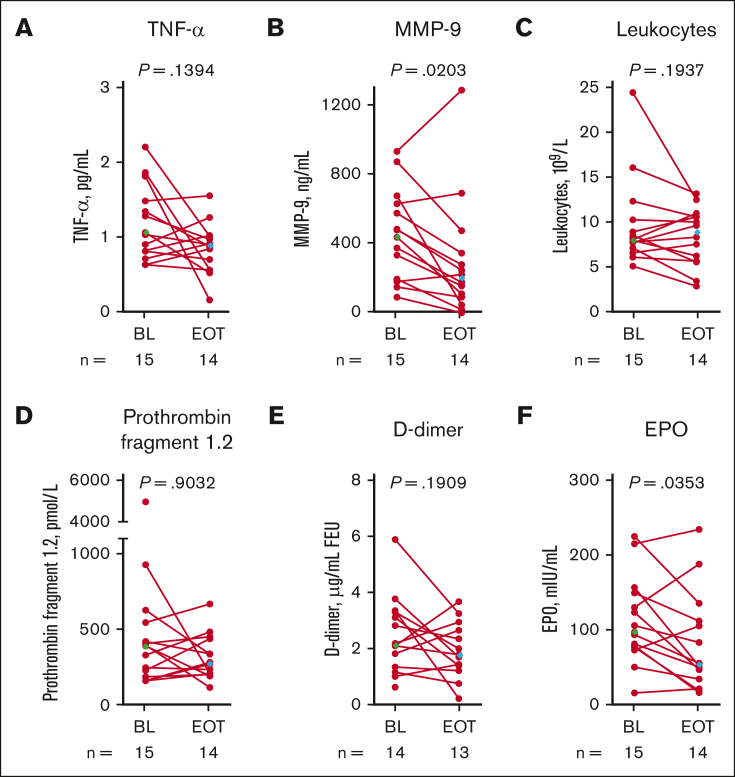
Etavopivat is an investigational, once daily, oral, selective erythrocyte pyruvate kinase (PKR) activator. A multicenter, randomized, placebo-controlled, double-blind, 3-part, phase 1 study was conducted to characterize the safety and clinical activity of etavopivat. Thirty-six patients with sickle cell disease (SCD) were enrolled into 4 cohorts: 1 single-dose, 2 multiple ascending doses, and 1 open-label (OL). In the OL cohort, 15 patients (median age 33.0 years [range, 17-55]) received 400 mg etavopivat once daily for 12 weeks; 14 patients completed treatment. Consistent with the mechanism of PKR activation, increases in adenosine triphosphate and decreases in 2,3-diphosphoglycerate were observed and sustained over 12 weeks' treatment. This translated clinically to an increase in hemoglobin (Hb; mean maximal increase 1.6 g/dL [range, 0.8-2.8]), with >1 g/dL increase in 11 (73%) patients during treatment. In addition, the oxygen tension at which Hb is 50% saturated was reduced (P = .0007) with a concomitant shift in point of sickling (P = .0034) to lower oxygen tension in oxygen-gradient ektacytometry. Hemolysis markers (absolute reticulocyte count, indirect bilirubin, and lactate dehydrogenase) decreased from baseline, along with matrix metalloproteinase-9 and erythropoietin. In the OL cohort, adverse events (AEs) were mostly grade 1/2, consistent with underlying SCD; 5 patients had serious AEs. Vaso-occlusive pain episode was the most common treatment-emergent AE (n = 7) in the OL cohort. In this, to our knowledge, the first study of etavopivat in SCD, 400 mg once daily for 12 weeks was well tolerated, resulting in rapid and sustained increases in Hb, improved red blood cell physiology, and decreased hemolysis. This trial was registered at www.ClinicalTrials.gov as #NCT03815695.


Conflict of interest statement

Conflict-of-interest disclosure: E.W., S.F., J.G., I.O., P.S., and M.R. were employees of and held stock in Forma Therapeutics, Inc, which was acquired by Novo Nordisk, at the time of this study. P.F.K was a consultant to Forma Therapeutics, Inc, which was acquired by Novo Nordisk, was an employee when the study was performed, and held stock in Forma Therapeutic, Inc. I.O. is a former principal investigator at Levine Cancer Institute/Atrium health and formerly held consultancies with Forma Therapeutics, Novo Nordisk, Agios, Global Blood Therapeutics (GBT), Novartis, Cheisi, Acceleron, and Emmaus; served on speaker’s bureau for Novartis and GBT; received research funding from the Centers for Disease Control, Health Resources and Service’s Administration, and Patient Centered Outcomes Research Institute; and was an employee of Forma Therapeutics between February and October 2022 and is currently an employee of Novo Nordisk since October 2022. S.L.S. reports consultancies with Forma Therapeutics, Inc, Novo Nordisk, GBT/Pfizer, ORIC Pharmaceuticals, Agios, and Beam Therapeutics; membership on the advisory committees of GBT/Pfizer and Novartis; and research funding from Forma Therapeutics, Inc, Novo Nordisk, GBT, Novartis, and Pfizer. R.H. reports consultancies with Bristol Myers Squib, GBT, Imara, National Institutes of Health (NIH), Novartis and research funding from Chiesi, Forma Therapeutics, Inc, and the University of Pittsburgh. M.I. reports consultancies with GBT; receives research funding from Novartis, Pfizer, GBT, Agios, Alexion, Novo Nordisk, and Forma; serves on the GBT speaker’s bureau; and is a member of the board/advisory committee of GBT. R.C.B. was a principal investigator at Children’s Healthcare of Atlanta at the time of study and formally held consultancies with GBT, Imara, Novartis; received funding from GBT, Novartis, Forma Therapeutics, and Imara; and has been an employee of GBT, a wholly owned subsidiary of Pfizer as of October 2023, since July 2022. F.A.K. received research funding from Forma. T.A.K. reports consultancies, membership on advisory boards, and research funding from Forma Therapeutics, Inc, Novo Nordisk, Agios Pharmaceuticals, Inc; and research funding from the NIH. M.J.T. reports consultancies with GlycoMimetics, Inc; served on a data safety monitoring board of Novartis; and received research funding from Forma Therapeutics, Inc, CSL Behring, Inc, Doris Duke Charitable Foundation, and the NIH. K.C. declares no competing financial interests.

Figures

None
Graphical abstract
Figure 1.
Figure 1.
Study design. Patients in the MAD2 cohort could directly rollover into the OL cohort at the time of their EOS visit whether they tolerated the 2-week treatment period and continued to meet eligibility criteria. Patients from other cohorts and the study sites could also enroll in the OL cohort. In the OL cohort, protocol amendment 7.0 allowed etavopivat dosing to extend from 2 days to up to 2 weeks beyond day 84, allowing a stepwise dose decrease in patients with a >2.0 g/dL increase in Hb over baseline or if clinically indicated. MAD, multiple ascending dose; OL, open-label.
Figure 2.
Figure 2.
Etavopivat concentration vs time after daily dosing in patients with SCD (MAD and OL cohorts). Mean (± SD) etavopivat concentrations after daily dosing on day 14 (MAD) or day 84 (OL) at the indicated time point (hours). MAD, multiple ascending dose; OL, open-label; SCD, sickle cell disease; SD, standard deviation.
Figure 3.
Figure 3.
PD in patients with SCD. Mean RBC 2,3-DPG and ATP concentrations in the MAD (A,C), and OL (B,D) cohorts. Values were normalized by dividing the Hb value at each time point to adjust for a dilution effect from increased Hb (A-D). The P50 value as a function of intracellular 2,3-DPG concentration in the MAD (excluding placebo patients) and OL cohorts 24 hours after the last dose (E). Scatterplot at baseline (BL) and EOT for P50 in the OL cohort (Median BL and EOT values shown in green and blue diamonds, respectively) (F); each data point corresponds to data from 1 patient. Paired BL and EOT data points from each patient are connected by a line. In the MAD cohorts (A,C), P values were based on Wilcoxon signed rank tests to test the changes at EOT from BL. In the OL cohort (B,D), PD values with statistical significance compared with BL were identified with an asterisk (∗P < .05) at their scheduled visits, based on MMRM, which included PD values as dependent variable, and a fixed effect of scheduled visit during the treatment period with compound symmetry covariance matrix to model the within patient variance-covariance errors; the EOT P values were derived from Wilcoxon signed rank tests. Statistical tests were not performed for the visits after EOT. P values in the scatterplot are from a Wilcoxon matched-pairs signed rank test (F). One MAD1 (300 mg) patient was excluded from 2,3-DPG, ATP, and P50 analyses because the patient only took 1 dose of study drug on day 1. ATP, adenosine triphosphate; CFB, change from baseline; 2,3-DPG, 2,3-diphosphoglycerate; EOT, end of treatment; Hb, hemoglobin; MAD, multiple ascending dose; MMRM, mixed model for repeated measurement; OL, open-label; P50, oxygen tension at which Hb is 50% saturated; PD, pharmacodynamic; SCD, sickle cell disease; SD, standard deviation; RBC, red blood cell.
Figure 4.
Figure 4.
Change in Hb response in patients with SCD (MAD and OL cohorts). Mean (± SE) Hb concentration over time in the MAD (A) and OL (B) cohorts. Values for mean change from BL at EOT are shown on the graphs (A-B). In the MAD cohorts, EOT was equal to the day 15 value, if available, otherwise EOT was equal to day 14 (A). In the OL cohort, EOT was equal to the day 85 value, if available, otherwise EOT was equal to day 84 (B). Scatterplots at BL and EOT for MAD pooled placebo (C), MAD1 (D), MAD2 (E), and OL (F); each data point corresponds to data from 1 patient. Median BL and EOT values shown in green and blue diamonds, respectively (C-F). Paired BL and EOT data points from each patient are connected by a line. In the MAD cohorts (A), P values were based on Wilcoxon signed rank tests to test the changes at EOT from BL. In the OL cohort (B), Hb values with statistical significance as compared with BL were identified using asterisks (∗P ≤ .0001; ∗∗P < .01) at their scheduled visits, based on MMRM, which included Hb values as a dependent variable, and a fixed effect of scheduled visits during the treatment period, with unstructured covariance matrix to model the within-patient variance-covariance errors. Statistical tests were not performed for the visits after EOT. P value in the scatterplots are from a Wilcoxon matched-pairs signed rank test (C-F). BL, baseline; CFB, change from baseline; EOT, end of treatment; Hb, hemoglobin; MAD, multiple ascending dose; MMRM, mixed model for repeated measurement; OL, open-label; PBO, placebo; SE, standard error; SCD, sickle cell disease; SD, standard deviation.
Figure 5.
Figure 5.
Hemolysis markers in patients with SCD (MAD and OL cohorts). Mean (± SE) absolute reticulocytes, iBIL, and LDH over time in the MAD cohorts (A,B,C, respectively) and OL cohorts (D,E,F, respectively). In the MAD cohorts (A-C), P values were based on Wilcoxon signed rank tests to test the changes at EOT from BL. In the OL cohort (D-F), hemolysis marker values with statistical significance as compared with BL were identified using an asterisk (∗P ≤ .05) at their scheduled visits, based on MMRM, which included hemolysis marker values as a dependent variable, and a fixed effect of scheduled visits during the treatment period. An unstructured covariance was used for LDH and reticulocytes, and a compound symmetry covariance was used for iBIL. Statistical tests were not performed for the visits after EOT. BL, baseline; CFB, change from baseline; EOT, end of treatment; iBIL, indirect bilirubin; LDH, lactate dehydrogenase; MAD, multiple ascending dose; MMRM, mixed model for repeated measurement; OL, open-label; SCD, sickle cell disease; SD, standard deviation.
Figure 6.
Figure 6.
Markers of RBC physiology (OL cohort). Scatterplots for PoS (A), Elmin (B), Elmax (C), and (hyper) DRBCs (D) at BL and EOT. Each data point corresponds to data from 1 patient. Paired BL and EOT data points from each patient are connected by a line. Median BL and EOT values shown in green and blue diamonds, respectively. P values are from a Wilcoxon matched-pairs signed rank test. Percent hyper RBC is defined as the percent of RBCs with >41 g/dL of Hb. BL, baseline; DRBCs, dense RBCs; EI, elongation index; Elmax, maximum EI; Elmin, minimum EI; EOT, end of treatment; OL, open-label; PoS, point of sickling; RBC, red blood cell.
Figure 7.
Figure 7.
Systemic markers of SCD pathophysiology in patients with SCD (OL cohort). Each data point corresponds to data from 1 patient. Paired BL and EOT data points from each patient are connected by a line. Median BL and EOT values shown in green and blue diamonds, respectively. P values are from a Wilcoxon matched-pairs signed rank test. TNF-α (A), MMP-9 (B), leukocytes (C), prothrombin fragment 1.2 (D), D-dimer (E), and erythropoietin (F). BL, baseline; EOT, end of treatment; EPO, erythropoietin; FEU, fibrinogen equivalent unit; MMP-9, matrix metalloproteinase-9; OL, open-label; SCD, sickle cell disease; TNF-α, tumor necrosis factor alpha.

Comment in

References

    1. Kato GJ, Piel FB, Reid CD, et al. Sickle cell disease. Nat Rev Dis Primers. 2018;4 - PubMed
    1. Piel FB, Steinberg MH, Rees DC. Sickle cell disease. N Engl J Med. 2017;376(16):1561–1573. - PubMed
    1. Rees DC, Williams TN, Gladwin MT. Sickle-cell disease. Lancet. 2010;376(9757):2018–2031. - PubMed
    1. Piel FB, Hay SI, Gupta S, Weatherall DJ, Williams TN. Global burden of sickle cell anaemia in children under five, 2010-2050: modelling based on demographics, excess mortality, and interventions. PLoS Med. 2013;10(7) - PMC - PubMed
    1. Kapoor S, Little JA, Pecker LH. Advances in the treatment of sickle cell disease. Mayo Clin Proc. 2018;93(12):1810–1824. - PubMed

Publication types

Associated data