. 2024 Apr 19;9(94):eadg7549.
doi: 10.1126/sciimmunol.adg7549. Epub 2024 Apr 19.

Gut-associated lymphoid tissue attrition associates with response to anti-α4β7 therapy in ulcerative colitis

Affiliations

Gut-associated lymphoid tissue attrition associates with response to anti-α4β7 therapy in ulcerative colitis

Pablo Canales-Herrerias et al. Sci Immunol. .

Abstract

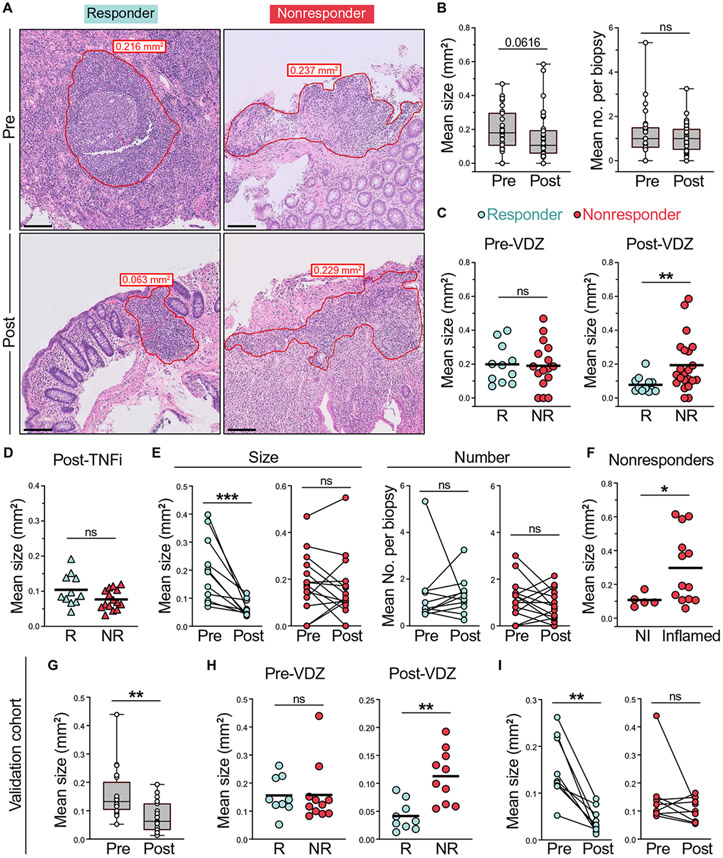
Vedolizumab (VDZ) is a first-line treatment in ulcerative colitis (UC) that targets the α4β7- mucosal vascular addressin cell adhesion molecule 1 (MAdCAM-1) axis. To determine the mechanisms of action of VDZ, we examined five distinct cohorts of patients with UC. A decrease in naïve B and T cells in the intestines and gut-homing (β7+) plasmablasts in circulation of VDZ-treated patients suggested that VDZ targets gut-associated lymphoid tissue (GALT). Anti-α4β7 blockade in wild-type and photoconvertible (KikGR) mice confirmed a loss of GALT size and cellularity because of impaired cellular entry. In VDZ-treated patients with UC, treatment responders demonstrated reduced intestinal lymphoid aggregate size and follicle organization and a reduction of β7+IgG+ plasmablasts in circulation, as well as IgG+ plasma cells and FcγR-dependent signaling in the intestine. GALT targeting represents a previously unappreciated mechanism of action of α4β7-targeted therapies, with major implications for this therapeutic paradigm in UC.


Figures

Fig. 1.
Fig. 1.. Anti-α4β7 treatment is associated with decreased frequency of naïve B and T cells in the intestines of patients with UC.
(A) Representative flow cytometry (FC) plots for total (non-PC) B cells (CD45+CD19+CD38), switched memory B cells (CD45+CD19+CD38IgMIgD), and naïve B cells (CD45+CD19+CD38IgM+IgD+) from the ileum of a patient with UC pre- and post-VDZ. (B) Frequency of total B cells, naïve B cells, and switched memory B cells from ileum and colon of untreated (including pretreatment) (n = 40), VDZ-treated (n = 22), or TNFi-treated patients with UC (n = 11) (top panels). Longitudinal analysis of paired biopsy samples from patients with UC taken pre- and post-VDZ therapy (bottom panels). (C) Representative FC plots showing total PCs (CD38hiCD27+) and their expression of CD45 and CD19 in the left colon of a patient with UC pre- and post-VDZ. (D) Frequency of total PCs, short-lived (CD45+CD19+) and long-lived (CD45+/−CD19) PCs in terminal ileum and left colon of patients with UC. (E) Representative FC plots showing the expression of CD4 and CD8 on CD3+ T cells (left) and the expression of CD45RA and CCR7 on CD4 T cells (right) in the ileum of a patient with UC pre- and post-VDZ. (F) Frequency of CD3 T cells, CD4 and CD8 T cells (top), as well as CD4 to CD8 ratio and naïve (CD45RA+) CD4 and CD8 T cells (bottom). Data are shown as individual data and mean. Nonparametric analysis was done using Kruskal-Wallis test and Dunn’s multiple comparison test. Bottom panels (B and D): Paired nonparametric analysis was done using Wilcoxon test. P values (unless specified): *P ≤ 0.05, **P ≤ 0.01, ***P ≤ 0.001, ****P ≤ 0.0001, nsP > 0.05.
Fig. 2.
Fig. 2.. The frequency of gut-homing β7+ plasmablasts decreases in the peripheral blood of patients with UC after VDZ therapy.
(A) Representative flow cytometry (FC) plots showing the frequency of circulating plasmablasts (CD19+/intCD10 CD38hiCD27+IgD) and β7+ plasmablasts in a patient at week 0 (pre-VDZ) and week 14 (post-VDZ) after initiation of VDZ therapy. (B) Frequency of total plasmablasts and β7+ and β7 plasmablasts in circulation from VDZ-treated patients with UC. Longitudinal samples were taken at weeks 0 and 14 after starting VDZ. (C) Representative FC plots showing the frequency of circulating switched memory B cells (CD19+CD38CD10IgMIgD) and naïve B cells (CD19+CD38CD10IgM+IgD+) in a patient with UC pre- and post-VDZ. (D) Frequency of circulating CD19+ B cells, switched memory B cells, and naïve B cells between week 0 and week 14 of VDZ therapy. (E) Representative FC plots showing the frequency of circulating naïve CD4 cells (CD4+CD45RA+β7int) and β7+ and β7 memory CD4 T cells (CD4+CD45RA) in a patient with UC pre- and post-VDZ. (F) Frequency of circulating memory and naïve T cells in VDZ-treated patients pre- and post-VDZ. Data are shown as individual values and mean or as paired before-after plots. Unpaired analysis was done using Mann-Whitney test. Paired nonparametric analysis was done using Wilcoxon test. P values (unless specified): *P ≤ 0.05, **P ≤ 0.01, ***P ≤ 0.001, ****P ≤ 0.0001, nsP > 0.05.
Fig. 3.
Fig. 3.. Anti-α4β7 antibody administration results in the attrition of PPs in mice.
(A) Mice received one intraperitoneal injection of anti-α4β7 antibody, anti-TNF antibody, or IC antibody and were euthanized 24 hours later. Cells from PPs were analyzed by flow cytometry to quantify FB cells (CD45+B220+IgD+) and GC B cells (CD45+B220+IgDGL7+FASL+). (B) Weight and total cell counts from individual PPs 24 hours after injection. (C) Number of FB cells and GC B cells per mouse. (D) Number of FB cells and GC B cells from PPs of untreated mice (gray) and at 3, 6, 12, 24, and 72 hours after injection (blue). (E) Representative IF images from PPs stained for IgD (red), GL7 (cyan), and DAPI (gray) from mice treated with anti-α4β7 antibody or IC. Scale bars, 100 μm. (F) Ratio of GC area (GL7+) and follicular area (IgD+) from mice treated with anti-α4β7 (blue), anti–MAdCAM-1 (yellow) or IC (gray) antibody. Data shown as individual values and mean. Unpaired nonparametric analysis was done using Kruskal-Wallis test and Dunn’s multiple comparisons test. P values (unless specified): *P ≤ 0.05, **P ≤ 0.01, ***P ≤ 0.001, ****P ≤ 0.0001, nsP > 0.05.
Fig. 4.
Fig. 4.. Transcriptional profiling of mouse PPs after anti-α4β7 therapy.
(A) UMAP representation of single-cell RNA-seq analysis of cells isolated from PPs of mice, 24 hours after anti-α4β7 antibody or PBS administration. GC, GC B; CD4/CD8, T cell; EPI, epithelial; DC, dendritic cell; ILC, innate lymphoid cell; RBC, red blood cell; STRO, stromal. (B) Dot plot showing mean expression and proportion of expressing cells for the indicated genes in each cluster. (C) UMAP plots showing expression level of the indicated genes. (D) Bar plots indicating cell composition of PPs from anti-α4β7– and PBS-treated mice. Cells were grouped into FB cells, GC B cells, T cells (T), and others. (E) Bar plots for the frequency of FB cell clusters among total cells. (F) Dot plot showing mean expression and proportion of expressing cells for the indicated genes in clusters 0, 2, and 8. (G) Left: Bar plot of DEGs in cluster 8 cells between anti-α4β7– and PBS-treated mice. Right: Expression level of Itgb7 in cells from cluster 12. (H) Number of IgA+ PCs isolated from PPs. (I) Mice were primed intraperitoneally with OVA + CT (day 0) and boosted orally with OVA + CT (days 7 and 14). Prime-only and boost-only controls were administered with PBS instead of the immunogen correspondingly. Mice were treated with anti-α4β7 or PBS every 3 days, starting at day 6. Feces were collected at day 17. (J) OVA-specific IgA measured by ELISA. Data are shown as individual values and mean. Unpaired analysis was done using Mann-Whitney test. P values (unless specified): *P ≤ 0.05, **P ≤ 0.01, ***P ≤ 0.001, ****P ≤ 0.0001, nsP > 0.05. IP, intraperitoneally. OR, orally.
Fig. 5.
Fig. 5.. Dynamic monitoring of intestinal lymphocyte trafficking through photoconversion.
(A) Mice were injected with anti-α4β7 or IC antibody 2 hours before photoconversion of PPs (three per mouse) using 405-nm light. Organs were harvested 20 hours later, and cells were analyzed by flow cytometry. (B) Gating strategy for FB cells (CD19+B220+IgD+) and GC B cells (CD19+B220+IgDGL7+) from a representative mouse. (C to F) Absolute cell number and cell frequency of KRED and KGREEN cells out of FB cells (C and D) and GC B cells (E and F). Cells were isolated from non-photoconverted (C and E) and photoconverted (D and F) PPs. (G and H) Absolute cell number and cell frequency of KRED and KGREEN T cells from nonphotoconverted (G) and photoconverted (H) PPs. (I) Model scheme: Anti-α4β7 prevents entry of new (red and green) cells into PPs but does not affect cell egress. Data are shown as individual values, means, and SD. Unpaired analysis was done using Mann-Whitney test. P values (unless specified): *P ≤ 0.05, **P ≤ 0.01, ***P ≤ 0.001, ****P ≤ 0.0001, nsP > 0.05.
Fig. 6.
Fig. 6.. Response to vedolizumab is associated with loss of lymphoid aggregate size.
(A) Representative hematoxylin and eosin staining of colonic biopsies from responder (R) and nonresponder (NR) patients with UC taken before and after VDZ therapy. Lymphoid aggregate (LA) border indicated with red line. Scale bars, 100 μm. (B) Mean LA size and number per biopsy from patients with UC pre- and post-VDZ therapy (cohort 2). Data are shown as box and whisker plots. (C) Comparison of LA size between VDZ responders and NR in biopsies taken pre- and post-VDZ therapy. (D) Mean LA size from patients with UC after treatment with TNFi. (E) Mean LA size (left) and number per biopsy (right) from paired samples obtained pre- and post-VDZ therapy, from responders and NRs. (F) Mean LA size from inflamed and noninflamed tissue areas of NR patients with UC post-VDZ therapy. (G to I) LA size analysis on an independent validation cohort (cohort 3). (G) Mean LA size from patients with UC taken pre- and post-VDZ therapy. (H) Comparison of LA size between responders and NRs in samples taken pre- and post-VDZ therapy. (I) Mean LA size from paired samples taken pre- and post-VDZ therapy from responders and NRs. Paired nonparametric analyses were done using Wilcoxon test. Unpaired analyses were done using Mann-Whitney test. Box plots represent median and quartiles of measurements, and whiskers represent minimum and maximum values. P values (unless specified): *P ≤ 0.05, **P ≤ 0.01, ***P ≤ 0.001, ****P ≤ 0.0001, nsP > 0.05.
Fig. 7.
Fig. 7.. Response to VDZ is associated with impaired B cell responses in the GALT.
(A) Representative IF images of colonic lymphoid aggregates from a patient with UC before therapy. Three GALT types indicated (i) organized aggregate with defined B and T cell zones and GC (black), (ii) organized aggregate with defined B and T cell zones but no GC (gray), and (iii) poorly organized aggregate with no clear B and T cell zones (white). Scale bars, 100 μm. Pie charts indicate the frequency of GALT types in responders and NRs. (B) Comparison of FB cell (IgD+) number per field in responders (cyan) and NRs (red) obtained pre- and post-VDZ therapy (left). FB cell number per field from paired tissues taken pre- and post-VDZ therapy (right). (C) Total T cell (CD3+) number per field from paired tissues taken pre- and post-VDZ therapy in responders and NRs. (D) Top: Heatmap represents the expression profile of a naïve B cell signature in tissues from responders and NRs taken post-VDZ in cohort 5 (n = 31). Bottom: Estimated marginal mean for the naive B cell fraction from pre- and post-VDZ samples in cohort 5. (E and F) Longitudinal analysis of the frequency of β7+ (E) and β7 (F) plasmablasts in circulation from VDZ-treated patients with UC, including IgG+ (top) and IgA+ cells (bottom). (G) Fold change in β7+ plasmablasts between pre- and post-VDZ therapy in responders. (H) Frequency of colonic IgG+ PCs in biopsies taken pre- and post-VDZ therapy. (I) Heatmap shows expression profile of the FcγR-related signature in inflamed and noninflamed tissues from patients with UC from cohort 4. (J) GSVA scores for FcγR-related signature in cohort 4. Samples are categorized as healthy, noninflamed (UC), and inflamed (UC). Comparisons done using LMEM strategy (see Materials and Methods). (K) Estimated marginal mean for the GSVA scores of FcγR pathway–associated signature between responders and NRs in cohort 5 at weeks 0, 6, and 52. Unpaired comparisons were done using Mann-Whitney test. Paired nonparametric analysis was done using Wilcoxon test. P values (unless specified): *P ≤ 0.05, **P ≤ 0.01, ***P ≤ 0.001, ****P ≤ 0.0001, nsP > 0.05.

Update of

References

    1. Feagan BG, Rutgeerts P, Sands BE, Hanauer S, Colombel J-F, Sandborn WJ, Van Assche G, Axler J, Kim H-J, Danese S, Fox I, Milch C, Sankoh S, Wyant T, Xu J, Parikh A, Vedolizumab as induction and maintenance therapy for ulcerative colitis. N. Engl. J. Med 369, 699–710 (2013). - PubMed
    1. Sandborn WJ, Feagan BG, Rutgeerts P, Hanauer S, Colombel J-F, Sands BE, Lukas M, Fedorak RN, Lee S, Bressler B, Fox I, Rosario M, Sankoh S, Xu J, Stephens K, Milch C, Parikh A, Vedolizumab as induction and maintenance therapy for Crohn’s disease. N. Engl. J. Med 369, 711–721 (2013). - PubMed
    1. Rott LS, Briskin MJ, Butcher EC, Expression of α4β7 and E-selectin ligand by circulating memory B cells: Implications for targeted trafficking to mucosal and systemic sites. J. Leukoc. Biol 68, 807–814 (2000). - PubMed
    1. Bargatze RF, Jutila MA, Butcher EC, Distinct roles of L-selectin and integrins alpha 4 beta 7 and LFA-1 in lymphocyte homing to Peyer's patch-HEV in situ: The multistep model confirmed and refined. Immunity 3, 99–108 (1995). - PubMed
    1. Lamb CA, O’Byrne S, Keir ME, Butcher EC, Gut-selective integrin-targeted therapies for inflammatory bowel disease. J. Crohns Colitis 12, S653–S668 (2018). - PubMed

Publication types