

CDK1 and CCNA2 play important roles in oral squamous cell carcinoma
- PMID: 38640322
- PMCID: PMC11029925
- DOI: 10.1097/MD.0000000000037831
CDK1 and CCNA2 play important roles in oral squamous cell carcinoma
Abstract
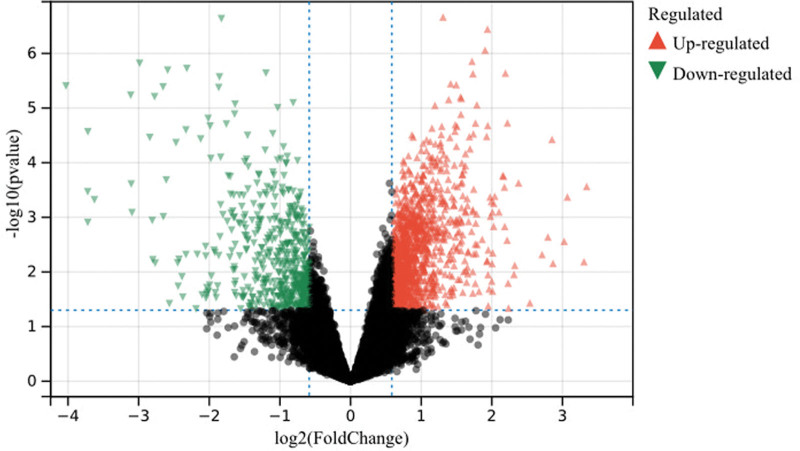
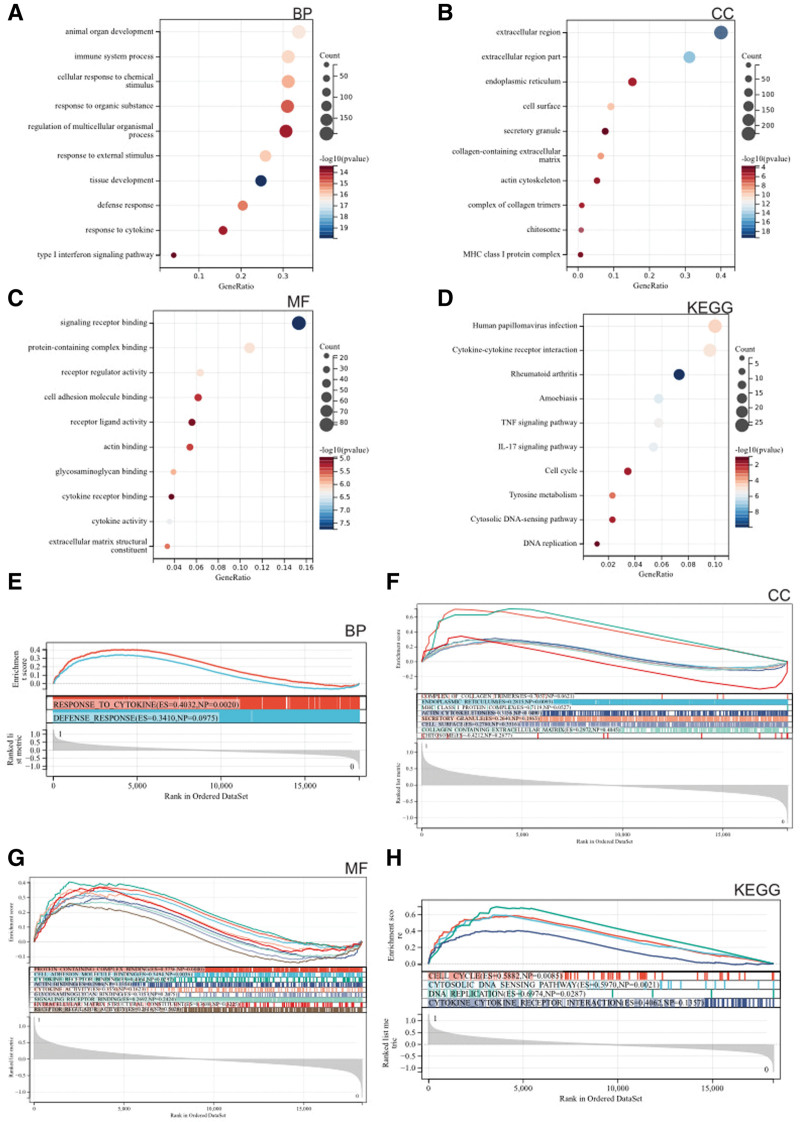
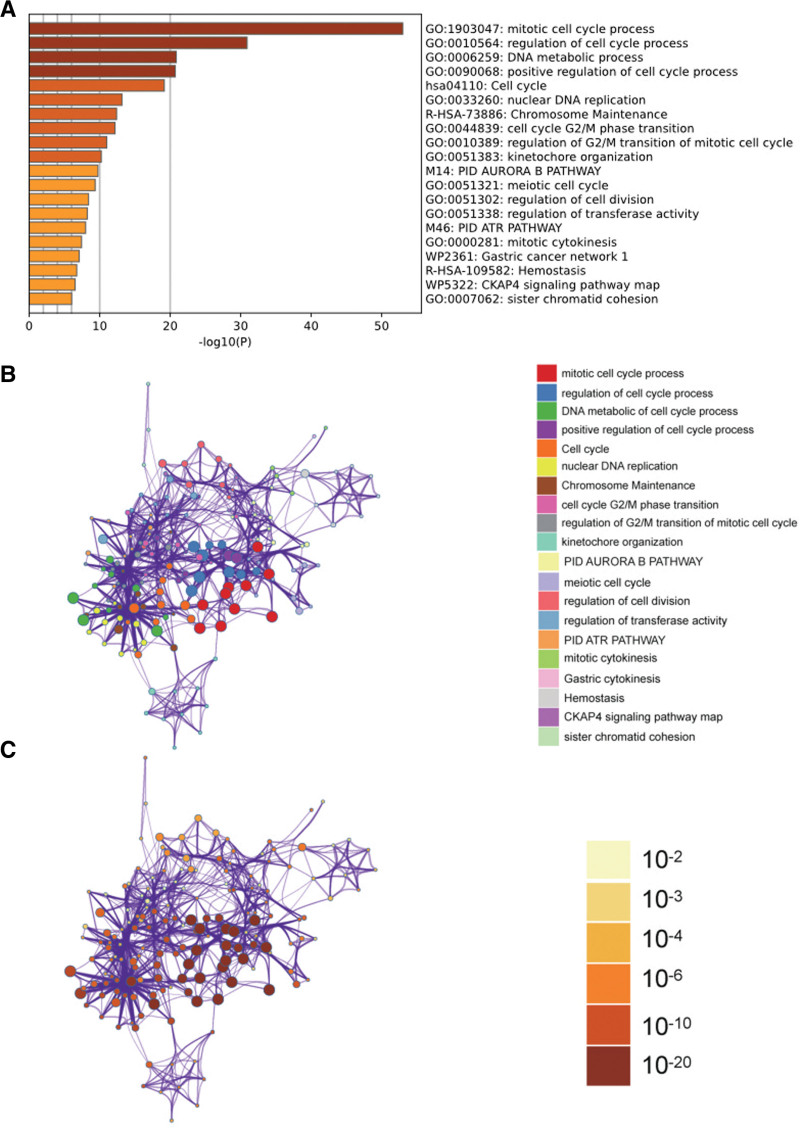
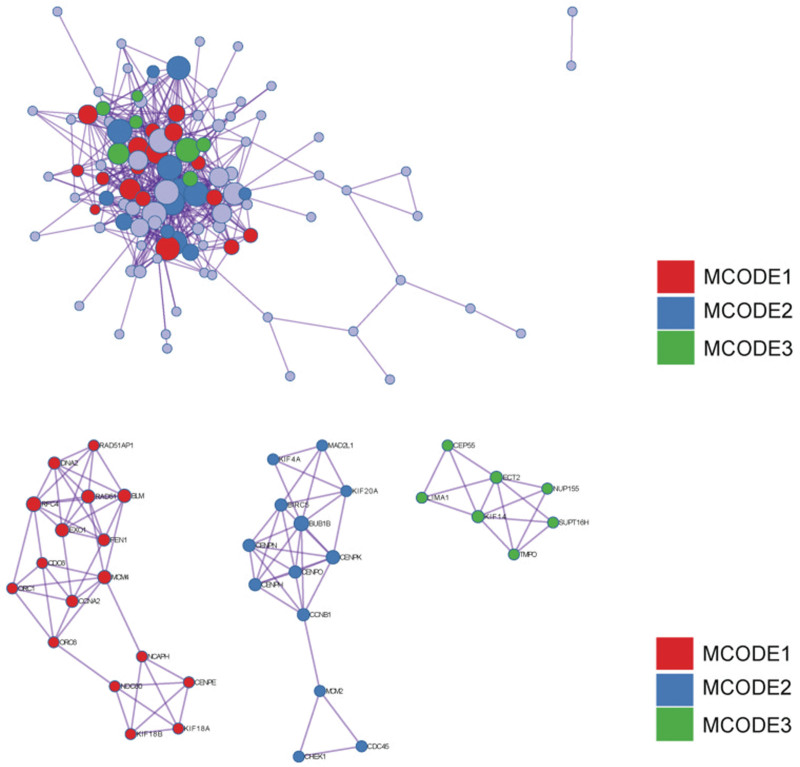
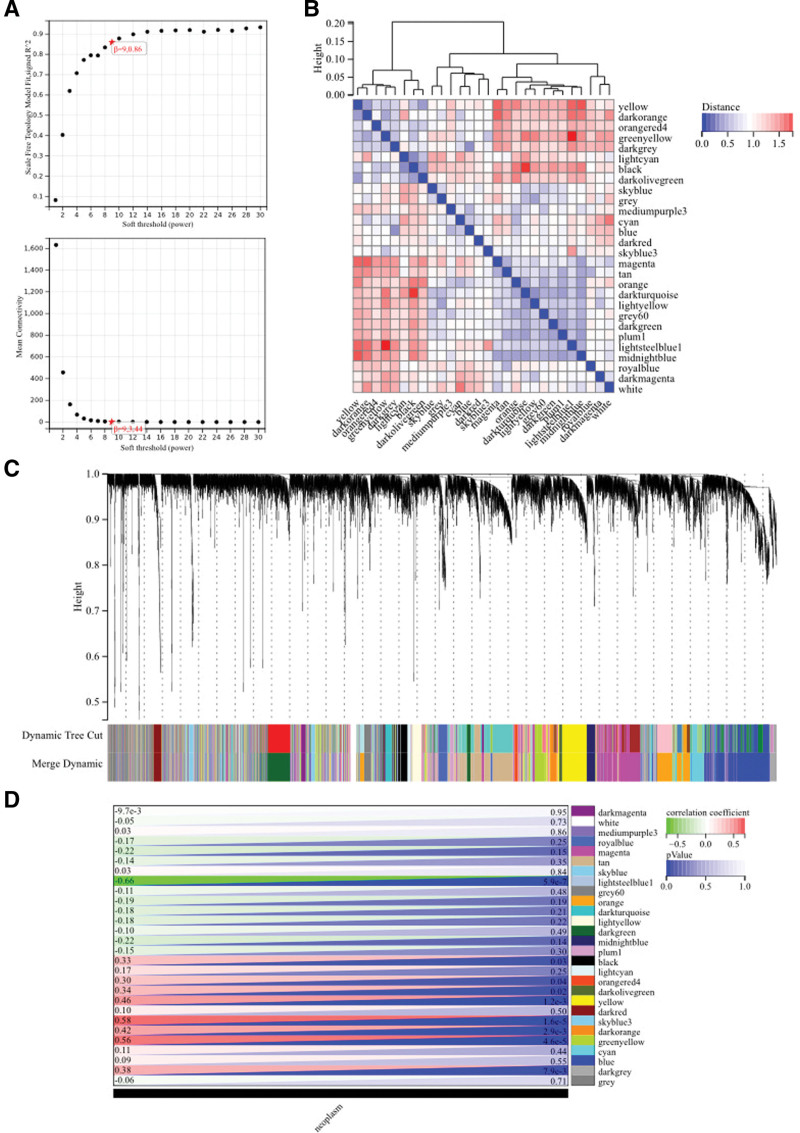
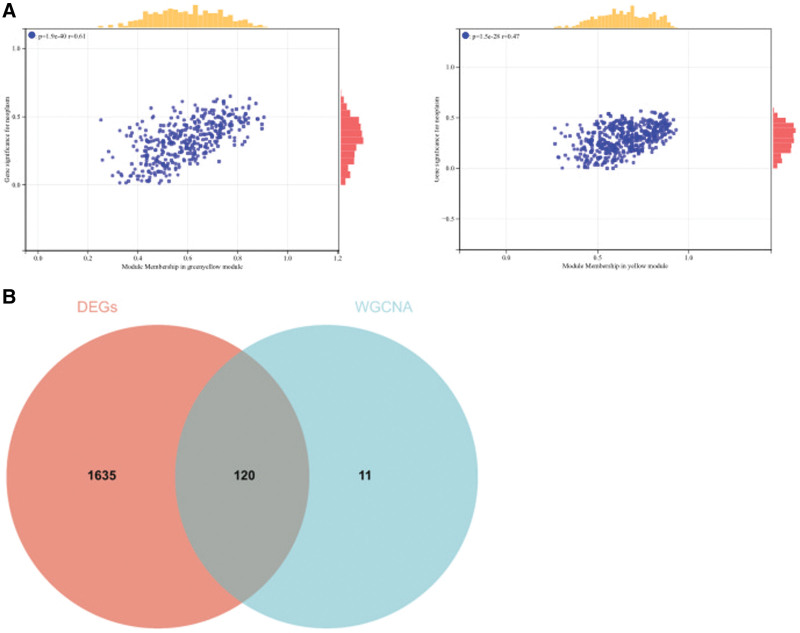
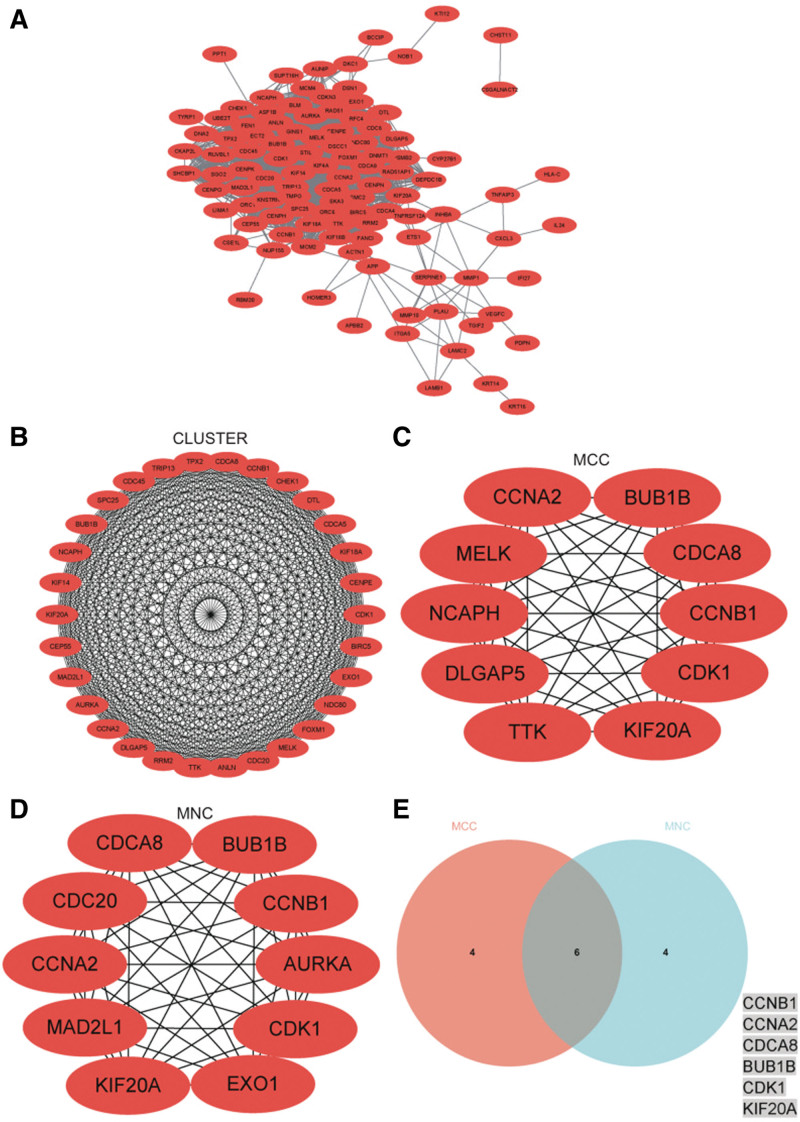
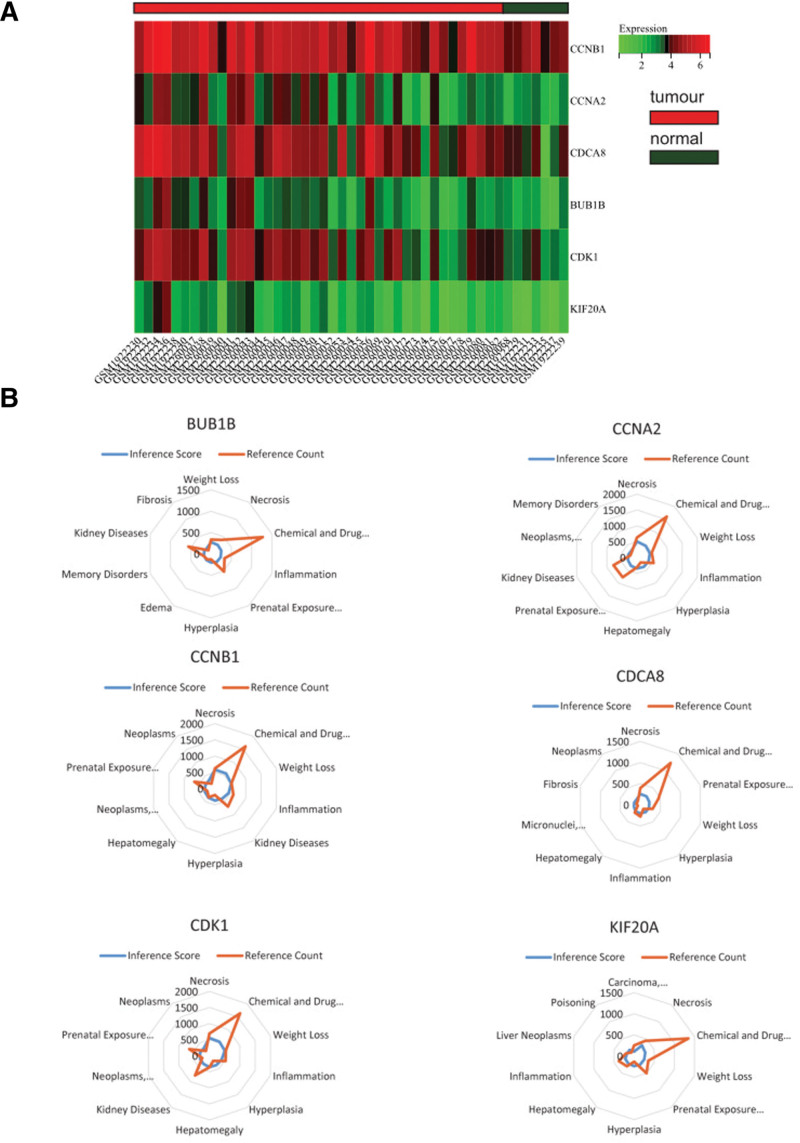
Oral squamous cell carcinoma (OSCC) is a malignant tumor that occurs in oral cavity and is dominated by squamous cells. The relationship between CDK1, CCNA2, and OSCC is still unclear. The OSCC datasets GSE74530 and GSE85195 configuration files were downloaded from the Gene Expression Omnibus (GEO) database and were derived from platforms GPL570 and GPL6480. Differentially expressed genes (DEGs) were screened. The weighted gene co-expression network analysis, functional enrichment analysis, gene set enrichment analysis, construction and analysis of protein-protein interaction (PPI) network, Comparative Toxicogenomics Database analysis were performed. Gene expression heatmap was drawn. TargetScan was used to screen miRNAs that regulate central DEGs. A total of 1756 DEGs were identified. According to Gene Ontology (GO) analysis, they were predominantly enriched in processes related to organic acid catabolic metabolism, centromeric, and chromosomal region condensation, and oxidoreductase activity. In Kyoto Encyclopedia of Genes and Genomes (KEGG) analysis, the DEGs were mainly concentrated in metabolic pathways, P53 signaling pathway, and PPAR signaling pathway. Weighted gene co-expression network analysis was performed with a soft-thresholding power set at 9, leading to the identification of 6 core genes (BUB1B, CCNB1, KIF20A, CCNA2, CDCA8, CDK1). The gene expression heatmap revealed that core genes (CDK1, CCNA2) were highly expressed in OSCC samples. Comparative Toxicogenomics Database analysis demonstrated associations between the 6 genes (BUB1B, CCNB1, KIF20A, CCNA2, CDCA8, CDK1) and oral tumors, precancerous lesions, inflammation, immune system disorders, and tongue tumors. The associated miRNAs for CDK1 gene were hsa-miR-203a-3p.2, while for CCNA2 gene, they were hsa-miR-6766-3p, hsa-miR-4782-3p, and hsa-miR-219a-5p. CDK1 and CCNA2 are highly expressed in OSCC. The higher the expression of CDK1 and CCNA2, the worse the prognosis.
Copyright © 2024 the Author(s). Published by Wolters Kluwer Health, Inc.
Conflict of interest statement
The authors have no conflicts of interest to disclose.
Figures
References
-
- Chamoli A, Gosavi AS, Shirwadkar UP, et al. Overview of oral cavity squamous cell carcinoma: risk factors, mechanisms, and diagnostics. Oral Oncol. 2021;121:105451. - PubMed
-
- Saalim M, Sansare K, Karjodkar FR, et al. The prevalence of oral squamous cell carcinoma with oral submucous fibrosis. J Cancer Res Ther. 2021;17:1510–4. - PubMed
-
- Vitório JG, Duarte-Andrade FF, Dos Santos Fontes Pereira T, et al. Metabolic landscape of oral squamous cell carcinoma. Metabolomics. 2020;16:105. - PubMed
-
- McCord C, Kiss A, Magalhaes MA, et al. Oral squamous cell carcinoma associated with precursor lesions. Cancer Prev Res (Phila). 2021;14:873–84. - PubMed
MeSH terms
Substances
LinkOut - more resources
Full Text Sources
Medical
Molecular Biology Databases
Research Materials
Miscellaneous
