. 2024 Apr 20;24(1):128.
doi: 10.1186/s12866-024-03274-9.

Decoding the role of oxidative stress resistance and alternative carbon substrate assimilation in the mature biofilm growth mode of Candida glabrata

Affiliations

Decoding the role of oxidative stress resistance and alternative carbon substrate assimilation in the mature biofilm growth mode of Candida glabrata

Khem Raj et al. BMC Microbiol. .

Abstract

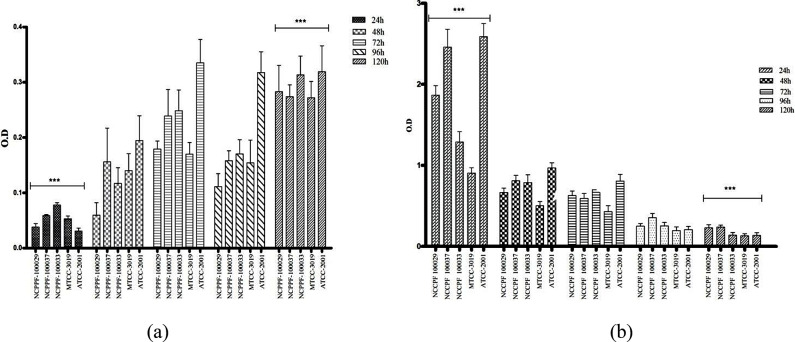
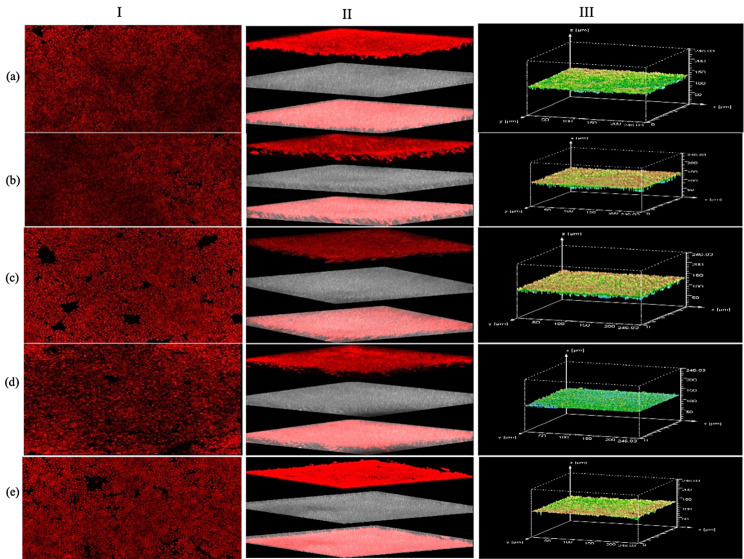
Background: Biofilm formation is viewed as a vital mechanism in C. glabrata pathogenesis. Although, it plays a significant role in virulence but transcriptomic architecture and metabolic pathways governing the biofilm growth mode of C. glabrata remain elusive. The present study intended to investigate the genes implicated in biofilm growth phase of C. glabrata through global transcriptomic approach.

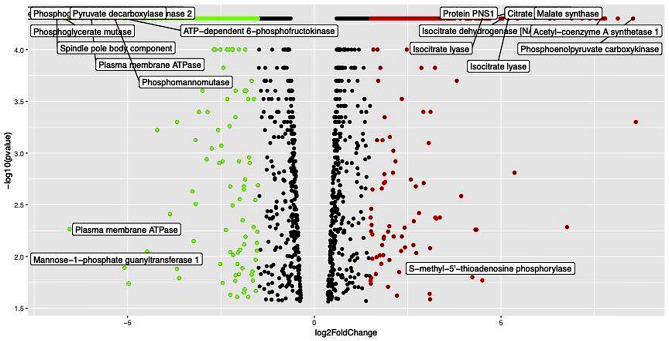
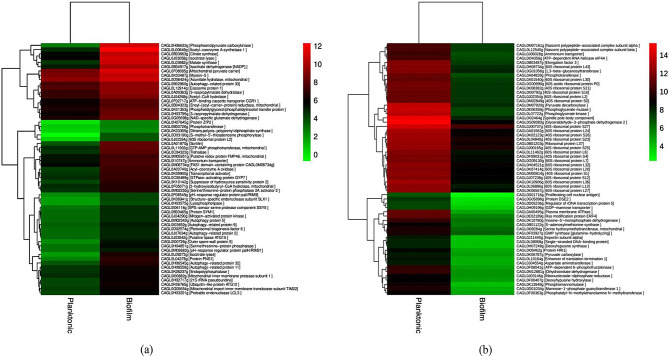
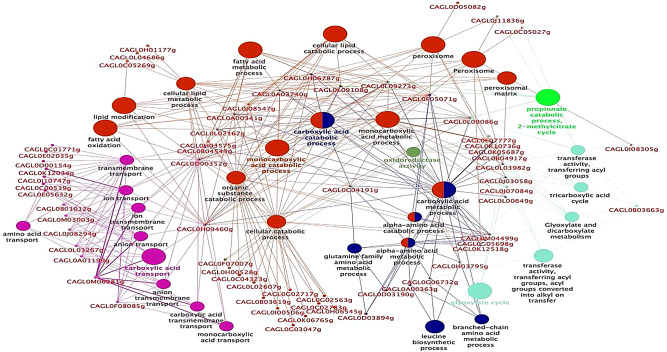
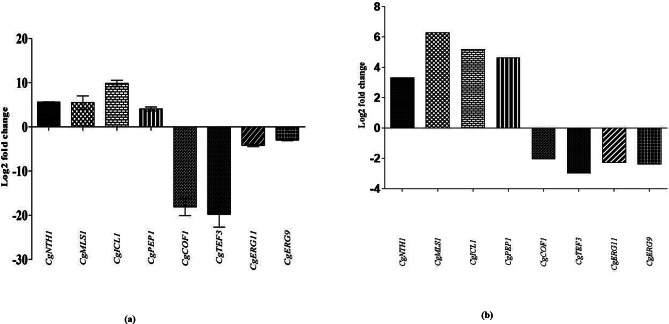
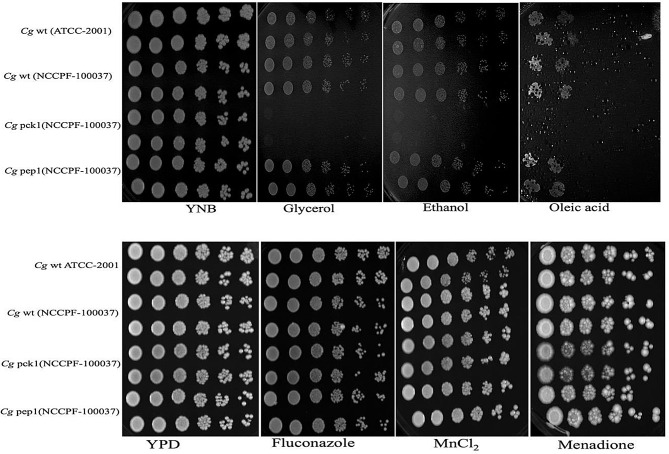
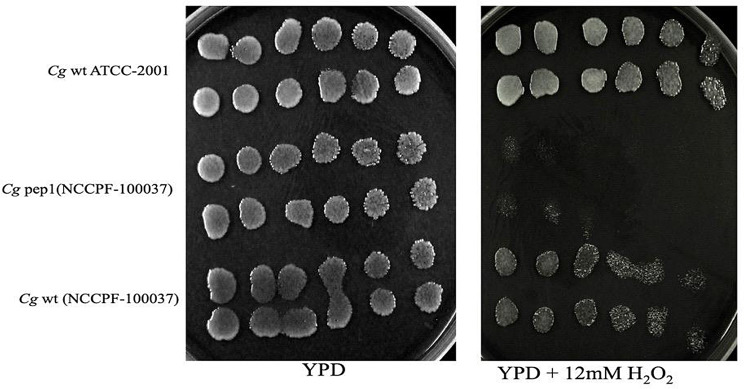
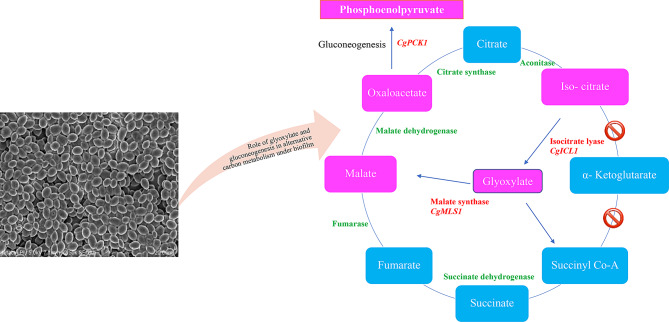
Results: Functional analysis of Differentially expressed genes (DEGs) using gene ontology and pathways analysis revealed that upregulated genes are involved in the glyoxylate cycle, carbon-carbon lyase activity, pre-autophagosomal structure membrane and vacuolar parts whereas, down- regulated genes appear to be associated with glycolysis, ribonucleoside biosynthetic process, ribosomal and translation process in the biofilm growth condition. The RNA-Seq expression of eight selected DEGs (CgICL1, CgMLS1, CgPEP1, and CgNTH1, CgERG9, CgERG11, CgTEF3, and CgCOF1) was performed with quantitative real-time PCR (RT-qPCR). The gene expression profile of selected DEGs with RT-qPCR displayed a similar pattern of expression as observed in RNA-Seq. Phenotype screening of mutant strains generated for genes CgPCK1 and CgPEP1, showed that Cgpck1∆ failed to grow on alternative carbon substrate (Glycerol, Ethanol, Oleic acid) and similarly, Cgpep1∆ unable to grow on YPD medium supplemented with hydrogen peroxide. Our results suggest that in the absence of glucose, C. glabrata assimilate glycerol, oleic acid and generate acetyl coenzyme-A (acetyl-CoA) which is a central and connecting metabolite between catabolic and anabolic pathways (glyoxylate and gluconeogenesis) to produce glucose and fulfil energy requirements.

Conclusions: The study was executed using various approaches (transcriptomics, functional genomics and gene deletion) and it revealed that metabolic plasticity of C. glabrata (NCCPF-100,037) in biofilm stage modulates its virulence and survival ability to counter the stress and may promote its transition from commensal to opportunistic pathogen. The observations deduced from the present study along with future work on characterization of the proteins involved in this intricate process may prove to be beneficial for designing novel antifungal strategies.

Keywords: C. glabrata; Alternative carbon substrate assimilation; Biofilm; Oxidative stress; Transcriptomics.


Conflict of interest statement

The authors have declared that no competing interests exist.

Figures

Fig. 1
Fig. 1
Comparative evaluation of the biofilm forming potential of five different strains of C. glabrata assessed by the crystal violet and XTT assay: (a) Comparative biomass formation by five strains of C. glabrata evaluated using crystal violet assay, all strains showed an increasing trend of biomass up to 120 h. X-axis represents the time of incubation up to 120 h of all strains under investigation, and Y-axis represents the optical density (OD) values taken at 690 nm (b) Metabolic activity of cells in the biofilm growth phase of all the tested C. glabrata strains evaluated using XTT assay and monitored for 120 h at different time points showed a decreasing trend of OD in all the strains. The ODs presented are the mean +/- standard deviation of three individual ODs evaluated in triplicate with p value < 0.05. Bar graph were drawn using GraphPad Prism (v 5.01)
Fig. 2
Fig. 2
CLSM photomicrographs of biofilm growth phase of five strains of C. glabrata: (a) ATCC-2001; (b) MTCC-3019; (c) NCCPF-100,037; (d) NCCPF-100,033; (e) NCCPF-100,029. Panel I (a, b, c, d and e) represents 1-D CLSM images of C. glabrata strains ATCC-2001, MTCC-3019, NCCPF- 100,037, NCCPF-100,033 & NCCPF-100,029, respectively. Panel II (a, b, c, d, and e) represents the images clicked through different contrast and sections to show the overall morphology and architecture of biofilm of all strains in a similar order. Panel III (a, b, c, d, and e) represents one stack out of many stacks captured and a side view reconstructed by Leica application suite (LAS − X) software to visualize the 3-D projection of biofilm thickness of all strains observed
Fig. 3
Fig. 3
Volcano plot of the DEGs in planktonic and biofilm growth phase of C. glabrata. DEGs under individual experimental conditions (planktonic and biofilm) of C. glabrata. The X- axis represents the normalised expression of genes in terms of log2 fold change (log2FC), and dots in green and red color demonstrate the significant downregulated and upregulated genes respectively. Y- axis represents statistical significance (p-value)
Fig. 4
Fig. 4
Hierarchical clustering significant DEGs in biofilm growth mode: Shows the top significant up-regulated genes, columns represent the planktonic and biofilm growth condition of C. glabrata(Fig. 4a) similarly the up-regulated genes are shown in (Fig. 4b) .Expression of the significant DEGs (listed on the right side of the columns along their encoded proteins) plotted according to their normalized log2FC (FPKM) values in z-scores. Gene expression values of different DEGs are presented in color key code of heatmap with a scale bar of with a heat map of a color scale bar 0–14
Fig. 5
Fig. 5
KEGG pathway network of up-regulated genes in the biofilm growth phase of a clinical isolate ofC. glabrata: Network analysis of the GO and KEGG pathway of highly significant top upregulated genes involved in the biofilm formation of C. glabrata. Pathways depicted by nodes and edges shared by common genes with kappa score 0.4 and p-value < 0.05 are displayed with respective colors representing the BP, CC, and MF of the significantly upregulated genes associated with the biofilm growth phase of C. glabrata
Fig. 6
Fig. 6
Verification of RNA-Seq expression of DEGs with RT-qPCR:The differential expression of selected genes (CgMLS1, CgICL1, CgPEP1, CgNTH1, CgCOF1, CgTEF3, CgERG9, and CgERG11) verified using RT-qPCR. (a) Shows RT-qPCR expression of up-regulated (CgMLS1, CgICL1, CgPEP1, and CgNTH1) and down-regulated (CgCOF1, CgTEF3, CgERG9, and CgERG11) genes, quantified in terms of log2FC ∆∆CTvalues.(b)Shows the RNA-Seq expression profile of the same genes, measured terms of log2FC of FPKM values. The bars represented are the mean of three individual fold change value evaluated in triplicate with calculated +/- standard deviation at p value < 0.05. Bar graph has been drawn using GraphPad Prism (v 5.01)
Fig. 7
Fig. 7
Phenotype profiling of mutant and wild strains ofC. glabrataon different carbon substrates and under tested stressors: The overnight grown cultures of standard strain Cgwt ATCC-2001, wild type clinical strain Cgwt (NCCPF-100,037), and mutant strains Cgpck1∆(NCCPF-100,037) Cgpep1∆ (NCCPF-100,037) were spotted over YNB with glucose 2%, glycerol 3%, ethanol 2%, and oleic acid 2%. YPD media with fluconazole-16 µg/ mL, 8 mM, manganese chloride (MnCl2) – 3 mM, cell-wall stressor for yeast cell menadione − 16 µg/mL). Images of plates were captured after incubation of 24–72 h
Fig. 8
Fig. 8
Phenotype profiling of mutant and wild strains ofC. glabrataunder oxidative stress: The overnight grown cultures of standard strain Cgwt ATCC-2001, wild type clinical strain Cgwt (NCCPF-100,037), and mutant strains Cgpck1∆ (NCCPF-100,037) Cgpep1∆ (NCCPF-100,037) were spotted over YPD + 12 mM hydrogen peroxide. Images of plates were captured after incubation of 24–72 h
Fig. 9
Fig. 9
Glyoxylate and gluconeogenesis pathways of carbon substrate metabolism in biofilm growth mode of C. glabrata(NCCPF-100,037)

Similar articles

References

    1. Khatib R, Johnson LB, Fakih MG, Riederer K, Briski L. Current trends in candidemia and species distribution among adults: Candida Glabrata surpasses Candida albicans in diabetic patients and abdominal sources. Mycoses. 2016;59:781–6. doi: 10.1111/myc.12531. - DOI - PubMed
    1. Chakrabarti A, Sood P, Rudramurthy SM, Chen S, Jillwin J, Iyer R, et al. Characteristics, outcome and risk factors for mortality of paediatric patients with ICU-acquired candidemia in India: a multicentre prospective study. Mycoses. 2020;63:1149–63. doi: 10.1111/myc.13145. - DOI - PubMed
    1. Pfaller MA, Diekema DJ, Turnidge JD, Castanheira M, Jones RN. Twenty years of the SENTRY anti-fungal surveillance program: results for Candida species from 1997–2016. Open Forum Infect Dis. 2019;6 Supplement1:S79–94. doi: 10.1093/ofid/ofy358. - DOI - PMC - PubMed
    1. Pfaller MA, Andes DR, Diekema DJ, Horn DL, Reboli AC, Rotstein C, et al. Epidemiology and outcomes of invasive candidiasis due to non-albicans species of Candida in 2,496 patients: data from the prospective antifungal therapy (PATH) registry 2004–2008. PLoS ONE. 2014;9:e101510. doi: 10.1371/journal.pone.0101510. - DOI - PMC - PubMed
    1. Orsetti E, Brescini L, Mazzanti S, Trave F, Morroni G, Masucci A, et al. Characterisation of candidemia in patients with recent surgery: a 7-year experience. Mycoses. 2019;62:1056–63. doi: 10.1111/myc.12988. - DOI - PubMed