. 2024 Apr 19;147(1):73.
doi: 10.1007/s00401-024-02720-2.

Abundant transcriptomic alterations in the human cerebellum of patients with a C9orf72 repeat expansion

Affiliations

Abundant transcriptomic alterations in the human cerebellum of patients with a C9orf72 repeat expansion

Evan Udine et al. Acta Neuropathol. .

Abstract

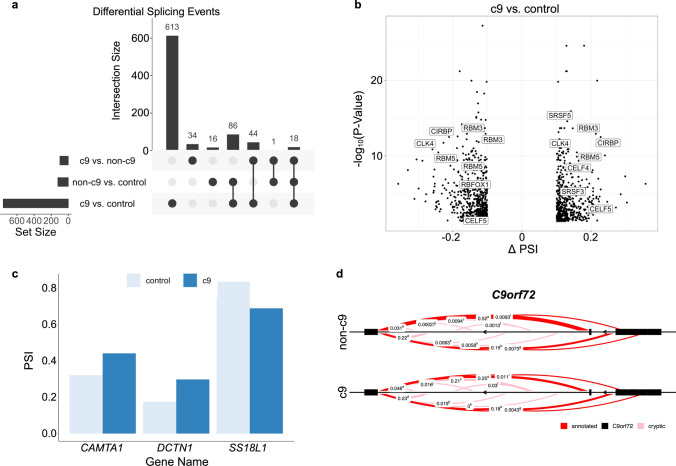
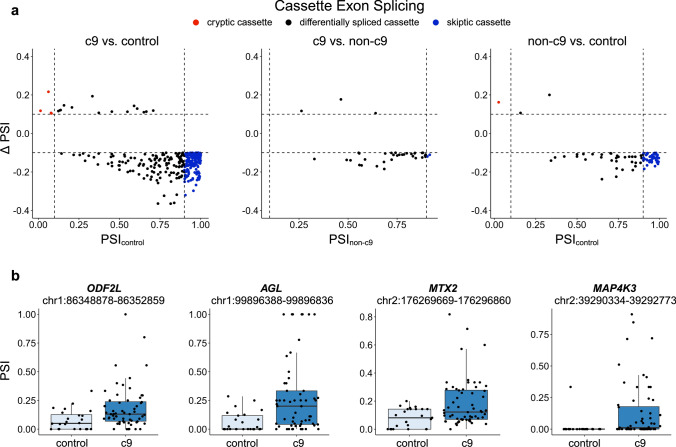
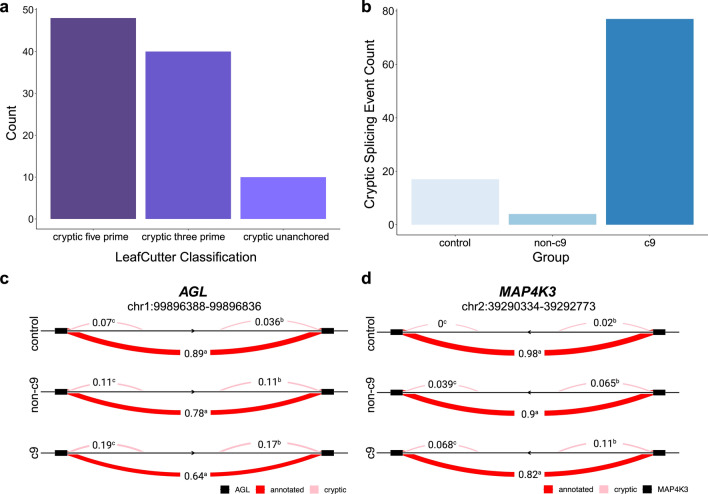
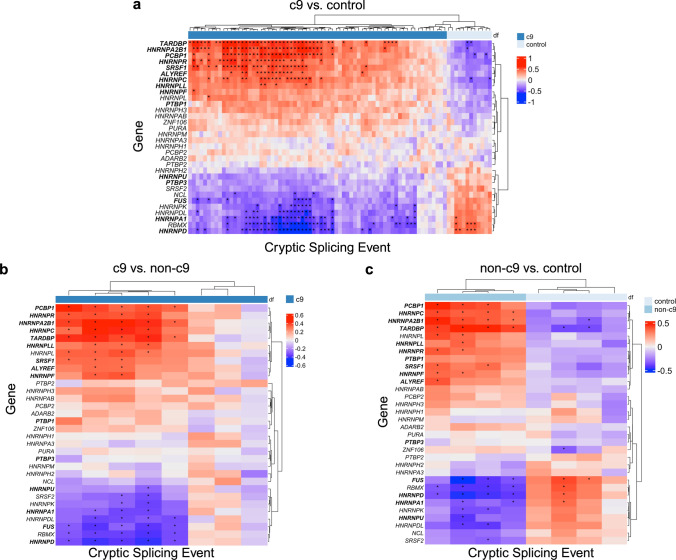
The most prominent genetic cause of both amyotrophic lateral sclerosis (ALS) and frontotemporal lobar degeneration (FTLD) is a repeat expansion in the gene C9orf72. Importantly, the transcriptomic consequences of the C9orf72 repeat expansion remain largely unclear. Here, we used short-read RNA sequencing (RNAseq) to profile the cerebellar transcriptome, detecting alterations in patients with a C9orf72 repeat expansion. We focused on the cerebellum, since key C9orf72-related pathologies are abundant in this neuroanatomical region, yet TDP-43 pathology and neuronal loss are minimal. Consistent with previous work, we showed a reduction in the expression of the C9orf72 gene and an elevation in homeobox genes, when comparing patients with the expansion to both patients without the C9orf72 repeat expansion and control subjects. Interestingly, we identified more than 1000 alternative splicing events, including 4 in genes previously associated with ALS and/or FTLD. We also found an increase of cryptic splicing in C9orf72 patients compared to patients without the expansion and controls. Furthermore, we demonstrated that the expression level of select RNA-binding proteins is associated with cryptic splice junction inclusion. Overall, this study explores the presence of widespread transcriptomic changes in the cerebellum, a region not confounded by severe neurodegeneration, in post-mortem tissue from C9orf72 patients.

Keywords: Amyotrophic lateral sclerosis; C9orf72; Cryptic exons; Frontotemporal lobar degeneration; Transcriptomics.


Conflict of interest statement

MDJ and RR hold a patent on methods to screen for the C9orf72 hexanucleotide repeat expansion.

Figures

Fig. 1
Fig. 1
Differential expression analyses. ac Volcano plot of differentially expressed genes. a C9orf72 expansion patients compared to controls (c9 vs. control). b C9orf72 expansion patients compared to non-C9orf72 expansion patients (c9 vs. non-c9) c, and non-C9orf72 expansion patients compared to controls (non-c9 vs. control). Significantly differentially expressed (FDR < 0.05) homeobox genes are displayed. The x-axis shows fold-changes and the y-axis -log10 of P Values. Fold-changes are scaled to 0 for visualization purposes. d, e Boxplots of 2 differentially expressed genes including d C9orf72 (FDR = 3.65E-09) and e SHOX2 (FDR = 2.15E-21). Residual expression including markers for cell types are displayed. Boxplots represent the median with interquartile range (IQR)
Fig. 2
Fig. 2
Differential splicing analysis. a Upset plot to demonstrate number of genes that contain at least one differential splicing event for each comparison. b Volcano plot of differentially spliced intron junctions (FDR < 0.05) for C9orf72 expansion patients (c9) compared to controls (c9 vs. control). The x-axis shows the change in percent spliced in (Δ PSI) and the y-axis shows -log10 of the P Value. Genes that contain differentially spliced clusters in significantly enriched pathways are displayed. c Barplot of PSI for the 3 differentially spliced ALS/FTLD associated genes in the c9 vs. control analysis. d Sashimi plot of the cryptic splicing event in C9orf72 for c9 patients and non-C9orf72 expansion patients (non-c9). Pink lines represent cryptic splice junctions as determined by LeafCutter and solid red lines represent annotated splice junctions. Numbers represent the average inclusion for that splice junction
Fig. 3
Fig. 3
Cassette exon differential splicing. a Scatter plots of differentially spliced cassette exons. Left: Scatter plot displaying the percent spliced in (PSI) for control samples on the x-axis and change in PSI (Δ PSI) on the y-axis comparing C9orf72 expansion patients (c9) to controls (c9 vs. control). Middle: Scatter plot displaying the PSI for non-C9orf72 expansion patients (non-c9) on the x-axis and Δ PSI on the y-axis comparing c9 patients vs. non-c9 patients (c9 vs. non-c9). Right: Scatter plot displaying the PSI for control samples on the x-axis and Δ PSI on the y-axis comparing non-c9 patients to controls (non-c9 vs. control). Cryptic cassette exons are colored red and skiptic cassette exons are colored blue. b Boxplots of cassette exon percent inclusion for the 4 cryptic cassette exons identified in the c9 vs. control analysis, which includes ODF2L (FDR = 0.028), AGL (FDR = 0.002), MTX2 (FDR = 0.002), and MAP4K3 (FDR = 1.39E-06). Boxplots represent the median with interquartile range (IQR)
Fig. 4
Fig. 4
Annotation-based cryptic splicing. a Barplot showing number of differential splicing events for the 3 types of splicing events that we considered to be cryptic by annotation identified across all 3 pairwise comparisons. b Barplot showing the number of cryptic exons assigned to each group. c Sashimi plot of AGL (left) and MAP4K3 (right) cryptic exons. These events were identified in both cryptic cassette and cryptic annotation analyses. Pink lines represent cryptic splice junctions as determined by LeafCutter and solid red lines represent annotated splice junctions. Numbers represent the average inclusion for that splice junction. Control = control subjects, non-c9 = patients without a C9orf72 repeat expansion, c9 = patients with a C9orf72 repeat expansion
Fig. 5
Fig. 5
Select cryptic splicing events. a Left: Sashimi plot of STK10 cryptic exon. Pink lines represent cryptic splice junctions as determined by LeafCutter and solid red lines represent annotated splice junctions. Numbers represent percent spliced in for that group. Right: Boxplot of intron junction counts for the cryptic splicing event shown in the sashimi plot. Bottom: Long-read sequencing coverage for 2 samples, 1 c9 patient (red) and 1 control subject (blue). The number represents the number of reads spanning that splice junction. b Left: Sashimi plot of EFR3A cryptic exon. Pink lines represent cryptic splice junctions as determined by LeafCutter and solid red lines represent annotated splice junctions. Numbers represent percent spliced in for that group. Right: Boxplot of intron junction counts for the cryptic splicing event shown in the sashimi plot. Bottom: Long-read sequencing coverage for 2 samples, 1 c9 patient (red) and 1 control subject (blue). Control = control subjects, non-c9 = patients without a C9orf72 repeat expansion, c9 = patients with a C9orf72 repeat expansion. Boxplots represent the median with interquartile range (IQR)
Fig. 6
Fig. 6
Cryptic splicing correlations. ac Correlation heatmaps between cryptic splicing events in the annotation-based analysis and residual gene expression values for select RNA-binding proteins, a when comparing C9orf72 expansion patients to controls (c9 vs. control), b C9orf72 expansion patients to non-C9orf72 expansion patients (c9 vs. non-c9), and c non-C9orf72 expansion patients to controls (non-c9 vs. control). Colors represent Pearson’s correlation coefficient. Stars indicate significant correlations after correction for multiple testing (Bonferroni P Value < 0.05). Differentially expressed genes are bolded

References

    1. Al-Sarraj S, King A, Troakes C, Smith B, Maekawa S, Bodi I, Rogelj B, Al-Chalabi A, Hortobagyi T, Shaw CE. p62 positive, TDP-43 negative, neuronal cytoplasmic and intranuclear inclusions in the cerebellum and hippocampus define the pathology of C9orf72-linked FTLD and MND/ALS. Acta Neuropathol. 2011;122:691–702. doi: 10.1007/s00401-011-0911-2. - DOI - PubMed
    1. Arnold ES, Ling SC, Huelga SC, Lagier-Tourenne C, Polymenidou M, Ditsworth D, Kordasiewicz HB, McAlonis-Downes M, Platoshyn O, Parone PA, et al. ALS-linked TDP-43 mutations produce aberrant RNA splicing and adult-onset motor neuron disease without aggregation or loss of nuclear TDP-43. Proc Natl Acad Sci U S A. 2013;110:E736–745. doi: 10.1073/pnas.1222809110. - DOI - PMC - PubMed
    1. Ash PEA, Bieniek KF, Gendron TF, Caulfield T, Lin W-L, Dejesus-Hernandez M, van Blitterswijk MM, Jansen-West K, Paul JW, 3rd, Rademakers R, et al. Unconventional translation of C9ORF72 GGGGCC expansion generates insoluble polypeptides specific to c9FTD/ALS. Neuron. 2013;77:639–646. doi: 10.1016/j.neuron.2013.02.004. - DOI - PMC - PubMed
    1. Ayala YM, De Conti L, Avendano-Vazquez SE, Dhir A, Romano M, D'Ambrogio A, Tollervey J, Ule J, Baralle M, Buratti E, et al. TDP-43 regulates its mRNA levels through a negative feedback loop. EMBO J. 2011;30:277–288. doi: 10.1038/emboj.2010.310. - DOI - PMC - PubMed
    1. Bahia VS, Takada LT, Deramecourt V. Neuropathology of frontotemporal lobar degeneration: a review. Dement Neuropsychol. 2013;7:19–26. doi: 10.1590/S1980-57642013DN70100004. - DOI - PMC - PubMed

Publication types

MeSH terms