. 2024 May;25(5):755-763.
doi: 10.1038/s41590-024-01820-1. Epub 2024 Apr 19.

Hepatocytes coordinate immune evasion in cancer via release of serum amyloid A proteins

Affiliations

Hepatocytes coordinate immune evasion in cancer via release of serum amyloid A proteins

Meredith L Stone et al. Nat Immunol. 2024 May.

Abstract

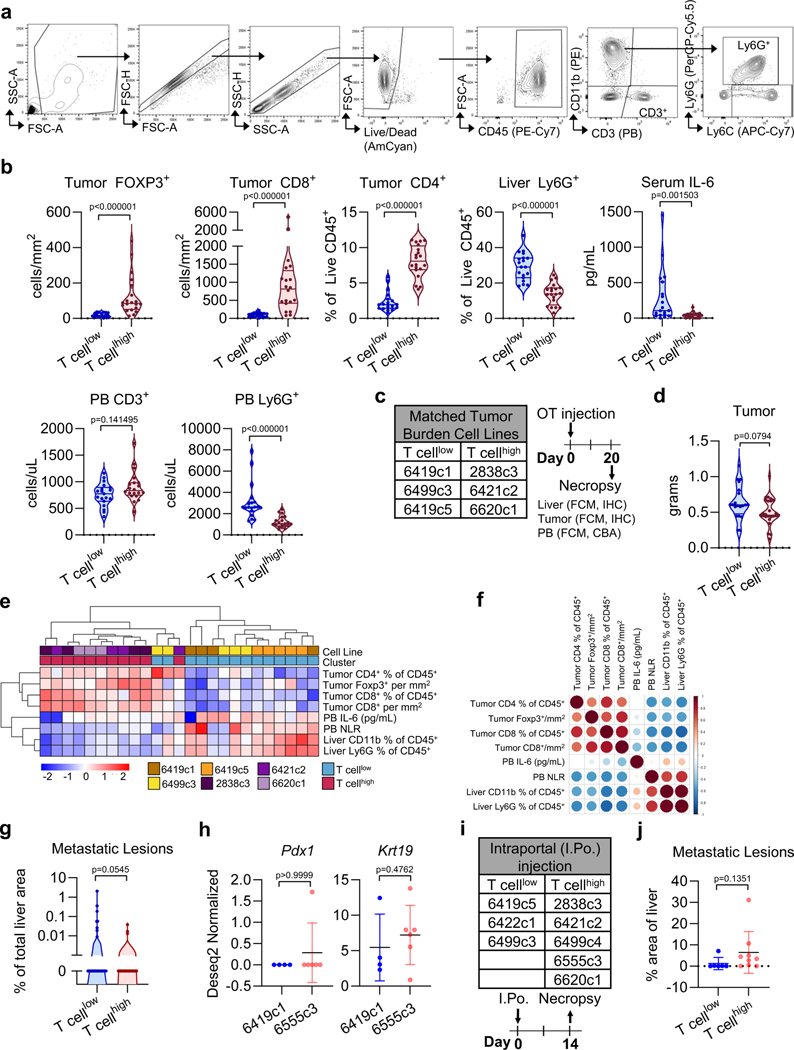
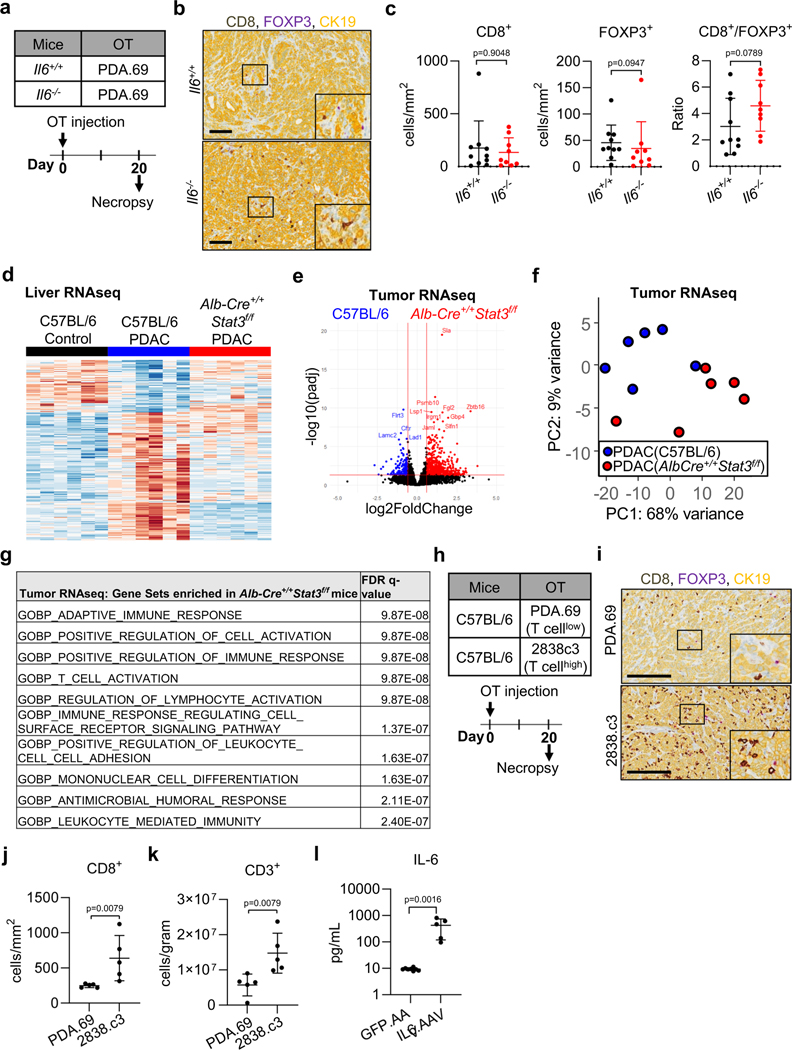
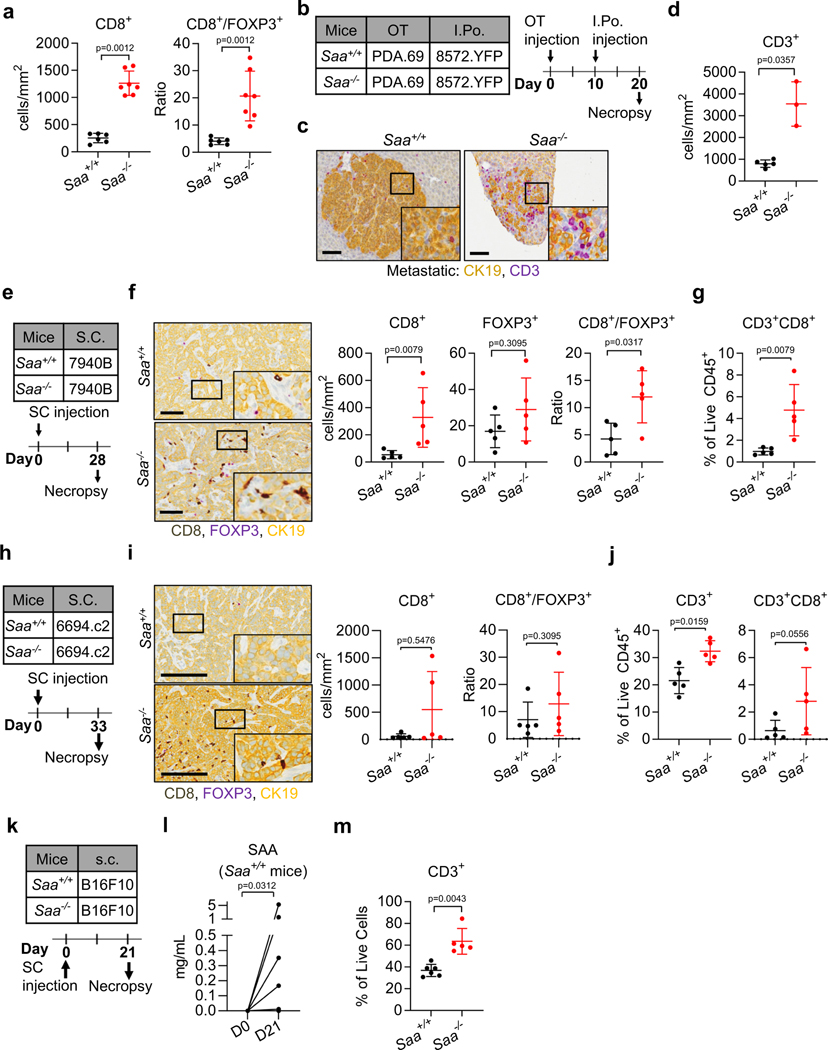
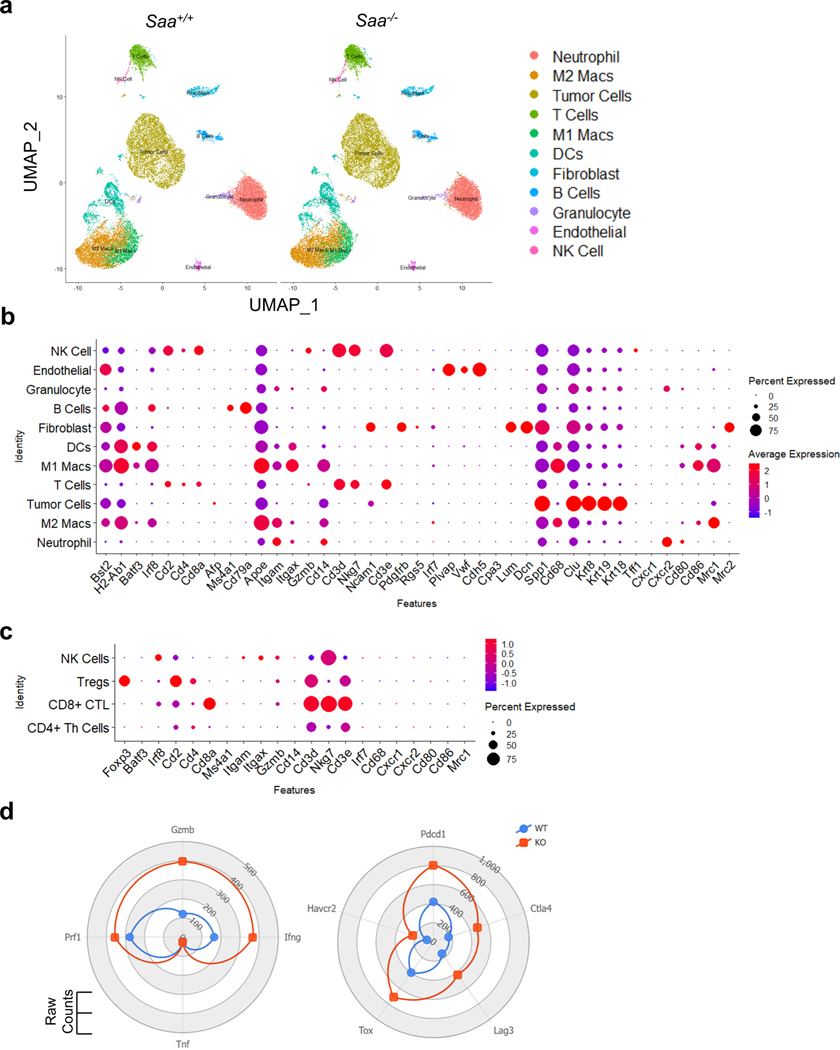
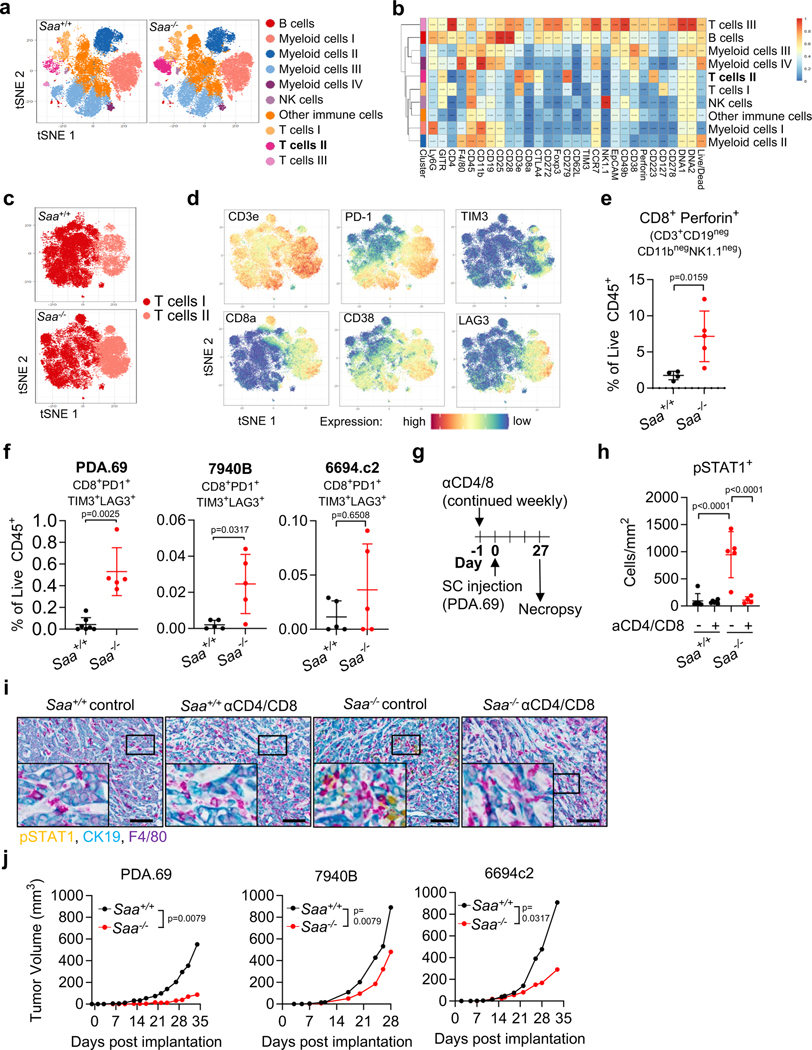
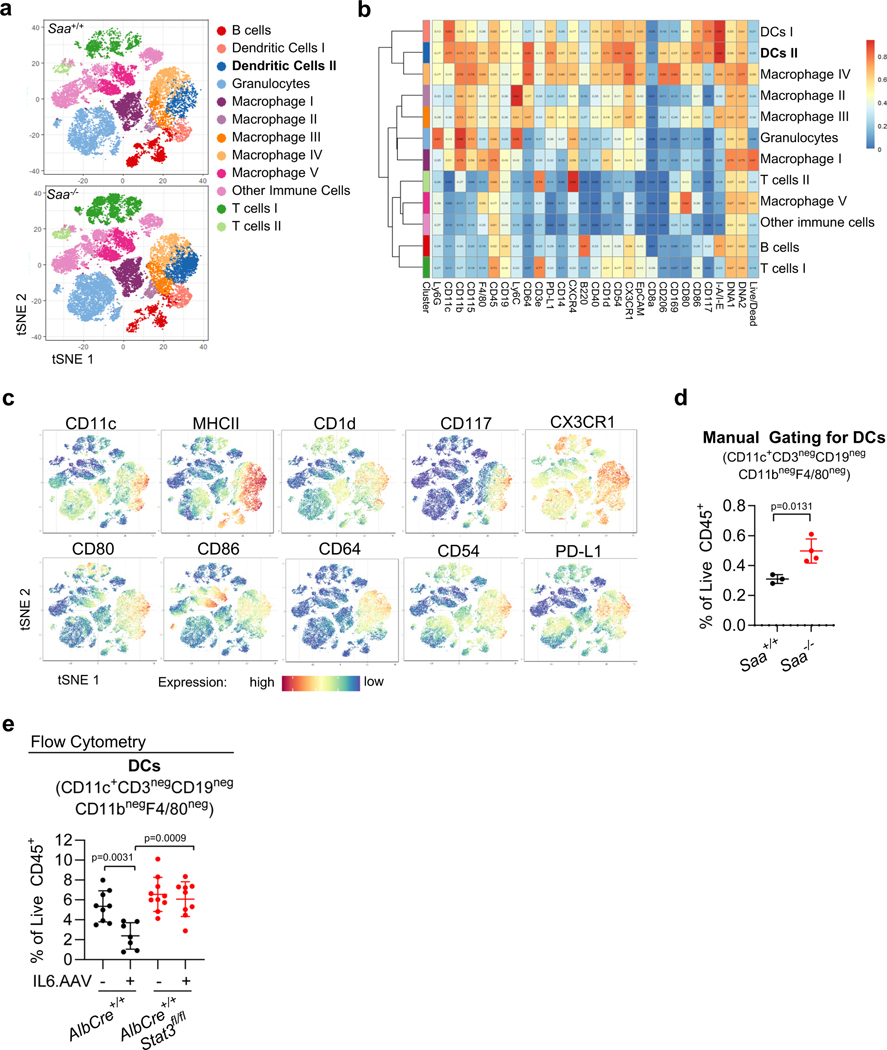
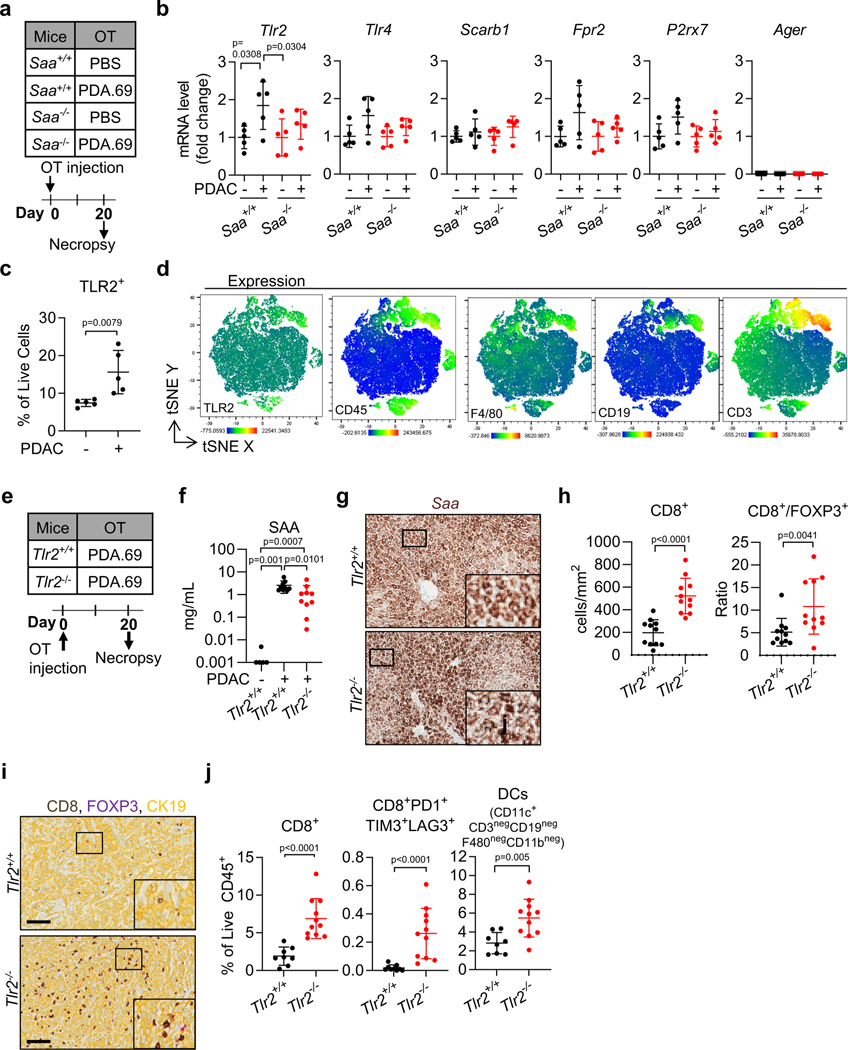
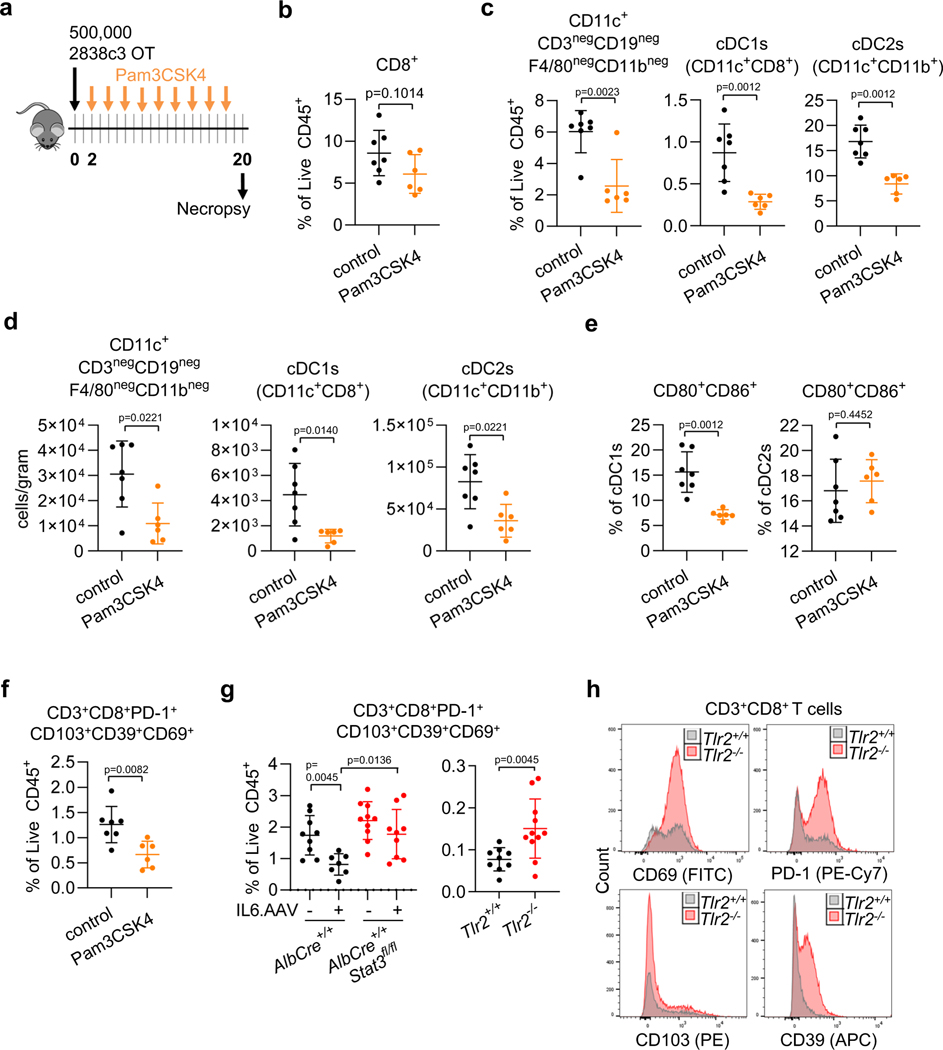
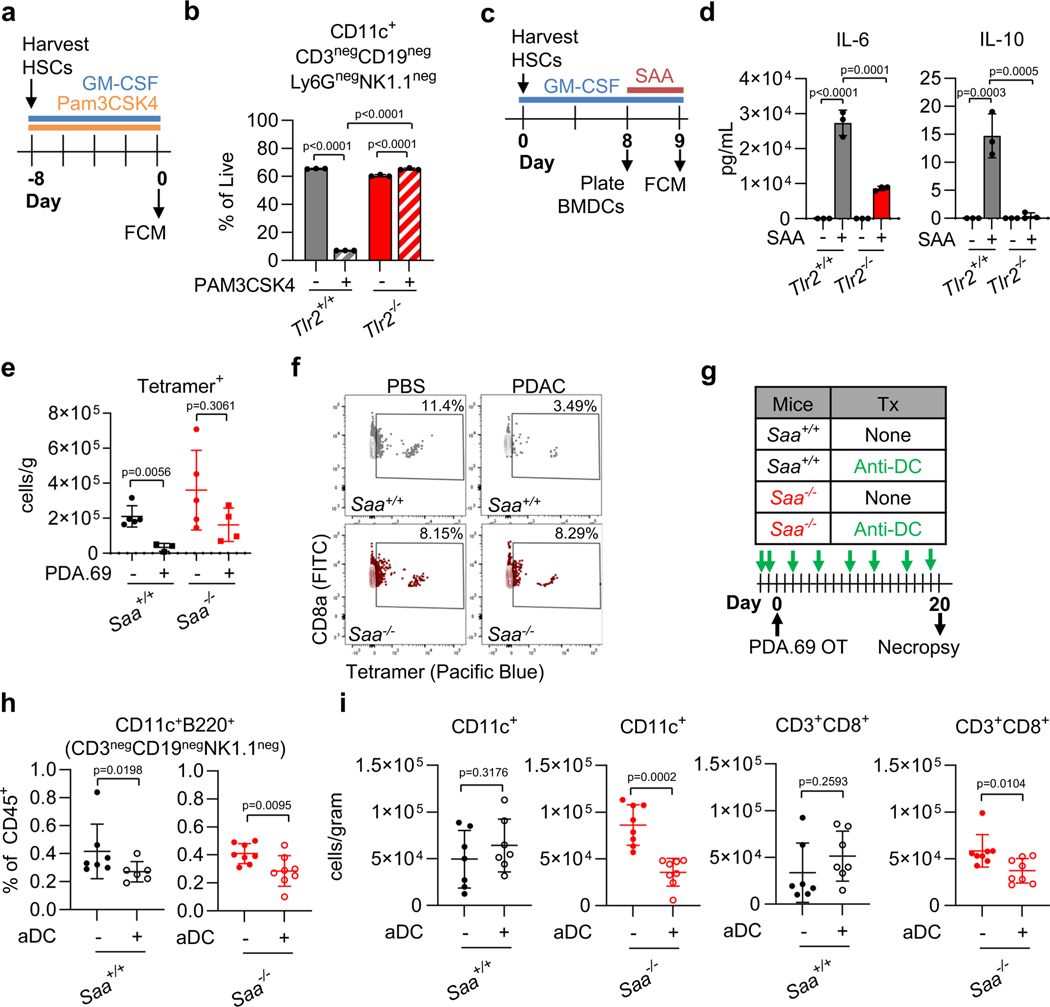
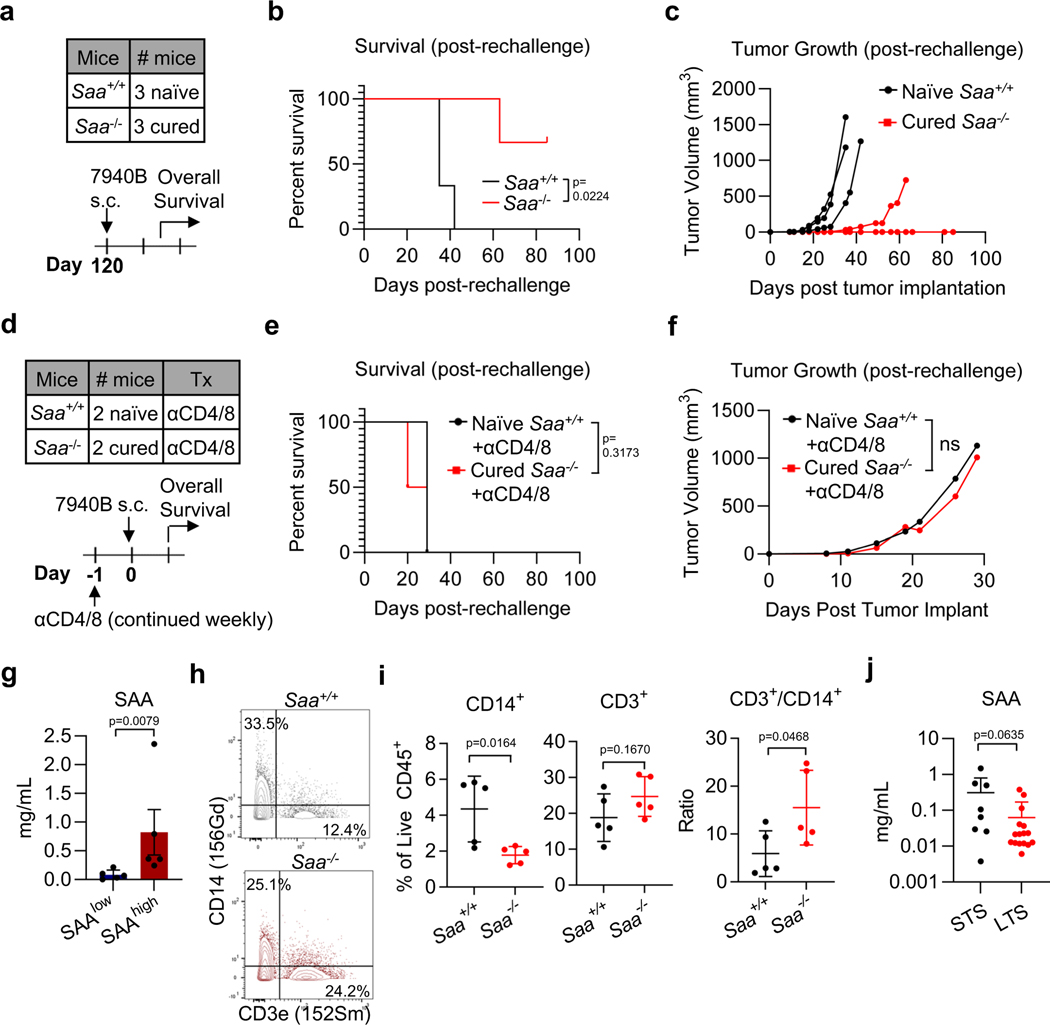
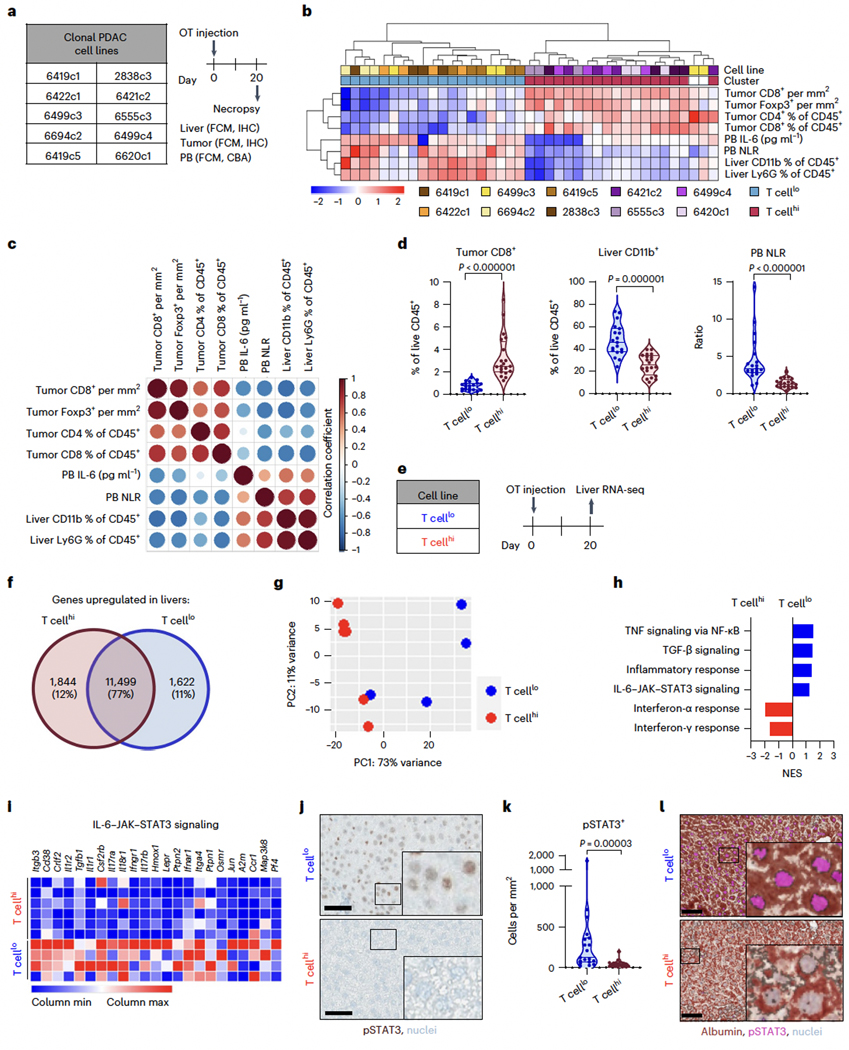
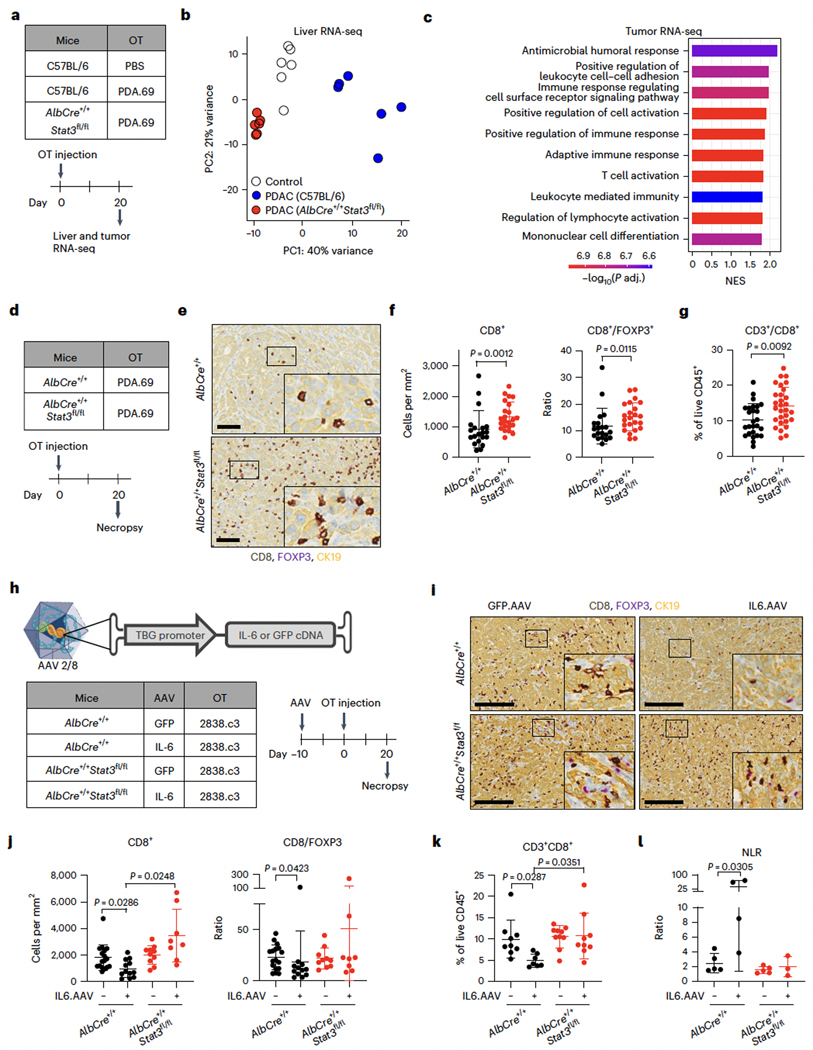
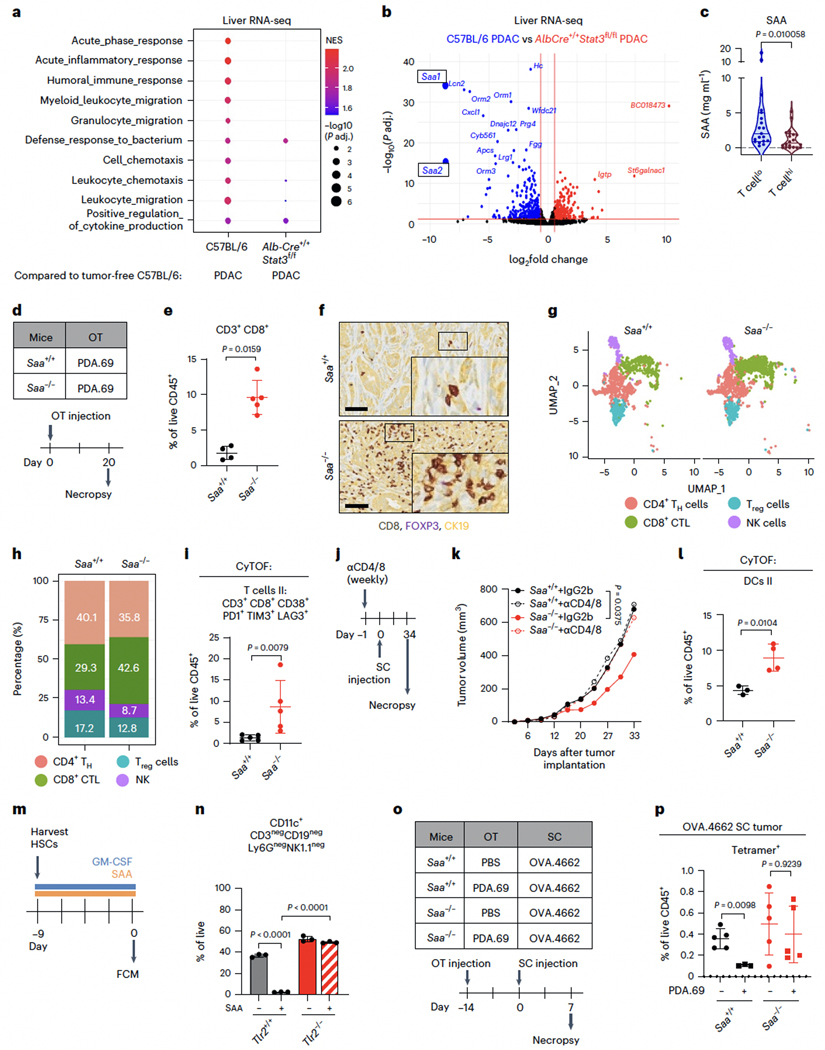
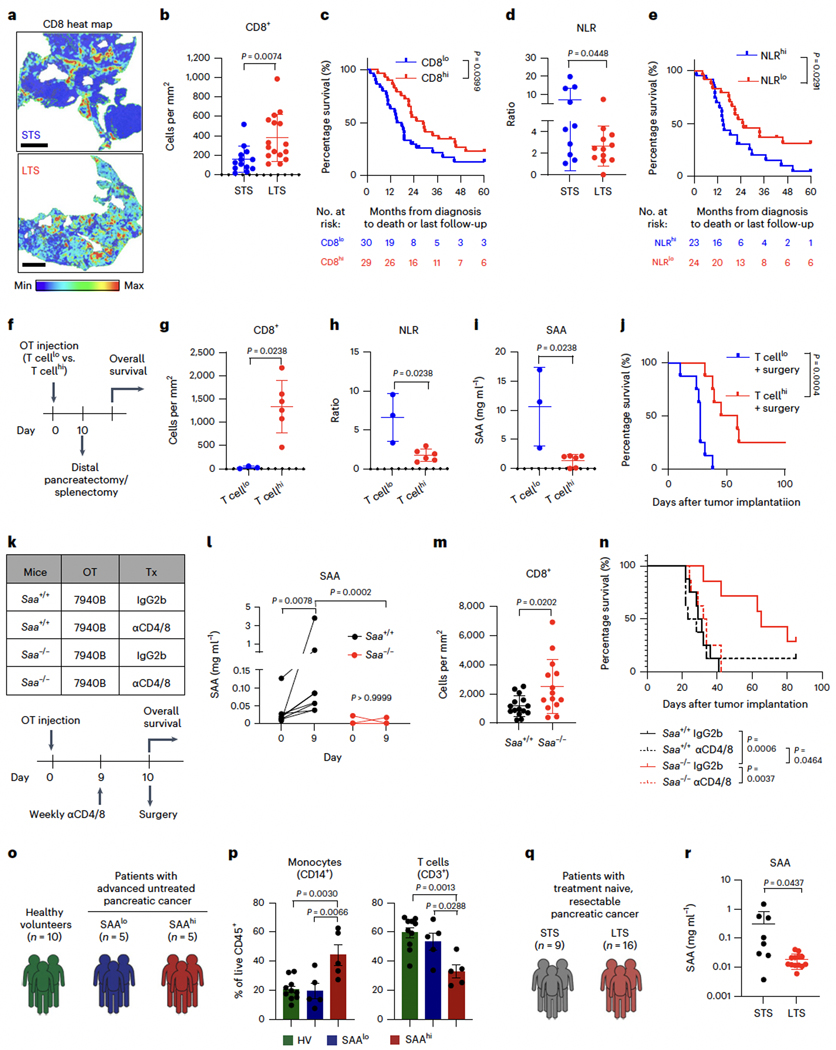
T cell infiltration into tumors is a favorable prognostic feature, but most solid tumors lack productive T cell responses. Mechanisms that coordinate T cell exclusion are incompletely understood. Here we identify hepatocyte activation via interleukin-6/STAT3 and secretion of serum amyloid A (SAA) proteins 1 and 2 as important regulators of T cell surveillance of extrahepatic tumors. Loss of STAT3 in hepatocytes or SAA remodeled the tumor microenvironment with infiltration by CD8+ T cells, while interleukin-6 overexpression in hepatocytes and SAA signaling via Toll-like receptor 2 reduced the number of intratumoral dendritic cells and, in doing so, inhibited T cell tumor infiltration. Genetic ablation of SAA enhanced survival after tumor resection in a T cell-dependent manner. Likewise, in individuals with pancreatic ductal adenocarcinoma, long-term survivors after surgery demonstrated lower serum SAA levels than short-term survivors. Taken together, these data define a fundamental link between liver and tumor immunobiology wherein hepatocytes govern productive T cell surveillance in cancer.


Figures

Extended Data Fig. 1 |
Extended Data Fig. 1 |. Liver inflammation correlates with low T cell infiltration.
a) Gating strategy used for neutrophil-to-lymphocyte ratio analysis in peripheral blood. b) Mice were implanted with orthotopic PDAC tumors as described in Fig. 1a. FOXP3+ and CD8+ cells in tumors were quantified by immunohistochemistry. CD4+ T cells in tumors and Ly6G+ cells in livers were quantified by flow cytometry. IL-6 serum levels were measured by cytokine bead array. CD3+ and Ly6G+ cells/uL in the peripheral blood (PB) were measured by flow cytometry. Significance was determined by Mann Whitney test with correction for multiple comparisons. n = 19–20 mice per group. c) Six clonal PDAC cell lines (n = 3 T cellhigh and n = 3 T celllow) were chosen based on their similar tumor burden. Mice were analyzed as described in Fig. 1a. d) Tumor weight 20 days post-orthotopic implantation. Mann Whitney test performed. e) Individual mice were clustered based on the variables listed in Fig. 1a. f) Correlation matrix of the variables described in Fig. 1a. g) Percent area of metastatic lesions in livers of mice described in Fig. 1a. Lesions were measured by H&E staining. Mann Whitney test performed. h) Transcriptional expression of tumor markers (Pdx1 and Krt19) in livers of C57BL/6 mice with an orthotopic T cellhigh (655c3, n = 6 mice) or T celllow (6419c1, n = 4 mice) tumor measured by RNA sequencing analysis. Mann Whitney test performed. i-j) Wild-type mice were intraportally injected with 2e5 PDA cells. n = 2 mice per cell line. 14 days later, livers were formalin fixed, paraffin embedded, and stained with hematoxylin & eosin. Metastatic lesions were quantified. Significance was determined by Mann-Whitney test. For violin plots, all data points are shown with lines at the median and quartiles. For h and j, data are presented as mean values +/− SD.
Extended Data Fig. 2 |
Extended Data Fig. 2 |. IL-6/STAT3 signaling in hepatocytes remodels the tumor immune microenvironment.
a-c). Il6+/+ or Il6−/− mice were orthotopically (OT) injected with 5e5 PDA.69 cells. Twenty days later, tumors were harvested. n = 10 Il6+/+ mice and n = 9 Il6−/− mice were examined over 2 biological replicates. b) Tumors were formalin fixed, paraffin embedded, and stained for CD8 (brown), FOXP3 (purple), CK19 (yellow), and nuclei (blue, hematoxylin). Representative images are shown. Scale bars=100 μm. c) Quantification of CD8+ or FOXP3+ cells from (b). Mann Whitney tests were performed. d-g). C57BL/6 or AlbCre+/+Stat3fl/fl mice were orthotopically injected with 5e5 PDA.69 cells or received sham surgery. Twenty days later, livers and tumors were harvested for RNA sequencing. n = 6 mice per group. Data are representative of 1 biological replicate. d) Heatmap of differentially expressed genes (DEGs) in livers. e) Volcano plot showing DEGs in tumors of C57BL/6 or AlbCre+/+Stat3fl/fl mice. Genes enriched in C57/BL6 shown in blue. Genes enriched in the AlbCre+/+Stat3fl/fl group shown in red. Significance determined by log2FoldChange < −0.6 or > 0.6 and adjusted p value < 0.05. f) PCA plot showing clustering of tumors. g) Gene set enrichment analysis of DEGs. The ten most highly enriched gene sets in tumors of AlbCre+/+Stat3fl/fl mice are shown. h-k) C57BL/6 mice were OT injected with 5e5 T celllow (PDA.69) or T cellhigh (2838.c3) PDAC cells. Twenty days later, tumors were harvested. n = 5 mice per group. Data shown are representative of n = 1 biological replicate. i) Tumors were formalin fixed, paraffin embedded, and stained for CD8 (brown), FOXP3 (purple), CK19 (yellow), and nuclei (blue, hematoxylin). Representative images are shown. Scale bars=200μm. j) Quantification of CD8+ or FOXP3+ cells from (i). k) CD3+ T cell infiltration in tumors was analyzed by flow cytometry. l) C57BL/6 mice were treated with GFP.AAV or IL6.AAV as described in Fig. 2h, then injected with 5e5 T cellhigh (2838.c3) PDAC cells. IL-6 serum levels were measured at day 15 by cytokine bead array. Data are representative of 3 biological replicates. For j-l, Mann Whitney tests performed. For c, j, k, and l, data are presented as mean values +/− SD.
Extended Data Fig. 3 |
Extended Data Fig. 3 |. SAA inhibit T cell infiltration in primary and metastatic tumors.
a) Mice were treated as described in Fig. 3d. CD8+ and FOXP3+ staining in Fig. 3f was quantified. Data shown are representative of n = 3 biological replicates. b-d) Saa+/+ or Saa−/− mice were orthotopically injected with 5e5 PDAC.69 cells, then challenged with 8572.YFP cells via intraportal (I.Po.) injection 10 days later. Tissues were harvested on day 20. Data shown are representative of 3 biological replicates. c) Livers were formalin fixed and paraffin embedded and stained for CD3 (purple), CK19 (yellow) and nuclei (blue, hematoxylin). Representative images area shown. Scale bars = 100μm. d) Quantification of CD3+ cells in metastatic lesions. e-j) Saa+/+ or Saa−/− mice were subcutaneously (SC) injected with T celllow tumors (5e5 7940B (e-g); or 6694.c2 (h-j). At 28–33 days post-tumor implantation, tumors were analyzed. n = 5 mice/group. Data shown are representative of n = 1 biological replicate. f, i) Tumors were formalin fixed and paraffin embedded, then stained for CD8 (brown), FOXP3 (purple), CK19 (yellow) and nuclei (blue, hematoxylin). Representative images are shown. Scale bars=100μm (f) or 200 μm (i). CD8+ and FOXP3+ cells were quantified. g, j) Tumor infiltrating T cells were analyzed by flow cytometry. k) Study schematic for (l-m). 1.5e5 B16F10 cells were subcutaneously (SC) injected on Day 0. 21 days later, analyses were performed. n = 6 mice/group. l) SAA serum levels at necropsy were analyzed by ELISA. Wilcoxon matched-pairs signed rank test was performed. m) Tumors were analyzed by flow cytometry. Mann Whitney tests were performed for panels comparing two groups. For a, d, f, g, i, j, and m, data are presented as mean values +/− SD.
Extended Data Fig. 4 |
Extended Data Fig. 4 |. SAA regulate the composition of the tumor microenvironment.
a) Saa+/+ or Saa−/− mice were orthotopically injected with 5e5 PDAC.69 cells. Eighteen days later, tumors were harvested, and single cell RNA-sequencing was performed using the 10x genomics platform. n = 4 mice/group were pooled to n = 2 samples per group. Bulk tumor cells were clustered and visualized using UMAP in R software. Sixteen distinct cell populations were identified. b) Bubble plot displaying expression of genes used to label clusters. c) T cells were subsetted and furthered clustered and visualized using UMAP. Bubble plot showing expression of genes used to label individual T cell clusters. d) Interpolated polar line plot of raw counts of cytotoxic molecules (Gzmb, Prf1, Ifng, and Tnf) and activation markers (Pdcd1, Ctla4, Lag3, Tox, and Havcr2) in CD8+ CTL population of orthotopic tumors harvested from Saa+/+ or Saa−/− mice.
Extended Data Fig. 5 |
Extended Data Fig. 5 |. SAA regulate the phenotype of tumor-infiltrating T cells.
a) Saa+/+ or Saa−/− mice were orthotopically injected with 5e5 PDAC.69 cells. Twenty days later, tumors were harvested and analyzed by CyTOF. tSNE plots from 5000 downsampled CD45+ cells were generated and clusters identified using R software. b) Heat map displaying marker expression for each cluster. c) tSNE plots were subsetted on CD3+ T cell clusters. d) Expression of immunoregulatory markers on T cell clusters. e) Quantification of CD8+Perforin+ cells by CyTOF. Data are representative of n = 1 experiment. n = 4 Saa+/+ and n = 5 Saa−/− mice. Mann Whitney test performed. f) Quantification of CD3+CD8+PD1+T IM3+LAG3+ cells by flow cytometry in PDA.69, 7940B, and 6694.c2 subcutaneous tumors at 27–33 days post tumor injection into Saa+/+ (n = 7 for PDA.69, n = 5 for 7940B, 6694c2) or Saa−/− (n = 5) mice. n = 1 biological replicate. Mann Whitney tests were performed. g) Experimental schematic for (h-i). C57BL/6 mice (n = 4–6/group) were injected subcutaneously with 1e6 PDA.69 cells on Day 0. T cells were depleted with 0.2mg anti-CD4 and anti-CD8 antibodies on Day −1 and repeated weekly. On Day 28, tumors were formalin fixed, paraffin embedded, and stained for pSTAT1 (yellow), F4/80 (purple), and CK19 (teal). Data shown are from n = 1 biological replicate. h) Quantification of pSTAT1+ cells was performed in Visiopharm software. Ordinary one-way ANOVA with Sidak’s multiple comparisons test was performed. i) Representative images of tumors. Scale bars = 100μM. j) Saa+/+ or Saa−/− mice were subcutaneously (SC) injected with T celllow tumors (5e5 PDA.69, 7940B, or 6694.c2. Mean tumor growth curves are shown. Mann Whitney tests were performed. n = 5 mice/group. Data shown are representative of n = 5 biological replicates for PDA.69, n = 1 biological replicate for 7940B and 6694.c2. For e, f, and h, data are presented as mean values +/− SD.
Extended Data Fig. 6 |
Extended Data Fig. 6 |. SAA regulate dendritic cell infiltration into primary tumors.
a) Saa+/+ (n = 3) or Saa−/− (n = 4) mice were orthotopically injected with 5e5 PDA.69 cells. Twenty days later, tumors were harvested and analyzed by CyTOF. tSNE plots from 5000 CD45+ downsampled cells were generated and clusters identified using R software. b) Heat map displaying marker expression for each cluster. c) Expression of dendritic cell markers on all clusters. d) DC frequency measured by manual gating. For a-d, data are representative of n = 1 experiment. Unpaired t test performed. e) Mice were treated as described in Fig. 2h. n = 5–8 mice per group. Data shown are from n = 2 biological replicates. Tumors were analyzed and dendritic cells quantified by flow cytometry. Significance was determined by Brown Forsythe and Welch test with Dunnett’s T3 correction. For d and e, data are presented as mean values +/− SD.
Extended Data Fig. 7 |
Extended Data Fig. 7 |. Inhibition of T cell surveillance by SAA depends on TLR2.
a) Study design for b. Saa+/+ or Saa−/− mice received sham surgery or orthotopic (OT) injection of 5e5 PDA.69 cells. n = 5 mice/group. Bulk liver tissue was collected in Trizol and RNA was extracted. b) Expression of known SAA receptors measured by qRT-PCR. Ordinary one-way ANOVA with Dunnett’s multiple comparisons test was performed. c-d) Twenty days after sham surgery or OT injection of 5e5 PDA.69 cells, livers were analyzed by flow cytometry. n = 5 mice per group. c) Percent of live cells expressing TLR2. d) tSNE plots were created from 5000 downsampled live cells and cell marker expression is displayed. For a-d, data are representative of n = 1 biological replicate. e-j) Tlr2+/+ or Tlr2−/− mice were OT injected with 5e5 PDA.69 cells. Twenty days later, tumors were harvested. Data are representative of 1 biological replicate for (f-g, j) and 2 biological replicates for (h-i). f) SAA serum levels at necropsy were analyzed by ELISA. n = 5 non-tumor bearing Tlr2+/+ mice, n = 9 Tlr2+/+ mice, and n = 10 Tlr2−/− mice. g) Livers were formalin fixed, paraffin embedded, and stained by RNA-ISH for Saa. h-i) Tumors were formalin fixed, paraffin embedded, and stained for CD8 (brown), FOXP3 (purple), CK19 (yellow) and nuclei (blue, hematoxylin). Representative images are shown. Scale bars=100μm. n = 11 mice/group. j) T cell and dendritic cell (DC) infiltration into tumors was analyzed by flow cytometry. n = 8 Tlr2+/+ mice, n = 11 Tlr2−/− mice. For (c-j), significance was determined by Mann Whitney test. For b, c, f, h, and j, data are presented as mean values +/− SD.
Extended Data Fig. 8 |
Extended Data Fig. 8 |. A TLR2 agonist is sufficient to inhibit dendritic cell and T cell infiltration into tumors.
a) Experiment schematic for (b-f). C57BL/6 mice were orthotopically injected with 5e5 2838.c3 cells (n = 8 mice per group). Two days later, mice began treatment with 100 μg of Pam3CSK4 q.o.d. Twenty days after tumor implantation, tumors were analyzed b-f) T cells and dendritic cells quantified by flow cytometry. Mann Whitney tests (two sided) were performed. Data are representative of 1 biological replicate. g) Mice of the indicated genotypes were orthotopically implanted with tumor cells as described in Fig. 2h and Extended Data Figure 9e. Left panel: n = 9, 7, 10, and 9 mice were examined for groups 1, 2, 3, and 4 respectively from left to right, over n = 2 biological replicates. Right panel: n = 9 Tlr2+/+ mice and n = 11 Tlr2−/− mice in n = 1 biological replicate. Tumors were analyzed by flow cytometry. Significance was determined by Brown Forsythe and Welch test with Dunnett’s T3 correction (left), and by unpaired t test (right). h) Representative histograms of expression of tumor-reactive T cell markers in Tlr2+/+ or Tlr2−/− mice. For b-g, data are presented as mean values +/− SD.
Extended Data Fig. 9 |
Extended Data Fig. 9 |. SAA regulate a tumor-specific T cell response dependent on dendritic cells.
a) Experiment schematic for treating hematopoietic stem cells (HSCs) harvested from Tlr2+/+ or Tlr2−/− mice with GM-CSF (0.2μg/mL) and Pam3CSK4 (100ng/mL). b) Quantification of CD11c+ DCs by flow cytometry. Significance was determined by ordinary one-way ANOVA with Sidak’s multiple comparisons correction. n = 3 technical replicates per n = 2 biological replicates. c) Study design for (d). HSCs were harvested from Tlr2+/+ or Tlr2−/− mice and treated with GM-CSF (0.2μg/mL) for eight days to differentiate them into bone marrow derived dendritic cells (BMDCs). BMDCs were treated with SAA (1μg/mL) for 24 hours. d) IL-6 and IL-10 were detected in supernatant by cytokine bead array. Significance was determined by one-way ANOVA with Sidak’s multiple comparisons correction. Data are representative of n = 3 biological replicates. e) Mice were treated as described in Fig. 3o, and CD8+tetramer+ cells were quantified by flow cytometry. Significance was determined by Brown-Forsythe and Welch ANOVA test with Dunn’s T3 multiple comparisons test. Data are representative of n = 3 biological replicates. n = 5 mice per group, except for tumor bearing Saa+/+ mice (n = 3) and tumor bearing Saa−/− mice (n = 4). f) Representative flow plots of tetramer expression on CD8+ T cells. g) Study schematic. Saa+/+ (n = 7/group) or Saa−/− mice (n = 8/group) were orthotopically (OT) injected with 5e5 PDA.69 cells on day 0. DC depleting antibody (aDC) was administered on day −2, −1 and twice weekly after tumor implantation. Analysis was performed on Day 20. h) Spleens were analyzed by flow cytometry for DC depletion. n = 6/group for aDC. Mann Whitney tests were performed. i) Tumors were analyzed by flow cytometry for total DC and T cell infiltration. Mann Whitney tests were performed. For b, d, e, h, and i, data are presented as mean values +/− SD.
Extended Data Fig. 10 |
Extended Data Fig. 10 |. SAA suppress immunological memory after tumor resection and disrupt systemic immune biology.
a) Study design for b-c. Cured Saa−/− mice after surgical resection of tumor (compared to tumor-naïve mice) were rechallenged with 1e6 7940B tumor cells injected subcutaneously. n = 3 mice per group. b) Overall survival. Significance was determined by Mantel Cox test. c) Tumor growth curves after rechallenge. d) Study design for e-f. Cured mice after tumor rechallenge from a-c (compared to tumor-naïve mice) were depleted of T cells weekly starting one day before challenge with 1e6 subcutaneous 7940B cells. e) Overall survival. Mantel Cox test was performed. f) Mean tumor growth curves after rechallenge. Data shown are representative of 1 biological replicate. g) Ten patients with advanced untreated pancreatic cancer were divided into two groups of n = 5 each by median serum SAA level (215 μg/mL) measured by ELISA. h-i) Saa+/+ or Saa−/− mice (n = 5/group) were orthotopically injected with 5e5 PDA.69 cells. Twenty days later, spleens were collected and analyzed by CyTOF. h) Representative flow plots of CD14+ monocytes and CD3+ T cells. i) Quantification of CD14+ monocytes and CD3+ T cells. Unpaired t tests were performed. j) SAA serum levels detected by ELISA for stage-matched cohorts of treatment-naive, surgically resected short- and long-term survivors (STS, n = 9, and LTS, n = 16). All outliers are shown. Significance was determined by Mann Whitney t-test (two sided). For g, i, and j, data are presented as mean values +/−SD.
Fig. 1 |
Fig. 1 |. Distinct transcriptional states in the liver define T cellhi and T celllo tumors.
a, Experiment schematic for bd. C57BL/6 mice (n = 6 per group) were orthotopically (OT) injected with a panel of clonal PDAC cell lines. On day 19, peripheral blood (PB) NLR was determined by flow cytometry (FCM). On day 20, analyses were performed by FCM (tumor CD4+ and CD8+, liver CD11b+ and Ly6G+), immunohistochemistry (IHC; tumor CD8+ per mm2 and FOXP3+ per mm2) and cytokine bead array (CBA; serum IL-6). n = 1 biological replicate. b, Individual mice were clustered based on the variables listed in a. The two unsupervised clusters were defined as ‘T celllo’ and ‘T cellhi’. c, Correlation matrix of the variables described in a. d, Validation of T celllo and T cellhi clusters. Values from individual mice are shown. Mann–Whitney tests performed with correction for multiple comparisons. e, Experiment schematic for fj. C57BL/6 mice were OT implanted with T celllo (6419c1; n = 4) or T cellhi (6555c3; n = 6) tumor clones. Twenty days later, livers were analyzed by RNA-seq. f, Number of upregulated genes. g, PCA plot showing clustering of livers of mice bearing T celllo (blue) or T cellhi (red) tumors. h, Normalized enrichment score (NES) of selected gene sets enriched in livers of mice bearing T celllo (blue) or T cellhi (red) tumors. Gene sets were identified by gene-set enrichment analysis. i, Heat map of core enrichment genes for the HALLMARK_IL6_JAK_STAT3_SIGNALING gene set is shown. j, Livers described in a were formalin fixed and paraffin embedded and stained for phospo-STAT3 (pSTAT3; brown). Representative images are shown. Scale bars, 60 μm. k, pSTAT3 staining in livers from mice described in a was quantified. Significance was determined by Mann–Whitney test with correction for multiple comparisons. l, Livers from mice (n = 2) treated as described in a (T celllo, 6419c1 and T cellhi, 6555c3) were stained for albumin (brown) as a marker of hepatocytes and pSTAT3 (purple). Representative images are shown with pseudocoloring performed in Visiopharm software. Scale bars, 60 μm. For violin plots, all data points are shown with lines at the median and quartiles.
Fig. 2 |
Fig. 2 |. IL-6–STAT3 signaling in hepatocytes is necessary and sufficient to inhibit immune surveillance in cancer.
a, Schematic for b and c. C57BL/6 or AlbCre+/+Stat3fl/fl mice (n = 6 per group) received orthotopic injection (5 × 10⁵ PDA.69 cells) or sham surgery. Twenty days later, livers and tumors were harvested for RNA-seq. b, PCA plot of livers. c, NES for the top ten Gene Ontology biological process gene sets enriched in tumors in AlbCre+/+Stat3fl/fl mice compared to tumors in C57BL/6 mice. Significance was determined using a permutation test with an adjustment for multiple comparisons. dg, AlbCre+/+ (f, n = 20; g, n = 23) or AlbCre+/+Stat3fl/fl (f, n = 26; g, n = 29) mice received orthotopic injection (5 × 10⁵ PDA.69 cells) in three independent experiments. Twenty days later, tumors were harvested. e, Representative images of tumors stained for CD8 (brown), FOXP3 (purple) and CK19 (yellow). Scale bars, 100 μm. f, Quantification was performed in Visiopharm software. Mann–Whitney test was performed. g, Tumor-infiltrating CD3+CD8+ T cells were quantified by flow cytometry. Mann–Whitney test was performed. hl, Ten days before orthotopic injection of 5 × 10⁵ 2838.c3 cells, AlbCre+/+ or AlbCre+/+Stat3fl/fl mice received 3 × 10¹⁰ viral genomes of AAV encoding hepatocyte-specific GFP or IL-6. Twenty days after orthotopic injection, tumors were harvested. For i,j, n = 17, 12, 10 and 8 mice were examined for groups shown from left to right, over n = 2 biological replicates. For k, n = 9, 7, 10 and 9 mice were examined for groups shown from left to right, over n = 2 biological replicates. For l, n = 5, 4, 5 and 3 mice were examined for groups shown from left to right in n = 1 biological replicate. i, Representative images of tumors stained as in e. Scale bars, 200 μm. j, Quantification was performed in Visiopharm software. Brown–Forsythe and Welch analysis of variance (ANOVA) test with Dunnet’s T3 multiple-comparisons correction (left) or Kruskal–Wallis test with Dunn’s multiple-comparisons correction (right) was performed. k, Tumor-infiltrating CD3+CD8+ T cells were quantified by flow cytometry. Brown–Forsythe with Dunnett’s multiple-comparisons test was performed. l, Peripheral blood NLR at necropsy. Ordinary one-way ANOVA with Sidak’s multiple-comparisons test was performed. For f, g, k and l, data are presented as mean values ± s.d.
Fig. 3 |
Fig. 3 |. Hepatocyte-derived SAA suppress tumor-specific T cell infiltration and promote tumor growth.
a,b, C57BL/6 or AlbCre+/+Stat3fl/fl mice (n = 6 per group) received sham surgery or 5 × 10⁵ PDA.69 cells orthotopically (OT). Liver RNA-seq was performed on day 20 (D20). n = 1 biological replicate. a, Bubble plot of altered Gene Ontology biological process gene sets in tumor-bearing C57BL/6 or AlbCreStat3fl/fl mice compared to tumor-free C57BL/6 mice. Permutation test with adjustment for multiple comparisons performed. b, DEGs are shown. Wald test was performed. c, Serum SAA in mice from Fig. 1a,b. Mann–Whitney test was performed with multiple-comparisons correction. Individual mice, median and quartiles are shown. df, Saa+/+ (n = 4) or Saa−/− (n = 5) mice received 5 × 10⁵ PDA.69 cells OT. e, Tumor-infiltrating T cells were assessed by flow cytometry (FCM). Mann–Whitney test was performed. n = 2 biological replicates. f, Representative tumor images showing CD8, FOXP3 and CK19. Scale bars, 100 μm. g,h, Saa+/+ or Saa−/− mice (n = 4 per group) received 5 × 10⁵ PDA.69 cells OT. Tumor scRNA-seq was performed on day 18 (D18). Uniform manifold approximation and projection (UMAP) plot (g) and quantification (h) of T cell clusters. i, CyTOF analysis of tumors collected as in d (n = 5 per group). ‘T cells II’ cluster identified by unsupervised t-distributed stochastic neighbor embedding analysis. Mann–Whitney test was performed. j,k, Saa+/+ or Saa−/− mice underwent CD4+/CD8+ depletion before subcutaneous (SC) injection (PDA.69 1 × 10⁶ cells). Control, n = 7 mice per group; depletion, n = 6 mice per group. n = 2 biological replicates. k, Mean tumor growth. Ordinary one-way ANOVA with Sidak’s multiple-comparisons test was performed. l, CyTOF analysis of tumors collected as in d from Saa+/+ (n = 3) and Saa−/− (n = 4) mice. ‘Dendritic cells II’ (CD11c+MHCII+CD80+CD86+CD1d+CD117+CX3CR1+CD64+CD54+PD-L1+) cluster identified as in i. Unpaired t-test was performed. m,n, HSCs were treated with granulocyte-macrophage colony-stimulating factor (GM-CSF) and SAA. n = 3 technical replicates. n, FCM quantification of DCs. Ordinary one-way ANOVA with Sidak’s multiple-comparisons correction was performed. n = 1 biological replicate. o,p, C57BL/6 mice received sham surgery or 5 × 10⁵ PDA.69 cells OT (D−14), received subcutaneous tumors (7.5 × 10⁵ OVA.4662 cells, D0) and were analyzed on D7. n = 5 mice per group, except tumor-bearing Saa+/+ mice (n = 3). n = 3 biological replicates. p, FCM quantification of tetramer+ OVA-specific CD8+ T cells in subcutaneous tumors. Brown–Forsythe and Welch ANOVA test with Dunn’s T3 multiple-comparisons test was performed. e, i, l, n and p show mean values ± s.d.
Fig. 4 |
Fig. 4 |. SAA and intratumoral T cells control survival after tumor resection in mice and humans.
ae, 59 treatment-naive individuals with PDAC underwent surgical resection. a, Heat maps of CD8+ T cell density from short-term survivors (>3 mo, <1 year; n = 13; STS) and long-term survivors (>3 years; n = 16; LTS). Scale bars, 4 mm. b, CD8+ quantification by immunohistochemistry. Unpaired t-test was performed. c, Survival of participants stratified by median T cell infiltration (236 CD8+ cells per mm2). CD8lo, n = 30; CD8hi, n = 29. d, NLR of STS (n = 10) and LTS (n = 12). Unpaired t-test was performed. e, Survival of participants stratified by median NLR (3.1). NLRhi, n = 23. NLRlo, n = 24. f, Schematic for distal pancreatectomy/splenectomy (gj). C57BL/6 mice received tumors (1 × 10⁵ cells, T celllo = 6694c2, T cellhi = 2838c3) OT on D0, which were resected D10. gi, Characterization of T celllo (n = 3) versus T cellhi (n = 6) phenotypes without surgical resection. n = 1 biological replicate. Mann–Whitney tests performed. g, Tumor-infiltrating CD8+ cell quantification (D20). h, Peripheral blood NLR (D19). i, Serum SAA (D20). j, Survival after tumor resection. n = 8 mice per group. n = 2 biological replicates. k, Schematic for ln. Saa+/+ or Saa−/− mice received 1 × 10⁵ 7940B cells OT (D0), CD4/CD8 depleting antibodies (D9, then continued weekly) and distal pancreatectomy/splenectomy (D10). l, Serum SAA. Wilcoxon matched-pairs signed-rank test and Mann–Whitney test were performed. n = 8 mice per group. n = 2 biological replicates. m, Resected tumors were stained for CD8. n = 15 Saa+/+ and n = 14 Saa−/− mice were examined over two biological replicates. Mann–Whitney test was performed. n, Survival. n = 8 mice per group (n = 7 mice for Saa−/− + IgG2b). n = 1 biological replicate for depletion groups; n = 2 for control groups. o,p, CyTOF analysis of peripheral blood from healthy volunteers and individuals with PDAC (n = 10 per group). Individuals were stratified by median serum SAA (215 μg ml−1). p, Quantification of monocytes (CD14+) and T cells (CD3+). Ordinary one-way ANOVA with Tukey’s multiple-comparisons test was performed. q,r, SAA serum levels in stage-matched cohorts of treatment-naive, surgically resected short-term and long-term survivors (STS, n = 9; LTS, n = 16). Three outliers were removed by ROUT outlier test (Q = 0.5%). Unpaired t-test was performed. Mean values ± s.d. are shown for b, d, g, h, i, m, p and r. For survival curves, Mantel–Cox log-rank tests were performed.

Similar articles

Cited by

References

    1. Bruni D, Angell HK & Galon J. The immune contexture and Immunoscore in cancer prognosis and therapeutic efficacy. Nat. Rev. Cancer 20, 662–680 (2020). - PubMed
    1. Balachandran VP et al. Identification of unique neoantigen qualities in long-term survivors of pancreatic cancer. Nature 551, 512–516 (2017). - PMC - PubMed
    1. Chen PL et al. Analysis of immune signatures in longitudinal tumor samples yields insight into biomarkers of response and mechanisms of resistance to immune checkpoint blockade. Cancer Discov. 6, 827–837 (2016). - PMC - PubMed
    1. Slaney CY, Kershaw MH & Darcy PK Trafficking of T cells into tumors. Cancer Res. 74, 7168–7174 (2014). - PubMed
    1. Stromnes IM et al. T cells engineered against a native antigen can surmount immunologic and physical barriers to treat pancreatic ductal adenocarcinoma. Cancer Cell 28, 638–652 (2015). - PMC - PubMed

Publication types

MeSH terms