. 2024 Apr 19;25(1):102.
doi: 10.1186/s13059-024-03242-6.

RBM22 regulates RNA polymerase II 5' pausing, elongation rate, and termination by coordinating 7SK-P-TEFb complex and SPT5

Affiliations

RBM22 regulates RNA polymerase II 5' pausing, elongation rate, and termination by coordinating 7SK-P-TEFb complex and SPT5

Xian Du et al. Genome Biol. .

Abstract

Background: Splicing factors are vital for the regulation of RNA splicing, but some have also been implicated in regulating transcription. The underlying molecular mechanisms of their involvement in transcriptional processes remain poorly understood.

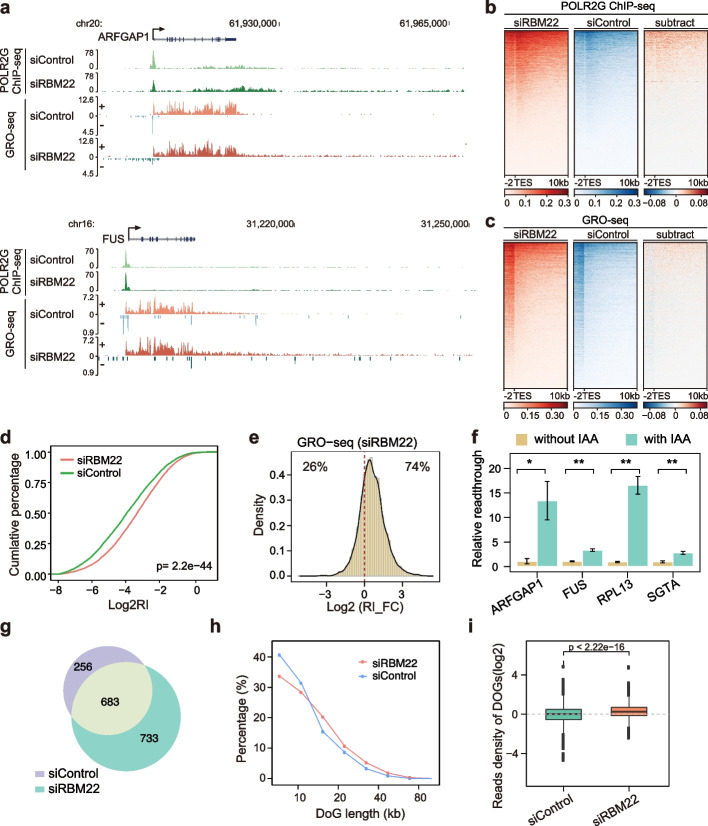
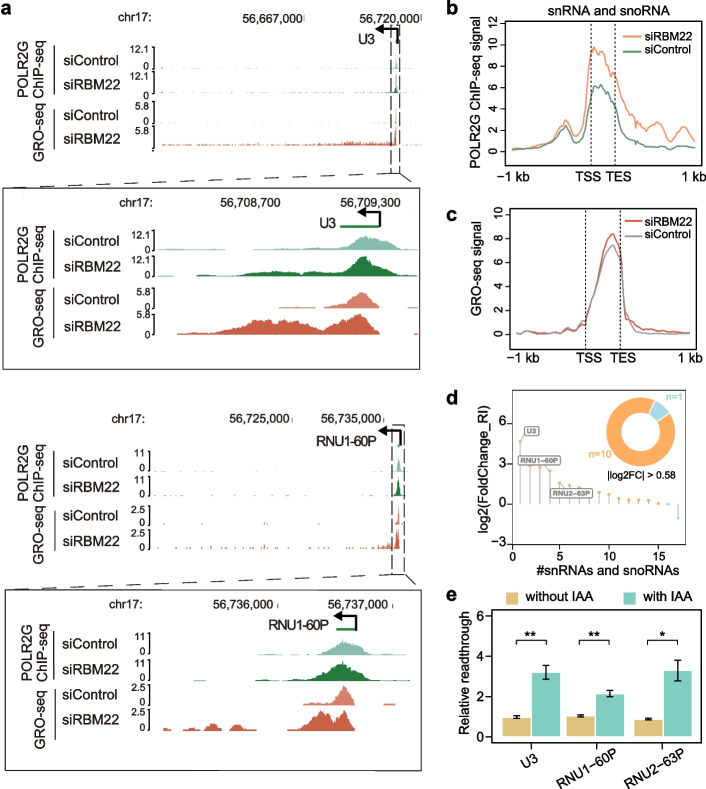
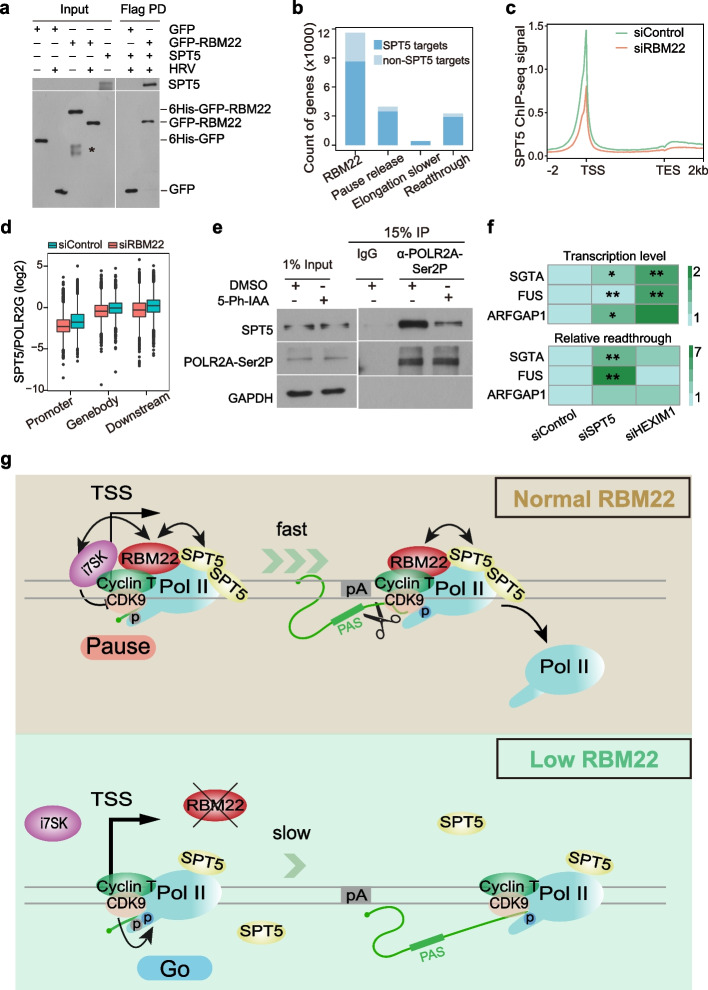
Results: Here, we describe a direct role of splicing factor RBM22 in coordinating multiple steps of RNA Polymerase II (RNAPII) transcription in human cells. The RBM22 protein widely occupies the RNAPII-transcribed gene locus in the nucleus. Loss of RBM22 promotes RNAPII pause release, reduces elongation velocity, and provokes transcriptional readthrough genome-wide, coupled with production of transcripts containing sequences from downstream of the gene. RBM22 preferentially binds to the hyperphosphorylated, transcriptionally engaged RNAPII and coordinates its dynamics by regulating the homeostasis of the 7SK-P-TEFb complex and the association between RNAPII and SPT5 at the chromatin level.

Conclusions: Our results uncover the multifaceted role of RBM22 in orchestrating the transcriptional program of RNAPII and provide evidence implicating a splicing factor in both RNAPII elongation kinetics and termination control.

Keywords: 5′ pausing; RBM22; RNA polymerase II; Transcription elongation; Transcription termination.


Conflict of interest statement

The authors declare that there are no competing interests associated with the manuscript.

Figures

Fig. 1
Fig. 1
RBM22-mediated repression of RNAPII pause release at many genes. a Examples of total RNAPII (POLR2A), Ser5P RNAPII (POLR2A-S5P), Ser2P RNAPII (POLR2A-S2P), and RBM22 occupancy measured by ChIP-seq as well as POLR2G occupancy and gene transcription levels measured by GRO-seq at two representative protein-coding genes (SGTA and RPL13) in control (siControl) and RBM22 knockdown (siRBM22) HepG2 cells. b Heatmap and metagene analysis showing the ChIP-seq signal for POLR2A (total; indigo), POLR2A-S5P (purple), POLR2A-S2P (green), and RBM22 (orange) at all human protein-coding genes in HepG2 cells, rank ordered by gene expression. Color-scaled intensities are in units of cpm. c Heatmap and metagene analysis showing the ChIP-seq signal for POLR2G at genes with POLR2G binding at promoters in control and RBM22 knockdown HepG2 cells. Rows are sorted by decreasing POLR2G occupancy in the region between 2 kb upstream of TSS to TES under control condition. For the subtraction of heatmaps, the color bars depict the subtracted values of siRBM22 minus siControl. d RNAPII PRR distribution in control or RBM22 knockdown HepG2 cells, showing increased pause release at many genes after RBM22 knockdown. Higher PRR values indicate a higher degree of pause release. The p value was determined using the Kolmogorov–Smirnov test. e Boxplot showing the fold change (FC) of PRR (POLR2G ChIP-seq) at genes with different degrees of pausing in response to RBM22 depletion. The 9065 genes were equally divided into four groups based on the PRR of RNAPII in the control condition. f Western blot showing the protein abundance of RBM22 in wild-type (WT) cells or in mAID-RBM22 HepG2 cells upon the addition of 5-Ph-IAA for the indicated times. β-actin was used as the loading control. The 5-Ph-IAA is an auxin used for degradation. g POLR2G ChIP-qPCR quantification of RNAPII pause release at four representative protein-coding genes before (without 5-Ph-IAA) or after (with 5-Ph-IAA) RBM22 degradation in mAID-RBM22 cells. The pause release ratio in untreated cells (without 5-Ph-IAA) was set to 1. The p values are determined using the two-tailed unpaired t-test (*p ≤ 0.05; **p ≤ 0.01; ns, not significant). h Metagene analysis showing the elevated GRO-seq signals at protein-coding genes in RBM22 knockdown HepG2 cells. i Metagene analysis of antisense transcription, detected by GRO-seq, at TSS in control and RBM22 knockdown HepG2 cells. j Venn diagram showing the protein-coding genes with both PRR changes in the sense direction and transcriptional changes in the antisense direction. The p value was determined using the hypergeometric test
Fig. 2
Fig. 2
DRB/POLR2A ChIP-Seq measures RNAPII elongation rates across genes. a Examples of DRB/POLR2A ChIP-seq signals at two representative genes (NUP210 and USO1) at different time points following the release from DRB-induced inhibition of transcriptional elongation. Arrows indicate the front of the transcription wave. b DRB/POLR2A ChIP-seq metagene profiles for the genes longer than 80 kb (N = 2217). Arrows indicate the front of the calculated transcription wave. c Schematic representation of the regions amplified in the ChIP-qPCR. The wave front represents the region where RNAPII transcribes only in the condition without 5-Ph-IAA treatment. The upstream region represents the common interval where RNAPII transcribes with or without 5-Ph-IAA treatment. The downstream region represents the interval where RNAPII does not transcribe with or without 5-Ph-IAA treatment. d POLR2A ChIP-qPCR showing the RNAPII enrichment in different areas of example long genes in mAID-RBM22 cells with 5-Ph-IAA or without 5-Ph-IAA treatment. Values are mean ± SD (n = 4). The p values are determined using the two-tailed unpaired t-test (*p ≤ 0.05; **p ≤ 0.01; ***p ≤ 0.001; ****p < 0.00001; ns, not significant). e Calculation of the RNAPII average elongation rates based on metagene profiles using linear regression for all the genes longer than 80 kb with high POLR2A ChIP-seq signals in control (2.13 kb/min) or RBM22 knockdown (1.39 kb/min) HepG2 cells. f Boxplot analysis of the RNAPII elongation rates for individual 415 genes with robust signal at all time points. g–h Boxplot analysis of the RBM22 ChIP-seq signals (g) and the elongation rate changes upon RBM22 knockdown (h) for the genes with different elongation rates in control cells. The 598 genes with computable elongation rates were divided into three groups based on elongation rate in control cells: low (rate < 1.87 kb/min), medium (1.87 kb/min < rate < 2.36 kb/min), and high (rate > 2.36 kb/min). The p values are determined using the two-tailed unpaired t-test (*p ≤ 0.05; **p ≤ 0.01; ***p ≤ 0.001; ****p < 0.00001)
Fig. 3
Fig. 3
RBM22 controls the transcription termination of protein-coding genes. a Examples of POLR2G ChIP-seq and GRO-seq signals at two representative protein-coding genes (ARFGAP1 and FUS) in control, RBM22 knockdown HepG2 cells, showing the enhanced transcriptional readthrough in the absence of RBM22. b–c Heatmaps displaying the changes in POLR2G ChIP-seq (b) and GRO-seq (c) signals in a region from 2 kb upstream to 10 kb downstream of the TES of each protein-coding gene (N = 20,003) upon RBM22 knockdown in HepG2 cells. For the subtraction of heatmaps, the color bars depict the subtracted values of siRBM22 minus siControl. d RI distribution in control and RBM22 knockdown HepG2 cells, showing the enhanced transcriptional readthrough at many transcribed genes (N = 5626) upon RBM22 knockdown. The p value was determined using the Kolmogorov–Smirnov test. e Histogram showing the fold change (FC) of RI (GRO-seq) at protein-coding genes upon RBM22 knockdown in HepG2 cells. f TT-qPCR quantification of transcriptional readthrough at four representative protein-coding genes before (without 5-Ph-IAA) or after (with 5-Ph-IAA) RBM22 degradation in mAID-RBM22 cells. The readthrough ratio in untreated cells (without 5-Ph-IAA) was set to 1. Error bars represent the SD. The p values are determined using the two-tailed unpaired t-test (*p ≤ 0.05; **p ≤ 0.01; ns, not significant). g Venn diagram of DoGs discovered in the two individual conditions. h Length distribution of DoGs discovered in the three individual conditions. The percentage of DoGs of various lengths relative to the entire set of DoGs identified in individual conditions is shown on the y-axis. i Boxplot showing the GRO-seq signal at DoG regions in the two conditions
Fig. 4
Fig. 4
RBM22-mediated transcriptional control at snoRNA and snRNA genes. a Examples of POLR2G ChIP-seq and GRO-seq signal at two representative sno/snRNA genes (U3 and RNU1-60P) in control and RBM22 knockdown HepG2 cells, showing the enhanced transcriptional readthrough induced by RBM22 knockdown. b Metagene analysis showing the change in POLR2G ChIP-seq signal at independently transcribed snoRNA and snRNA genes (N = 25) upon RBM22 knockdown. c Metagene analysis showing the change in GRO-seq signal at independently transcribed snoRNA and snRNA genes (N = 25) upon RBM22 knockdown. d Histogram showing the fold change of RI value for sno/snRNA genes upon RBM22 knockdown, ranked according to RI value. Doughnut plot displaying the number of genes with significant RI change, determined by |log2FC|> 0.58 (n = 11). SnoRNA/snRNA genes occupied by POLR2G in the control condition, as defined by having a peak called MACS2 and not overlapped with transcribed genes were used (n = 17). e TT-qPCR quantification of transcriptional readthrough at three representative sno/snRNA genes before (without 5-Ph-IAA) or after (with 5-Ph-IAA) RBM22 degradation in mAID-RBM22 cells. The readthrough ratio in untreated cells (without 5-Ph-IAA) was set to 1. Error bars represent the SD. The p values are determined using the two-tailed unpaired t-test (*p ≤ 0.05; **p ≤ 0.01; ns, not significant)
Fig. 5
Fig. 5
Interaction network of RBM22 between RNAPII and inhibitory 7SK-P-TEFb complex. a Cytoscape network analysis of the RBM22 protein interactome in HepG2 cells. Orange diamond, RBM22; light blue oval, spliceosome complex; pink oval, transcription; purple oval, DNA repair. b Western blot results showing co-immunoprecipitation of HA-tagged RBM22 and FLAG-tagged RPB3 in HEK293T cells. c Western blot results showing co-immunoprecipitation of FLAG-tagged RBM22 and RNAPII with different phosphorylation status, SPT5, CDK9 in HepG2 cells. d–f Reciprocal co-immunoprecipitation results showing the distinct interaction between RBM22 and unphosphorylated (d), Ser5P (e), and Ser2P (f) RNAPII in HepG2 cells. g Effect of CDK7, CDK9, and CDK12 knockdown on the interaction between RBM22 and RPB3 in HepG2 cells. h Effect of DRB and flavopiridol treatment on the interaction between RBM22 and RPB3 in HepG2 cells. i Effect of Actinomycin D treatment on the interaction between RBM22 and RNAPII in HepG2 cells. j–k Reciprocal co-IP results in HepG2 cells inducibly expressing FLAG-HRV-tagged RBM22 (j) and wild-type HepG2 cells (k) showing the association between RBM22 and 7SK-P-TEFb complex. l RBM22 co-fractionation with RNAPII and spliceosome and identification of separate RBM22-7SK complex. HepG2 cell lysate was analyzed by glycerol gradient sedimentation. Collected fractions were detected by Western blotting. The dashed box highlights a large complex (LC) and a small complex (SC) associated with RBM22. The asterisk indicates a non-specific signal
Fig. 6
Fig. 6
P-TEFb dynamics on chromatin coordinated regulated by RBM22 and inhibitory 7SK snRNP. a Examples of HEXIM1, CDK9, and SPT5 ChIP-seq signals at two representative protein-coding genes (SGTA and RPL13) in control or RBM22 knockdown HepG2 cells. b Heatmaps displaying the reduction in HEXIM1 ChIP-seq signal at protein-coding gene promoters upon RBM22 knockdown. For the subtraction of heatmaps, the color bars depict the subtracted values of siRBM22 minus siControl. c Metagene analysis showing the change in CDK9 ChIP-seq signal in the promoter-proximal regions of protein-coding genes in control or RBM22 knockdown HepG2 cells. d Boxplot analysis of HEXIM1 occupancy signal at gene promoters with different RBM22 binding signals. The 1068 genes with HEXIM1 binding at the promoter were equally divided into three groups based on RBM22 occupancy at gene promoters. e Co-IP assay examining the interaction between endogenous HEXIM1 and CDK9 in mAID-RBM22 cells with 5-Ph-IAA or DMSO treatment. f Distance distribution of CDK9 ChIP-seq peak summit relative to TSS and + 1 nucleosome dyads, determined by MNase-seq, showing the pause release of P-TEFb at chromatin level upon RBM22 knockdown. The y-axis represents the gene number of CDK9 accumulation at relative positions from summit to TSS in control and RBM22 knockdown cells. g CDK9 PRR distribution showing the stronger pause release of P-TEFb at protein-coding genes upon RBM22 knockdown. The p value was determined using the Kolmogorov–Smirnov test. h 2D density plot displaying the high correlation between CDK9 PRR and RNAPII PRR in control and RBM22 knockdown HepG2 cells. The yellow line box represents the gene with PRR values higher than the median, which were used to compare the PRR change for CDK9 and RNAPII before and after the RBM22 knockdown. The p-value was determined using the Fisher test
Fig. 7
Fig. 7
Loss of RBM22 impairs the association of the elongation factor SPT5 with RNAPII. a Recombinant proteins from pull-down assays visualized by immunoblotting. Input (purified 6HIS-GFP, 6HIS-GFP-RBM22 before and after the cleavage of HRV 3C protease and SPT5) and eluted proteins from immunoprecipitations (GFP or GFP-RBM22 incubated with SPT5) were visualized with the GFP and SPT5 antibodies (* indicates non-specific signal). b Barplot showing the number of SPT5 target genes within each category of RBM22 ChIP-seq binding, pause release, elongation slower, and readthrough genes. c Metagene analysis showing the change in SPT5 ChIP-seq signal at all protein-coding genes in control or RBM22 knockdown HepG2 cells. d Metagene profiles of RNAPII-normalized SPT5 occupancy levels at the promoter, gene body, and termination zone in control and RBM22 knockdown HepG2 cells. The 9076 genes with RNAPII binding were used. e Co-IP assay examining the interaction between endogenous SPT5 and Ser2P RNAPII (POLR2A-Ser2P) in mAID-RBM22 cells with DMSO or 5-Ph-IAA treatment. f TT-qPCR quantification of transcriptional level and transcriptional readthrough at three representative protein-coding genes in control, SPT5 knockdown (siSPT5) or HEXIM1 knockdown (siHEXIM1) HepG2 cells. Graphs show the ratios of relative readthrough, normalized to control. The p values are based on a two-tailed unpaired t test; *P < 0.05, **P < 0.01. g During early elongation by RNAPII at many protein-coding genes, RBM22 may initially be recruited by promoter-paused RNAPII, whose CTD is modified by Ser5 phosphorylation. This recruitment may stabilize promoter-associated inhibitory 7SK-P-TEFb complex to globally restrict P-TEFb PGT and subsequent RNAPII pause release in the sense and antisense direction. Moreover, RBM22 interacts with SPT5 and sustains the association between SPT5 and RNAPII, thus promoting RNAPII pausing at promoters. During productive elongation and termination at most genes, RBM22 may enhance the association of SPT5 to maintain the speed of elongating RNAPII and ensure efficient transcription termination. These roles of RBM22 facilitate the maintenance of RNAPII transcription homeostasis

References

    1. Wissink EM, Vihervaara A, Tippens ND, Lis JT. Nascent RNA analyses: tracking transcription and its regulation. Nat Rev Genet. 2019;20:705–723. doi: 10.1038/s41576-019-0159-6. - DOI - PMC - PubMed
    1. Chen FX, Smith ER, Shilatifard A. Born to run: control of transcription elongation by RNA polymerase II. Nat Rev Mol Cell Biol. 2018;19:464–478. doi: 10.1038/s41580-018-0010-5. - DOI - PubMed
    1. Zhou Q, Li T, Price DH. RNA polymerase II elongation control. Annu Rev Biochem. 2012;81:119–143. doi: 10.1146/annurev-biochem-052610-095910. - DOI - PMC - PubMed
    1. Vos SM, Farnung L, Urlaub H, Cramer P. Structure of paused transcription complex Pol II-DSIF-NELF. Nature. 2018;560:601–606. doi: 10.1038/s41586-018-0442-2. - DOI - PMC - PubMed
    1. Flynn RA, Almada AE, Zamudio JR, Sharp PA. Antisense RNA polymerase II divergent transcripts are P-TEFb dependent and substrates for the RNA exosome. Proc Natl Acad Sci U S A. 2011;108:10460–10465. doi: 10.1073/pnas.1106630108. - DOI - PMC - PubMed

Publication types

MeSH terms

LinkOut - more resources