Comment
. 2024 Apr 19;25(1):103.
doi: 10.1186/s13059-024-03245-3.

spVC for the detection and interpretation of spatial gene expression variation

Affiliations
Comment

spVC for the detection and interpretation of spatial gene expression variation

Shan Yu et al. Genome Biol. .

Abstract

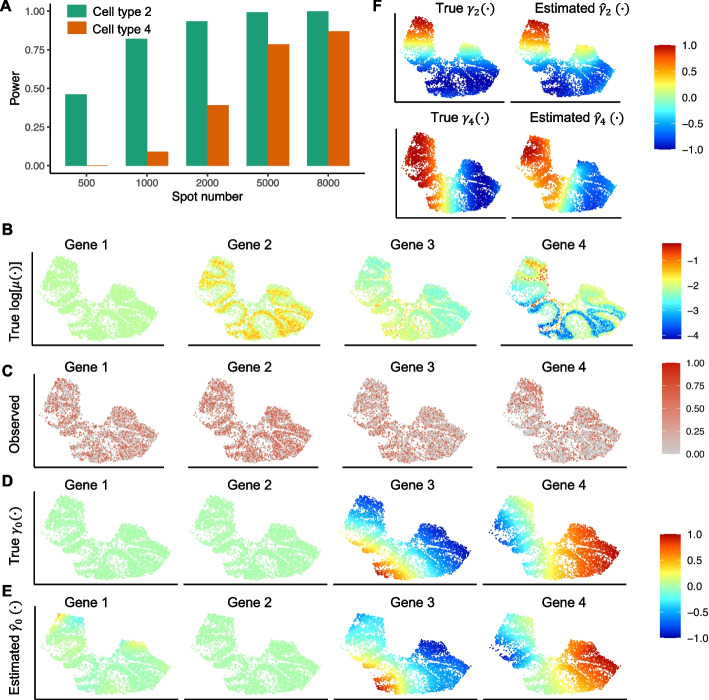
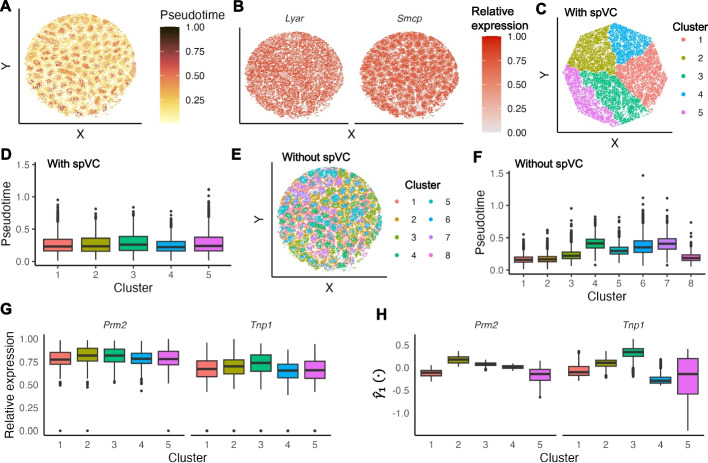
Spatially resolved transcriptomics technologies have opened new avenues for understanding gene expression heterogeneity in spatial contexts. However, existing methods for identifying spatially variable genes often focus solely on statistical significance, limiting their ability to capture continuous expression patterns and integrate spot-level covariates. To address these challenges, we introduce spVC, a statistical method based on a generalized Poisson model. spVC seamlessly integrates constant and spatially varying effects of covariates, facilitating comprehensive exploration of gene expression variability and enhancing interpretability. Simulation and real data applications confirm spVC's accuracy in these tasks, highlighting its versatility in spatial transcriptomics analysis.


Conflict of interest statement

The authors declare that they have no competing interests.

Figures

Fig. 1
Fig. 1
Spatial variation of gene expression introduced by different factors. A Three hypothetical genes with observed spatial variation introduced by different underlying factors. “Constant effect” and “Spatially varying effect” refer to constant and spatially varying coefficients of the covariate, respectively. “Residual spatial effect” refers to spatial effects independent of the covariate. A “” means that the effect is present. B Spot-level cell type proportions. C Read counts generated from Poisson distributions, whose mean parameters are based on the scenarios specified in A. For simplicity, we assume no difference in library size across spots. D Spatially varying effects of the cell type proportion in scenario 2. The average effect is 0 in this square domain so it remains identifiable. E Residual spatial effects in scenario 3. The average effect is 0 in this square domain so it remains identifiable from the constant effect of cell type proportion
Fig. 2
Fig. 2
Overview of the spVC method. A The required input of spVC includes the spatial transcriptomics data (the read count matrix and the corresponding spatial location matrix) and the spot-level covariate data. The covariates should be provided for the same spots observed in the spatial transcriptomics data. B The four main steps in spVC’s estimation procedure. C The two-step testing procedure used in this article. D For each gene, spVC outputs the estimated constant and spatial effects as well as their corresponding P values
Fig. 3
Fig. 3
Comparison of spVC and four alternatives methods on simulated data. A Proportions of the four cell types in the simulated spatial transcriptomics data with 5000 spots. B Statistical power of the five methods on genes in Groups 3 and 4 for detecting residual spatial gene expression variation in the presence of covariates
Fig. 4
Fig. 4
spVC’s estimation and inference on simulated data. A spVC’s power in detecting spatially varying covariate effects. B True log-transformed expected expression, μ(xi,si)(i=1,,5000), of the four example genes. C Relative expression levels of the four example genes based on the simulated data. The simulated counts were normalized by library size, log-transformed, and then scaled by the min-max normalization to obtain the relative expression levels. D True spatial effects, γ0(si)(i=1,,5000), of the four example genes. Data were scaled to the range of [-1,1] for visualization. E spVC’s Estimated spatial effects, γ^0(si)(i=1,,5000), of the four example genes. Data were scaled to the range of [-1,1] for visualization. F (Top) True and estimated spatially varying effects of cell type 2’s proportion, γ2(si)andγ^2(si)(i=1,,5000), of Gene 4. (Bottom) True and estimated spatially varying effects of cell type 4’s proportion, γ4(si)andγ^4(si)(i=1,,5000), of Gene 4. Data were scaled to the range of [-1,1] for visualization
Fig. 5
Fig. 5
Analysis of the prefrontal cortex spatial transcriptomics data. A Spatial coordinates and layer annotations of the cortex data. B Type I errors of SpatialDE, SPARK, SPARK-X, MERINGUE, and spVC in the permutation analysis. C Number of significant genes whose expression was up-regulated in each of the six neocortical layers compared with the white matter. D Number of significant genes whose expression was down-regulated in each of the six neocortical layers compared with the white matter. E Relative expression levels of six example genes with significantly higher expression in L1 to L6 layers, respectively. The top row shows all spots and the bottom row only shows spots in the corresponding layers and WM . The read counts were normalized by library size, log-transformed, and then scaled by the min-max normalization to obtain the relative expression levels
Fig. 6
Fig. 6
spVC’s estimation results on the prefrontal cortex spatial transcriptomics data. A 11 gene clusters identified from genes with significant residual spatial effects identified by spVC. For every cluster, the residual spatial effects (γ^0(·)) were scaled by the min-max normalization, and the the average was taken across all genes in the cluster to obtain the average spatial expression. B Venn diagram of enriched biological process GO terms in the three sets of genes identified by spVC. C Selected enriched GO terms in the three sets of genes and their corresponding adjusted P values
Fig. 7
Fig. 7
spVC’s estimation results on the cerebellum spatial transcriptomics data. A Cell type proportions of granule cells, Bergmann cells, oligodendrocytes, Purkinje cells, molecular layer interneurons (MLIs), and astrocytes. B Type I errors of SpatialDE, SPARK, SPARK-X, MERINGUE, and spVC in the permutation analysis. C Number of significant genes whose expression was positively associated with the proportion of each of the six cell types. D Number of significant genes whose expression was negatively associated with the proportion of each of the six cell types. E Relative expression levels of six example genes positively associated with granule cells, Bergmann cells, oligodendrocytes, Purkinje cells, molecular layer interneurons (MLIs), and astrocytes, respectively. The read counts were normalized by library size, log-transformed, and then scaled by the min-max normalization to obtain the relative expression levels
Fig. 8
Fig. 8
Spatially variable genes identified by spVC in the cerebellum spatial transcriptomics data. A Relative expression levels of Fxyd6, Sparc, and Ttr. The read counts were normalized by library size, log-transformed, and then scaled by the min-max normalization to obtain the relative expression levels. B Estimated residual spatial effects (γ^0(·)) of Fxyd6, Sparc, and Ttr. C Number of genes with significant spatially varying effects of each of the six cell types. D Relative expression levels of Aldoc, Calb2, and Snhg11. E Estimated spatially varying effects of cell type proportions for Aldoc (Purkinje cells), Calb2 (granule cells), and Snhg11 (granule cells). F Expected gene expression of Aldoc, Calb2, and Snhg11 estimated by the reduced model which did not consider the spatially varying coefficients of cell type proportions. The shown values were scaled by the min-max normalization. G Expected gene expression of Aldoc, Calb2, and Snhg11 estimated by the full spVC model. The shown values were scaled by the min-max normalization
Fig. 9
Fig. 9
Application of spVC to the mouse testis dataset. A Pseudotime values of the observed spatial spots. B Relative expression levels of Lyar and Smcp. The read counts were normalized by library size, log-transformed, and then scaled by the min-max normalization to obtain the relative expression levels. C Five spot clusters identified based on the spatially varying effects (γ1(·)) of pseudotime inferred by spVC. D Distribution of pseudotime values within the five clusters shown in C. E: Eight spot clusters identified based on the observed gene expression levels. F Distribution of pseudotime values within the eight clusters shown in E. G Relative expression levels of Prm2 and Tnp1 within the five clusters shown in C. H Estimated spatially varying effects of Prm2 and Tnp1 within the five clusters shown in C

Comment on

  • Spatial Transcriptomics and In Situ Sequencing to Study Alzheimer's Disease.
    Chen WT, Lu A, Craessaerts K, Pavie B, Sala Frigerio C, Corthout N, Qian X, Laláková J, Kühnemund M, Voytyuk I, Wolfs L, Mancuso R, Salta E, Balusu S, Snellinx A, Munck S, Jurek A, Fernandez Navarro J, Saido TC, Huitinga I, Lundeberg J, Fiers M, De Strooper B. Chen WT, et al. Cell. 2020 Aug 20;182(4):976-991.e19. doi: 10.1016/j.cell.2020.06.038. Epub 2020 Jul 22. Cell. 2020. PMID: 32702314

References

    1. Walker BL, Cang Z, Ren H, Bourgain-Chang E, Nie Q. Deciphering tissue structure and function using spatial transcriptomics. Commun Biol. 2022;5(1):220. doi: 10.1038/s42003-022-03175-5. - DOI - PMC - PubMed
    1. Li K, Yan C, Li C, Chen L, Zhao J, Zhang Z, et al. Computational elucidation of spatial gene expression variation from spatially resolved transcriptomics data. Mol Ther-Nucleic Acids. 2022;27:404–411. doi: 10.1016/j.omtn.2021.12.009. - DOI - PMC - PubMed
    1. Arnol D, Schapiro D, Bodenmiller B, Saez-Rodriguez J, Stegle O. Modeling cell-cell interactions from spatial molecular data with spatial variance component analysis. Cell Rep. 2019;29(1):202–211. doi: 10.1016/j.celrep.2019.08.077. - DOI - PMC - PubMed
    1. Kleino I, Frolovaitė P, Suomi T, Elo LL. Computational solutions for spatial transcriptomics. Comput Struct Biotechnol J. 2022;20:4870–84. doi: 10.1016/j.csbj.2022.08.043. - DOI - PMC - PubMed
    1. Wang Y, Ma S, Ruzzo WL. Spatial modeling of prostate cancer metabolic gene expression reveals extensive heterogeneity and selective vulnerabilities. Sci Rep. 2020;10(1):3490. doi: 10.1038/s41598-020-60384-w. - DOI - PMC - PubMed

Publication types