Glucose Color Index: Development and Validation of a Novel Measure of the Shape of Glycemic Variability
- PMID: 38641966
- PMCID: PMC11571314
- DOI: 10.1177/19322968241245654
Glucose Color Index: Development and Validation of a Novel Measure of the Shape of Glycemic Variability
Abstract
Background: Standard continuous glucose monitoring (CGM) metrics: mean glucose, standard deviation, coefficient of variation, and time in range, fail to capture the shape of variability in the CGM time series. This information could facilitate improved diabetes management.
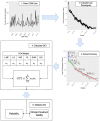
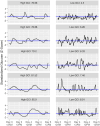
Methods: We analyzed CGM data from 141 adults with type 2 diabetes in the Hyperglycemic Profiles in Obstructive Sleep Apnea (HYPNOS) trial. Participants in HYPNOS wore CGM sensors for up to two weeks at two time points, three months apart. We calculated the log-periodogram for each time period, summarizing using disjoint linear models. These summaries were combined into a single value, termed the Glucose Color Index (GCI), using canonical correlation analysis. We compared the between-wear correlation of GCI with those of standard CGM metrics and assessed associations between GCI and diabetes comorbidities in 398 older adults with type 2 diabetes from the Atherosclerosis Risk in Communities (ARIC) study.
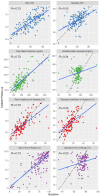
Results: The GCI achieved a test-retest correlation of R = .75. Adjusting for standard CGM metrics, the GCI test-retest correlation was R = .55. Glucose Color Index was significantly associated (p < .05) with impaired physical functioning, frailty/pre-frailty, cardiovascular disease, chronic kidney disease, and dementia/mild cognitive impairment after adjustment for confounders.
Conclusion: We developed and validated the GCI, a novel CGM metric that captures the shape of glucose variability using the periodogram signal decomposition. Glucose Color Index was reliable within participants over a three-month period and associated with diabetes comorbidities. The GCI suggests a promising avenue toward the development of CGM metrics which more fully incorporate time series information.
Keywords: CGM metrics; diabetes comorbidities; glycemic variability; type 2 diabetes.
Conflict of interest statement
Declaration of Conflicting InterestsThe author(s) declared no potential conflicts of interest with respect to the research, authorship, and/or publication of this article.
Figures


Similar articles
-
Study of Glycemic Variability in Well-controlled Type 2 Diabetic Patients Using Continuous Glucose Monitoring System.J Assoc Physicians India. 2024 Jan;72(1):18-21. doi: 10.59556/japi.71.0441. J Assoc Physicians India. 2024. PMID: 38736069
-
Limitations of 14-Day Continuous Glucose Monitoring Sampling for Assessment of Hypoglycemia and Glycemic Variability in Type 1 Diabetes.Diabetes Technol Ther. 2024 Jul;26(7):503-508. doi: 10.1089/dia.2023.0476. Epub 2024 Feb 16. Diabetes Technol Ther. 2024. PMID: 38300516 Review.
-
Within-Person and Between-Sensor Variability in Continuous Glucose Monitoring Metrics.Clin Chem. 2023 Feb 1;69(2):180-188. doi: 10.1093/clinchem/hvac192. Clin Chem. 2023. PMID: 36495162 Free PMC article. Clinical Trial.
-
Glucose profiles in obstructive sleep apnea and type 2 diabetes mellitus.Sleep Med. 2022 Jul;95:105-111. doi: 10.1016/j.sleep.2022.04.007. Epub 2022 Apr 23. Sleep Med. 2022. PMID: 35569327
-
Exploring the Continuous Glucose Monitoring in Pediatric Diabetes: Current Practices, Innovative Metrics, and Future Implications.Children (Basel). 2024 Jul 27;11(8):907. doi: 10.3390/children11080907. Children (Basel). 2024. PMID: 39201842 Free PMC article. Review.
References
Grants and funding
- R01 HL158022/HL/NHLBI NIH HHS/United States
- R01 HL086694/HL/NHLBI NIH HHS/United States
- T32 HL007024/HL/NHLBI NIH HHS/United States
- U01 HG004402/HG/NHGRI NIH HHS/United States
- 75N92022D00004/HL/NHLBI NIH HHS/United States
- R01 HL117167/HL/NHLBI NIH HHS/United States
- 75N92022D00003/HL/NHLBI NIH HHS/United States
- R01 HL087641/HL/NHLBI NIH HHS/United States
- 75N92022D00001/HL/NHLBI NIH HHS/United States
- R01 DK128837/DK/NIDDK NIH HHS/United States
- 75N92022D00002/HL/NHLBI NIH HHS/United States
- K24 HL152440/HL/NHLBI NIH HHS/United States
- K01 DK138273/DK/NIDDK NIH HHS/United States
- K23 HL118414/HL/NHLBI NIH HHS/United States
- 75N92022D00005/HL/NHLBI NIH HHS/United States
- RF1 AG074044/AG/NIA NIH HHS/United States
LinkOut - more resources
Full Text Sources

