

Baseline parenchymal blood volume is a potential prognostic imaging biomarker in patients with malignant liver tumors treated with transarterial chemoembolization
- PMID: 38642095
- PMCID: PMC11335802
- DOI: 10.1007/s00261-024-04240-9
Baseline parenchymal blood volume is a potential prognostic imaging biomarker in patients with malignant liver tumors treated with transarterial chemoembolization
Abstract
Purpose: To assess the prognostic value of Parenchymal Blood Volume (PBV) in predicting survival, tumor response, and PBV response after transarterial chemoembolization (TACE).
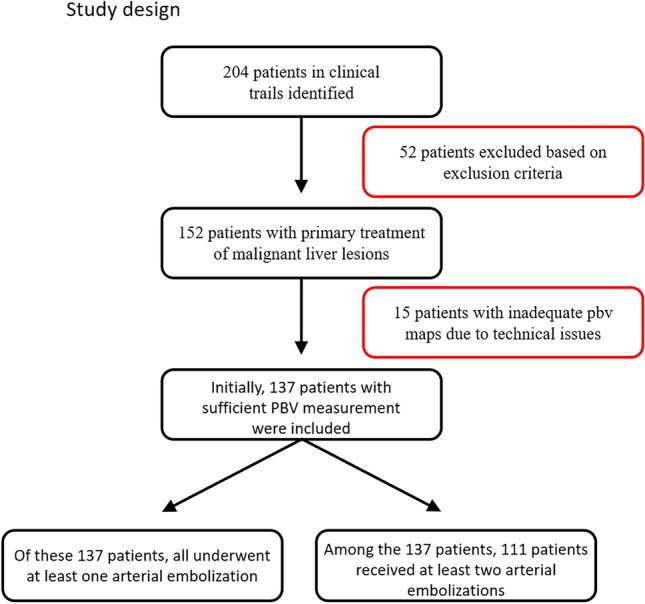
Methods: A total of 137 patients with malignant liver tumors who were treated with TACE between 07/2016 and 07/2018 were evaluated. Computed tomography illustrations were reworked at a dedicated workstation to create a PBV map which was overlapped with the associated magnetic resonance image to determine tumor diameter and PBV. Patients were divided into two groups according to their initial PBV value: PBV < 50 or ≥ 50 ml/l.
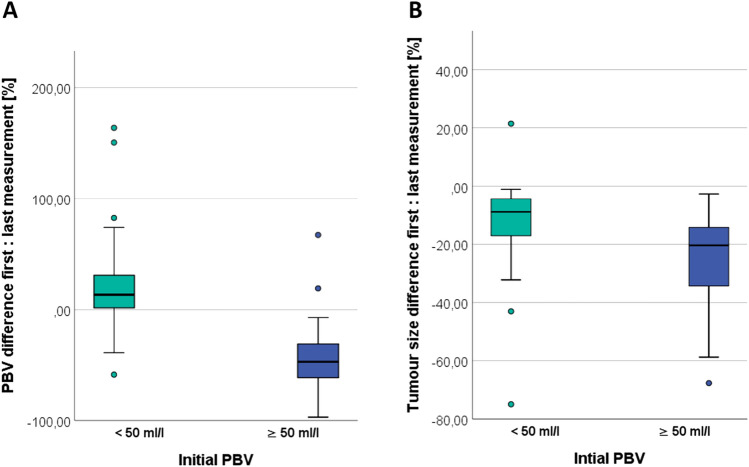
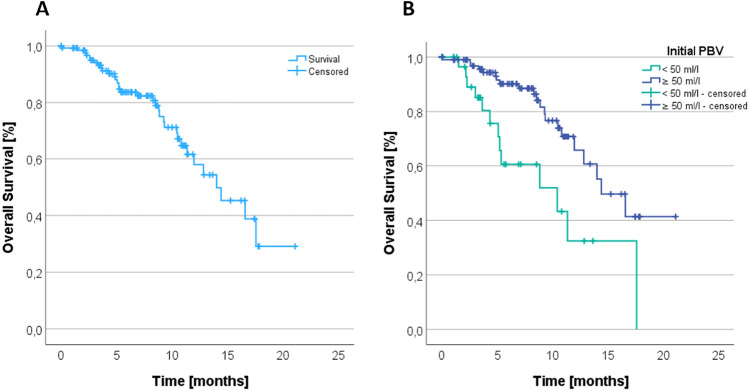
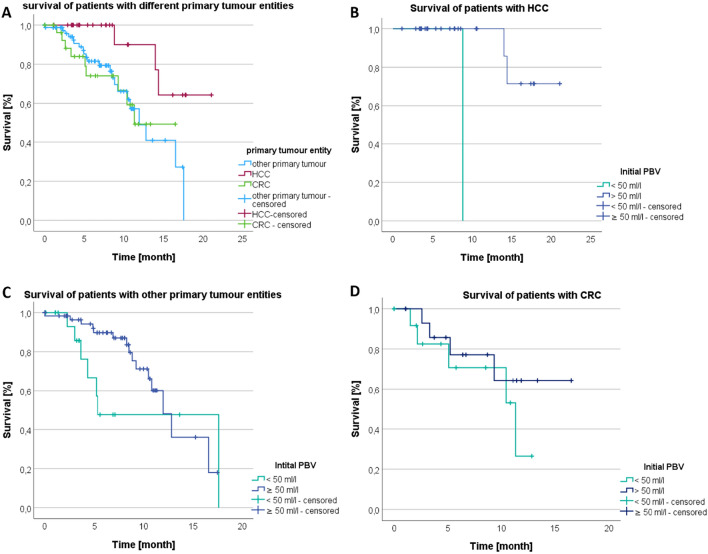
Results: Retrospectively, for patients with at least 2 TACE and initial PBV < 50 ml/l (n = 27), the tumor volume, regardless of the primary tumor type, decreased by 13.26%, and PBV showed a decrease of 23.11%. For 84 patients with PBV ≥ 50 ml/l, the tumor volume decreased by 24.01%, and PBV showed a more substantial decrease of 44.69% (both p < 0.001). In the overall study population (n = 137), patients with an initial PBV ≥ 50 ml/l (n = 101) survived for an average of 15.05 months, while patients with an initial PBV < 50 ml/l (n = 36) survived for 10.01 months (p < 0.002). Subgroup analysis indicated that median survival in the HCC group was longer at PBV ≥ 50 ml/l. For CRC and other primary tumors, the survival time for high and low initial PBV was almost identical.
Conclusion: Our study reveals a noteworthy correlation between high initial PBV values and a significant reduction in both relative and absolute tumor volume. This association suggests a potential prognostic indicator, indicating that elevated PBV may signify a more favorable response to transarterial chemoembolization (TACE). Additionally, patients with high initial PBV values experienced an extended overall survival time. Notably, the subgroup analysis highlighted a prolonged survival time in the HCC group with elevated initial PBV values. These findings underscore the potential significance of assessing PBV as a predictive factor in the context of TACE, especially in specific tumor entities such as HCC. Further investigations are essential to validate and extrapolate these observations to optimize patient outcomes.
Keywords: Liver cancer; Parenchymal blood volume; Survival; Syngo Artis Pheno; Syngo Artis Zeego; TACE; Transarterial chemoembolization.
© 2024. The Author(s).
Conflict of interest statement
The authors have no personal financial or institutional interest in any of the drugs, materials, or devices described in this article. To the best of our knowledge, this is the first retrospective study that examined the initial PBV value in relation to survival.
Figures


Similar articles
-
Intraprocedural blood volume measurement using C-arm CT as a predictor for treatment response of malignant liver tumours undergoing repetitive transarterial chemoembolization (TACE).Eur Radiol. 2016 Mar;26(3):755-63. doi: 10.1007/s00330-015-3869-y. Epub 2015 Jun 27. Eur Radiol. 2016. PMID: 26123407
-
C-arm computed tomography parenchymal blood volume measurement in evaluation of hepatocellular carcinoma before transarterial chemoembolization with drug eluting beads.Cancer Imaging. 2015 Dec 29;15:22. doi: 10.1186/s40644-015-0057-x. Cancer Imaging. 2015. PMID: 26715200 Free PMC article.
-
Parenchymal Blood Volume Assessed by C-Arm-Based Computed Tomography in Immediate Posttreatment Evaluation of Drug-Eluting Bead Transarterial Chemoembolization in Hepatocellular Carcinoma.Invest Radiol. 2016 Feb;51(2):121-6. doi: 10.1097/RLI.0000000000000215. Invest Radiol. 2016. PMID: 26488373
-
Image quality of arterial phase and parenchymal blood volume (PBV) maps derived from C-arm computed tomography in the evaluation of transarterial chemoembolization.Cancer Imaging. 2018 May 2;18(1):16. doi: 10.1186/s40644-018-0151-y. Cancer Imaging. 2018. PMID: 29720249 Free PMC article.
-
Parametric response mapping cut-off values that predict survival of hepatocellular carcinoma patients after TACE.Abdom Radiol (NY). 2018 Dec;43(12):3288-3300. doi: 10.1007/s00261-018-1610-4. Abdom Radiol (NY). 2018. PMID: 29680967 Review.
References
-
- Cejna M 2006. Chemoembolisation bei hepatozellulärem Karzinom (HCC). Journal für Gastroenterologische und Hepatologische Erkrankungen 4:12–16. DOI: 10.1055/s-2007-963285
-
- de Baere T, Arai Y, Lencioni R, Geschwind J-F, Rilling W, Salem R, Matsui O, Soulen MC (2016) Treatment of Liver Tumors with Lipiodol TACE: Technical Recommendations from Experts Opinion. Cardiovasc Intervent Radiol 39:334–343. doi: 10.1007/s00270-015-1208-y - PubMed
-
- Eisenhauer EA, Therasse P, Bogaerts J, Schwartz LH, Sargent D, Ford R, Dancey J, Arbuck S, Gwyther S, Mooney M, Rubinstein L, Shankar L, Dodd L, Kaplan R, Lacombe D, Verweij J (2009) New response evaluation criteria in solid tumours: Revised RECIST guideline (version 1.1). Eur J Cancer 45:228–247. doi: 10.1016/j.ejca.2008.10.026 - PubMed
-
- Erdmann F, Spix C, Katalinic A, Christ M, Folkerts J, Hansmann J, Kranzhöfer K, Kunz B, Manegold K, Penzkofer A, Treml K, Vollmer G, Weg-Remers S, Barnes B, Buttmann-Schweiger N, Dahm S, Fiebig J, Franke M, Gurung-Schönfeld I, Haberland J, Imhoff M, Kraywinkel K, Starker A, Von Berenberg-Gossler P, Wienecke A (2021) Krebs in Deutschland für 2017/2018. Robert Koch-Institut
-
- Ferlay J, Soerjomataram I, Dikshit R, Eser S, Mathers C, Rebelo M, Parkin DM, Forman D, Bray F (2015) Cancer incidence and mortality worldwide: Sources, methods and major patterns in GLOBOCAN 2012: Globocan 2012. Int J Cancer 136:E359–E386. doi: 10.1002/ijc.29210 - PubMed
Publication types
MeSH terms
LinkOut - more resources
Full Text Sources
Medical
Miscellaneous
