Kinship and Care: Racial Disparities in Potential Dementia Caregiving in the United States From 2000 to 2060
- PMID: 38642100
- PMCID: PMC11542221
- DOI: 10.1093/gerona/glae106
Kinship and Care: Racial Disparities in Potential Dementia Caregiving in the United States From 2000 to 2060
Abstract
Background: Although the family plays a pivotal role in older adults' care, there is limited research on how evolving demographic trends affect older adults' support networks and how the trends vary by race. To fill this gap, we examine the influence of shifting family demographics on future care needs for older adults with dementia, emphasizing the unequal health and potential caregiving burdens by race in the United States.
Methods: Using demographic models of kinship, we estimate the availability of potential caregivers, and dementia prevalence among one's kin by race, kin type, and the age of a focal person from 2000 to 2060. We introduce an index called the Dementia Dependency Ratio to assess dementia caregiving demands at the population level, taking into account the age and kinship structure of the population.
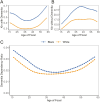
Results: Our findings suggest that Black individuals tend to have more children, grandchildren, and nieces/nephews as they age. However, Black individuals also tend to have more kin with dementia compared to their White counterparts. This elevated prevalence of dementia among Black kinship networks counterbalances the advantage of having more kin as potential caregivers. A further projection analysis suggests that the racial gap in caregiving demand within the kinship network will widen in the next 4 decades if the racial gap in dementia prevalence remains unchanged.
Conclusions: These findings emphasize the urgency of reducing racial inequality in dementia prevalence rates and increasing public support for families with extended members affected by dementia. With the shrinkage of nuclear families and population aging in the next few decades, extended family members may undertake more caregiving responsibilities for dementia. We call for a kinship perspective in understanding dementia care in future research.
Keywords: Alzheimer’s; Health disparities; Home care.
© The Author(s) 2024. Published by Oxford University Press on behalf of The Gerontological Society of America.
Conflict of interest statement
None.
Figures


Similar articles
-
Family dynamics in dementia care: A phenomenological exploration of the experiences of family caregivers of relatives with dementia.J Psychiatr Ment Health Nurs. 2022 Dec;29(6):861-872. doi: 10.1111/jpm.12822. Epub 2022 Feb 2. J Psychiatr Ment Health Nurs. 2022. PMID: 35088516
-
Comparison of informal caregiving by black and white older adults in a community population.J Am Geriatr Soc. 2000 Dec;48(12):1612-7. doi: 10.1111/j.1532-5415.2000.tb03872.x. J Am Geriatr Soc. 2000. PMID: 11129751
-
Trends in Relative Incidence and Prevalence of Dementia Across Non-Hispanic Black and White Individuals in the United States, 2000-2016.JAMA Neurol. 2021 Mar 1;78(3):275-284. doi: 10.1001/jamaneurol.2020.4471. JAMA Neurol. 2021. PMID: 33252617 Free PMC article.
-
Alcohol Use and Abuse Among Family Caregivers of People Living with Dementia in the United States: A Scoping Review.Int J Environ Res Public Health. 2024 Nov 17;21(11):1525. doi: 10.3390/ijerph21111525. Int J Environ Res Public Health. 2024. PMID: 39595792 Free PMC article.
-
Risk and Protective Factors for African American Kinship Caregiving: A Scoping Review.Child Youth Serv Rev. 2024 Jan;156:107279. doi: 10.1016/j.childyouth.2023.107279. Epub 2023 Oct 30. Child Youth Serv Rev. 2024. PMID: 37997598 Free PMC article.
Cited by
-
Exploring Caregiving Network Characteristics for Older Adults Living With Cognitive Impairment Across Race and Ethnicity.Gerontologist. 2025 May 10;65(6):gnaf110. doi: 10.1093/geront/gnaf110. Gerontologist. 2025. PMID: 40096543
-
Introduction to Supplement on Multidisciplinary Perspectives on Dementia and Related Population Health Trends.J Gerontol A Biol Sci Med Sci. 2024 Nov 7;79(Supplement_1):S1-S4. doi: 10.1093/gerona/glae212. J Gerontol A Biol Sci Med Sci. 2024. PMID: 39508729 No abstract available.
-
Young Adult Caregivers for Older Family Members: Setting a New Research Agenda.Innov Aging. 2024 Dec 28;9(4):igae112. doi: 10.1093/geroni/igae112. eCollection 2025. Innov Aging. 2024. PMID: 40231160 Free PMC article. Review.
References
-
- Redfoot D, Feinberg L, Houser A.. Baby Boom and the Growing Care Gap: A Look at Future Declines in the Availability of Family Caregiver. Vol. 12. Washington, DC: AARP Public Policy Institute; 2013. https://www.aarp.org/home-family/caregiving/info-08-2013/the-aging-of-th.... Accessed January 28, 2024.
MeSH terms
Grants and funding
LinkOut - more resources
Full Text Sources
Medical
Miscellaneous

