. 2024 Sep 16;218(1):78-92.
doi: 10.1093/cei/uxae030.

Obesity differs from diabetes mellitus in antibody and T-cell responses post-COVID-19 recovery

Affiliations

Obesity differs from diabetes mellitus in antibody and T-cell responses post-COVID-19 recovery

Mohammad Ali et al. Clin Exp Immunol. .

Abstract

Objective: Obesity and type 2 diabetes (DM) are risk factors for severe coronavirus disease 2019 (COVID-19) outcomes, which disproportionately affect South Asian populations. This study aims to investigate the humoral and cellular immune responses to SARS-CoV-2 in adult COVID-19 survivors with overweight/obesity (Ov/Ob, BMI ≥ 23 kg/m2) and DM in Bangladesh.

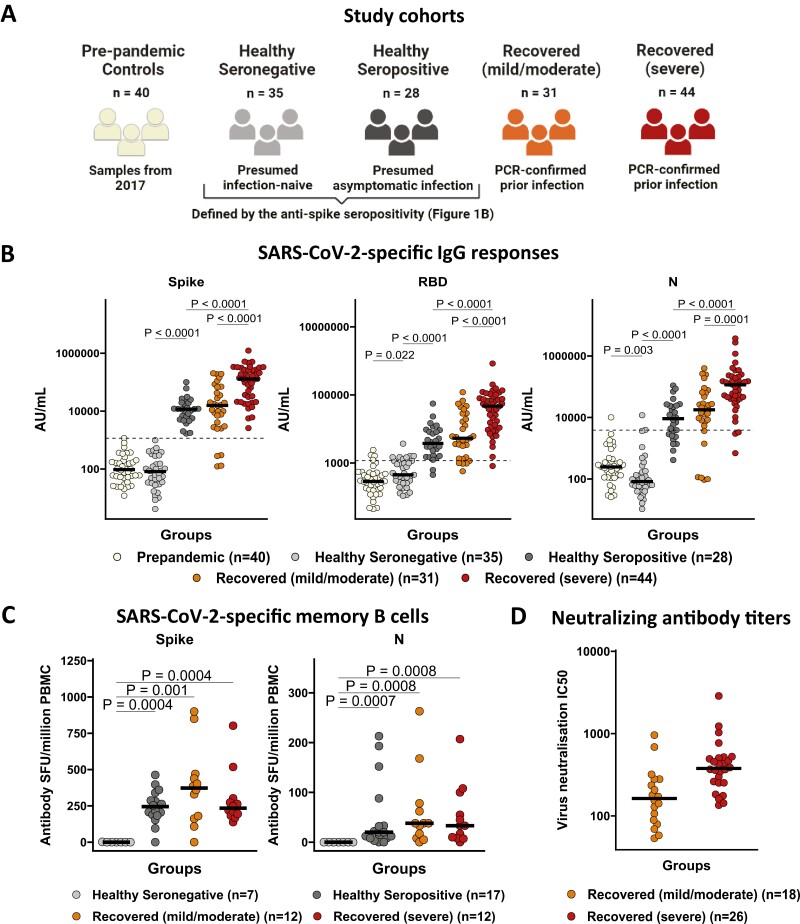
Methods: In this cross-sectional study, SARS-CoV-2-specific antibody and T-cell responses were investigated in 63 healthy and 75 PCR-confirmed COVID-19 recovered individuals in Bangladesh, during the pre-vaccination first wave of the COVID-19 pandemic in 2020.

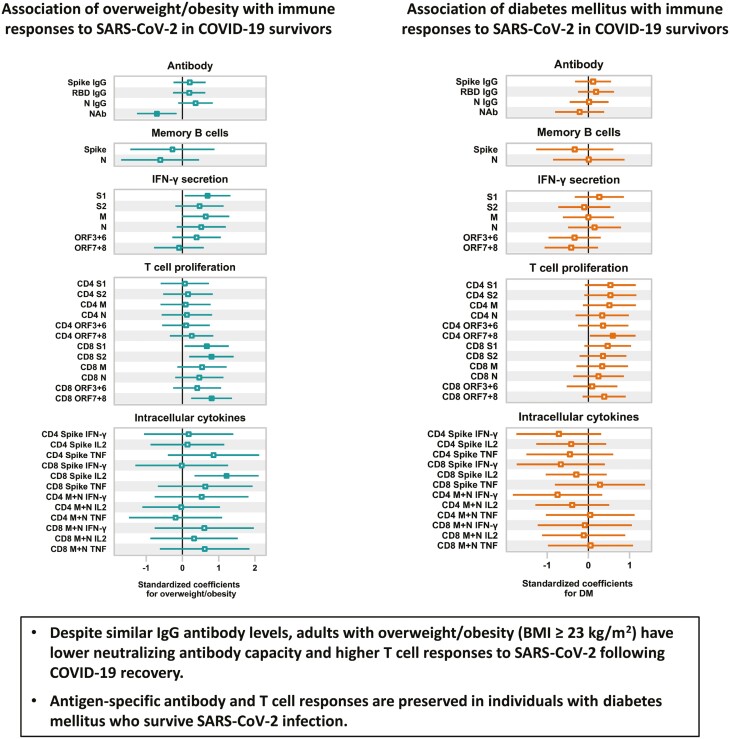
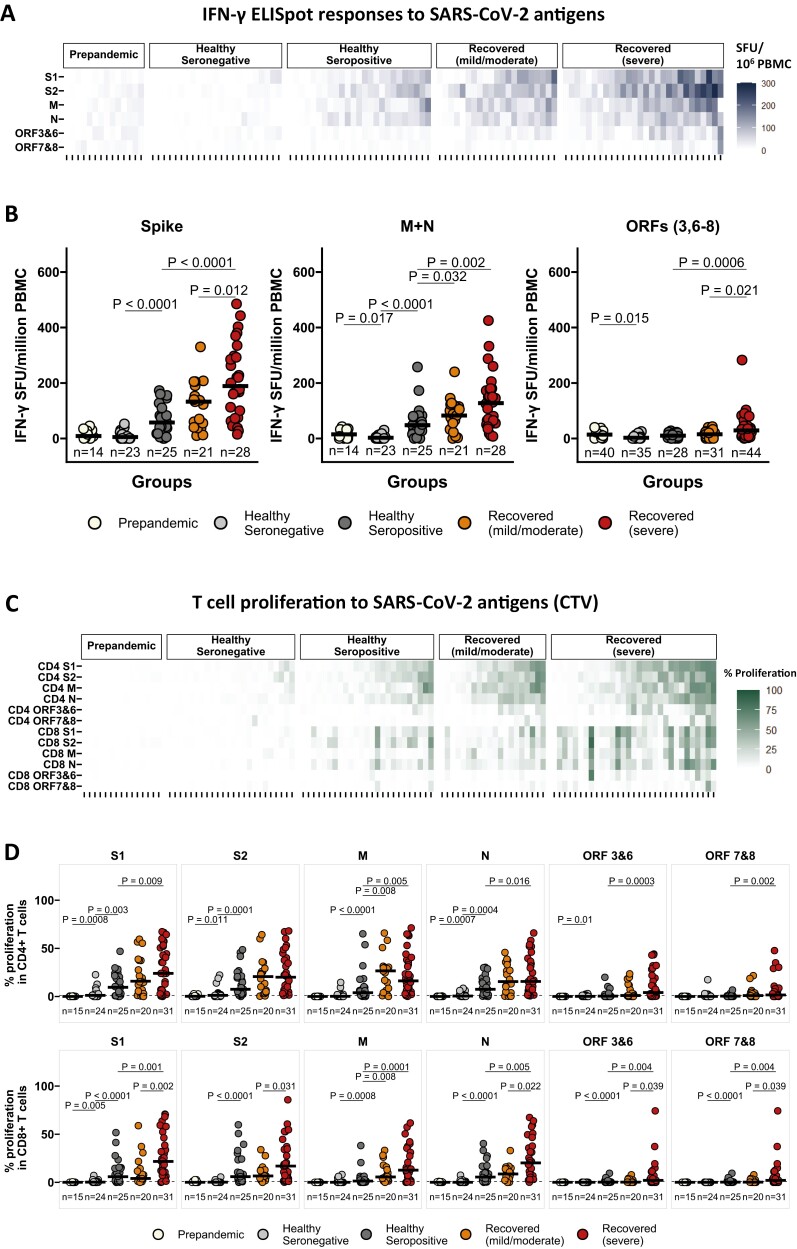
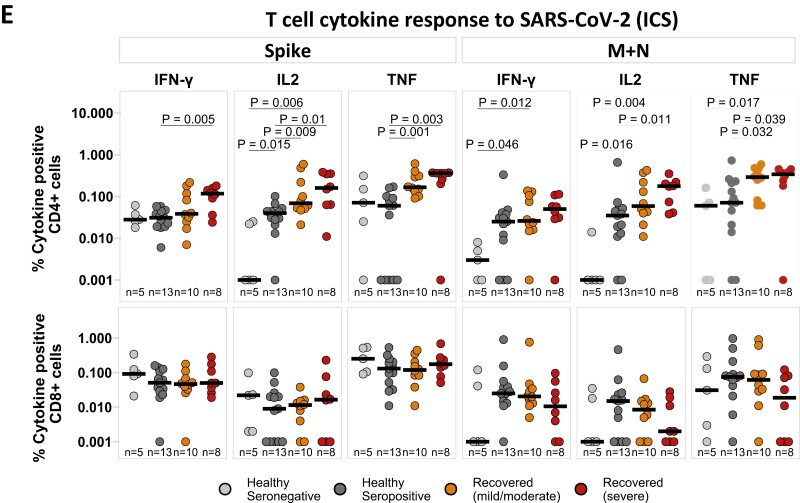
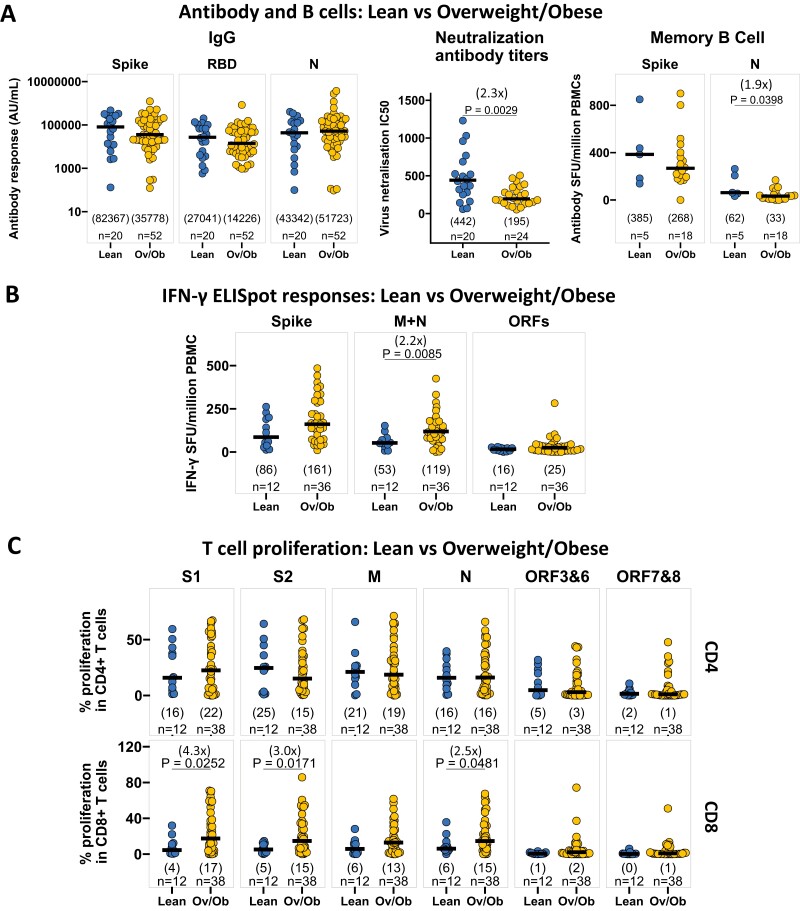
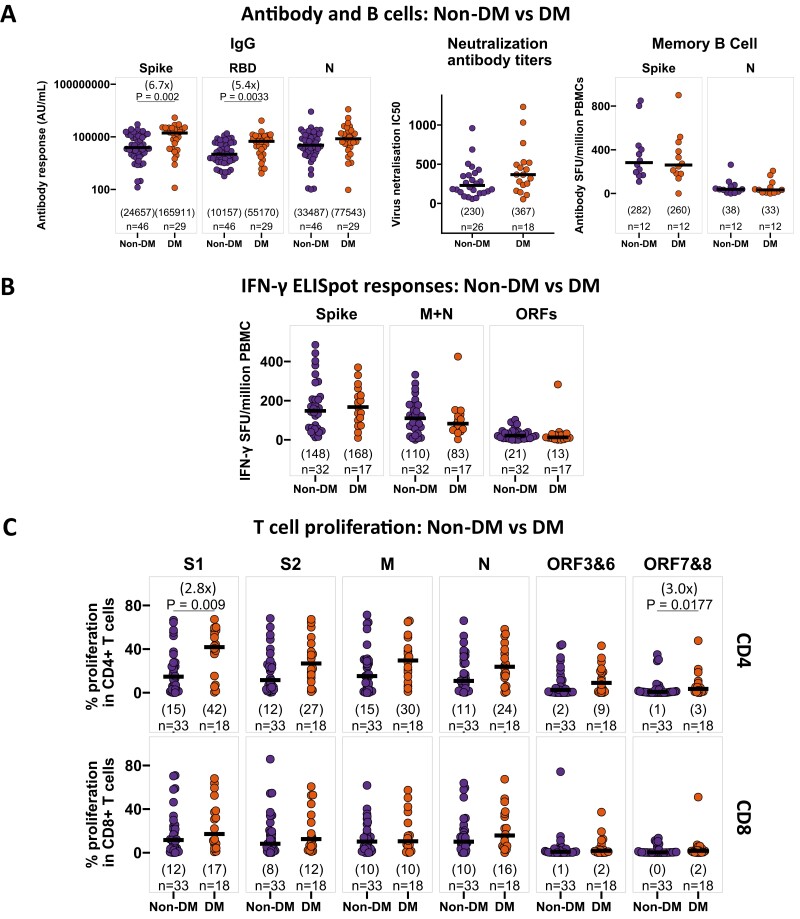
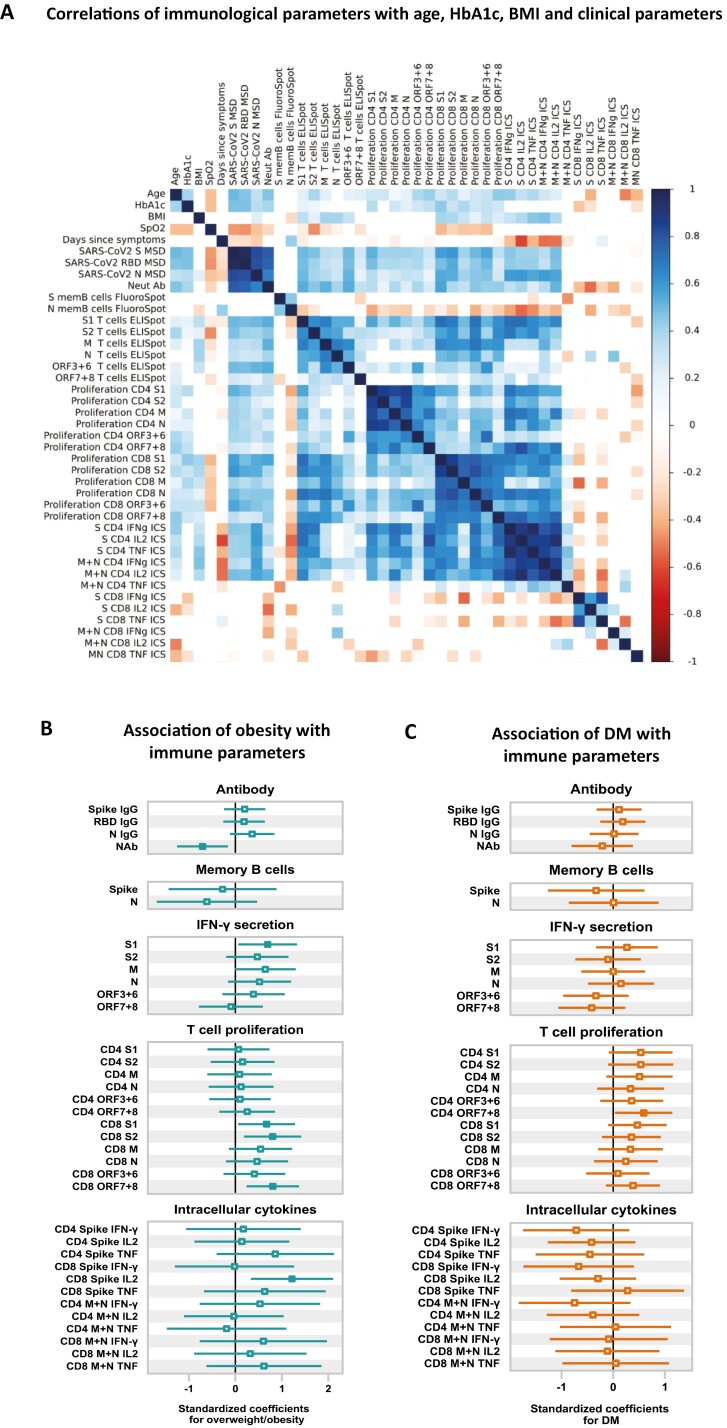
Results: In COVID-19 survivors, SARS-CoV-2 infection induced robust antibody and T-cell responses, which correlated with disease severity. After adjusting for age, sex, DM status, disease severity, and time since onset of symptoms, Ov/Ob was associated with decreased neutralizing antibody titers, and increased SARS-CoV-2 spike-specific IFN-γ response along with increased proliferation and IL-2 production by CD8 + T cells. In contrast, DM was not associated with SARS-CoV-2-specific antibody and T-cell responses after adjustment for obesity and other confounders.

Conclusion: Ov/Ob is associated with lower neutralizing antibody levels and higher T-cell responses to SARS-CoV-2 post-COVID-19 recovery, while antibody or T-cell responses remain unaltered in DM.

Keywords: COVID-19; T cell; antibody; diabetes mellitus; obesity.


Conflict of interest statement

The authors declared no conflict of interest.

Figures

Graphical Abstract
Graphical Abstract
Figure 1.
Figure 1.
SARS-CoV-2 infection induces robust antibody responses, which are more pronounced in recovery from severe illness. (A) Study cohorts including pre-pandemic controls (n = 40; recruited in Bangladesh in 2017—ivory color), healthy seronegative controls (n = 35, presumably infection naïve—gray color), healthy seropositive controls (n = 28, presumably asymptomatic infection—black color), individuals who recovered from mild/moderate disease (n = 31—orange color) and severe disease (n = 44—red color) due to PCR-confirmed symptomatic SARS-CoV-2 infection and recruited at least 28 days after onset of symptoms. Participants (except pre-pandemic controls) were recruited from September 2020 to November 2020, during Bangladesh’s first wave of the COVID-19 pandemic and prior to the global introduction of vaccines. Seropositivity status was defined by MSD IgG binding assay. (B) IgG responses to SARS-CoV-2 spike (S), receptor binding domain (RBD) and nucleocapsid (N) antigens in pre-pandemic controls (n = 40), healthy seronegative controls (n = 35), healthy seropositive controls (n = 28), individuals recovered from mild/moderate disease (n = 31), and severe illness (n = 44). IgG responses were measured in plasma samples using multiplexed MSD immunoassays and are expressed in arbitrary units (AU)/ml. Horizontal dotted lines represent the cutoff of each assay based on the pre-pandemic sera from UK individuals. (C) Spike and N-specific memory B-cell IgG responses in healthy seronegative controls (n = 7), healthy seropositive controls (n = 17), and individuals recovered from mild/moderate disease (n = 12), and severe illness (n = 12). Memory B cells were quantified by B-cell ELISpot assay from cryopreserved peripheral blood mononuclear cells (PBMC), and data are shown in antibody spot-forming units (SFU)/million PBMC. (D) Neutralizing antibody titers against SARS-CoV-2 by focus reduction neutralization (FRNT) assay in individuals recovered from mild/moderate disease (n = 18) and severe illness (n = 26). IC50 is the reciprocal dilution of the concentration of plasma required to produce a 50% reduction in infectious focus-forming units of virus in Vero cells (ATCC, CCL-81). Bars for (B) and (C) represent the medians. Groups were compared with Kruskal–Wallis nonparametric test, with only significant two-tailed P values (P < .05) shown above linking lines
Figure 2.
Figure 2.
SARS-CoV-2 infection elicits robust T-cell responses that correlate with disease severity. (A) Heatmap displaying the IFN-γ responses to SARS-CoV-2 peptide pools spanning structural and accessory proteins (S1, S2, M, N, ORF3, and 6, ORF7 and 8) in pre-pandemic controls (n = 14), healthy seronegative controls (n = 23), healthy seropositive controls (n = 25), individuals recovered from mild/moderate disease (n = 21) and severe illness (n = 28). IFN-γ responses were measured by ex vivo IFN-γ ELISpot assay from cryopreserved PBMC samples, and data are shown in IFN-γ spot-forming units (SFU)/million PBMC. (B) Comparison of IFN-γ ELISpot responses to SARS-CoV-2 spike (summed responses to S1 and S2 peptide pools), M + N (summed responses to M and N pools), and ORFs (summed responses to ORF3, 6–8) in pre-pandemic controls (n = 14), healthy seronegative controls (n = 23), healthy seropositive controls (n = 25), individuals recovered from mild/moderate disease (n = 21) and severe illness (n = 28). (C) Heatmap displaying the relative frequency of CD4+ and CD8+ T cells proliferating to individual peptide pools S1, S2, M, N, ORF3&6, and ORF7&8, assessed by flow cytometry (gating strategy shown in Supplementary Fig. S2A) from cryopreserved PBMC, in pre-pandemic controls (n = 15), healthy seronegative controls (n = 24), healthy seropositive controls (n = 25), individuals recovered from mild/moderate disease (n = 20), and severe illness (n = 31). (D) Comparison of relative frequency of CD4+ (top panels) and CD8+ (bottom panels) T cells proliferating to SARS-CoV-2 individual peptide pools in pre-pandemic controls (n = 15), healthy seronegative controls (n = 24), healthy seropositive controls (n = 25), individuals recovered from mild/moderate disease (n = 20), and severe illness (n = 31). (E) The spike and M + N-specific IFNγ, IL-2, and TNF expression levels are reported as a percentage of the CD4+ T-cell population (top panels) and CD8+ T-cell population (bottom panels). Cryopreserved PBMCs from healthy seronegative controls (n = 5), healthy seropositive controls (n = 13), and individuals recovered from mild/moderate disease (n = 10) and severe illness (n = 8) were analyzed by intracellular cytokine staining and flow cytometry (gating strategy is shown in Supplementary Fig. S2B). Bars for (B), (D), and (E) represent the medians. Groups were compared with Kruskal–Wallis nonparametric test, with only significant two-tailed P values (P < 0.05) shown above linking lines
Figure 2.
Figure 2.
SARS-CoV-2 infection elicits robust T-cell responses that correlate with disease severity. (A) Heatmap displaying the IFN-γ responses to SARS-CoV-2 peptide pools spanning structural and accessory proteins (S1, S2, M, N, ORF3, and 6, ORF7 and 8) in pre-pandemic controls (n = 14), healthy seronegative controls (n = 23), healthy seropositive controls (n = 25), individuals recovered from mild/moderate disease (n = 21) and severe illness (n = 28). IFN-γ responses were measured by ex vivo IFN-γ ELISpot assay from cryopreserved PBMC samples, and data are shown in IFN-γ spot-forming units (SFU)/million PBMC. (B) Comparison of IFN-γ ELISpot responses to SARS-CoV-2 spike (summed responses to S1 and S2 peptide pools), M + N (summed responses to M and N pools), and ORFs (summed responses to ORF3, 6–8) in pre-pandemic controls (n = 14), healthy seronegative controls (n = 23), healthy seropositive controls (n = 25), individuals recovered from mild/moderate disease (n = 21) and severe illness (n = 28). (C) Heatmap displaying the relative frequency of CD4+ and CD8+ T cells proliferating to individual peptide pools S1, S2, M, N, ORF3&6, and ORF7&8, assessed by flow cytometry (gating strategy shown in Supplementary Fig. S2A) from cryopreserved PBMC, in pre-pandemic controls (n = 15), healthy seronegative controls (n = 24), healthy seropositive controls (n = 25), individuals recovered from mild/moderate disease (n = 20), and severe illness (n = 31). (D) Comparison of relative frequency of CD4+ (top panels) and CD8+ (bottom panels) T cells proliferating to SARS-CoV-2 individual peptide pools in pre-pandemic controls (n = 15), healthy seronegative controls (n = 24), healthy seropositive controls (n = 25), individuals recovered from mild/moderate disease (n = 20), and severe illness (n = 31). (E) The spike and M + N-specific IFNγ, IL-2, and TNF expression levels are reported as a percentage of the CD4+ T-cell population (top panels) and CD8+ T-cell population (bottom panels). Cryopreserved PBMCs from healthy seronegative controls (n = 5), healthy seropositive controls (n = 13), and individuals recovered from mild/moderate disease (n = 10) and severe illness (n = 8) were analyzed by intracellular cytokine staining and flow cytometry (gating strategy is shown in Supplementary Fig. S2B). Bars for (B), (D), and (E) represent the medians. Groups were compared with Kruskal–Wallis nonparametric test, with only significant two-tailed P values (P < 0.05) shown above linking lines
Figure 3.
Figure 3.
Overweight/obesity is associated with lower neutralizing antibody titers and memory B-cell responses, but higher T responses to SARS-CoV-2 in participants who survived COVID-19 with symptoms. (A) Comparison of SARS-CoV-2 spike, RBD, N-specific IgG responses, neutralizing antibody titers, and spike, N-specific memory B cells in lean (BMI = 18.5–22.9 kg/m2) and overweight/obese (BMI ≥ 23 kg/m2) individuals, who recovered from symptomatic SARS-CoV-2 infection. IgG responses, neutralizing antibody titers, and memory B-cell responses are measured by multiplexed MSD immunoassays, Focus reduction neutralization (FRNT) assay, and B-cell ELISpot assay, respectively, and data are shown in arbitrary units (AU)/ml, IC50, and antibody spot-forming units (SFU)/million PBMC respectively. (B) Comparison of IFN-γ ELISpot responses to SARS-CoV-2 spike (summed responses to S1 and S2 peptide pools), M + N (summed responses to M and N pools), and ORFs (summed responses to ORF3, 6–8) from cryopreserved PBMCs in lean (BMI = 18.5–22.9 kg/m2) and overweight/obese (BMI ≥ 23 kg/m2) individuals in recovery following symptomatic SARS-CoV-2 infection. Data are shown in IFN-γ spot-forming units (SFU)/million PBMC. (C) Comparison of the relative frequency of CD4+ (top panels) and CD8+ (bottom panels) T cells proliferating to individual peptide pools S1, S2, M, N, ORF3&6, ORF7&8, assessed by flow cytometry (gating strategy shown in Supplementary Fig. S2A) from cryopreserved PBMC, in lean (BMI = 18.5–22.9 kg/m2) and overweight/obese (BMI ≥ 23 kg/m2) SARS-CoV-2-recovered patients. A two-tailed Wilcoxon rank-sum test was used to compare between the groups (without correction for multiple testing), and fold changes in brackets referring to the P value comparisons directly below are shown on the top of the dot plots, in case of significant differences. The number of individuals (n) evaluated per assay is displayed at the bottom of the corresponding dot plots. Horizontal bars represent the medians, and the median values are shown in brackets immediately above the number of individuals (n) in each column
Figure 4.
Figure 4.
Antiviral antibody and T-cell responses in participants with diabetes mellitus following recovery from symptomatic SARS-CoV-2 infection. (A) Comparison of SARS-CoV-2 spike, RBD, N-specific IgG responses, neutralizing antibody titers, and spike, N-specific memory B cells in non-diabetic (non-DM, HbA1c < 6.5%) and diabetic (DM, HbA1c ≥ 6.5%) individuals, who recovered from symptomatic SARS-CoV-2 infection. IgG responses, neutralizing antibody titers, and memory B-cell responses are measured by multiplexed MSD immunoassays, focus reduction neutralization (FRNT) assay, and B-cell ELISpot assay, respectively, and data are shown in arbitrary units (AU)/ml, IC50, and antibody spot-forming units (SFU)/million PBMC, respectively. (B) Comparison of IFN-γ ELISpot responses to SARS-CoV-2 spike (summed responses to S1 and S2 peptide pools), M + N (summed responses to M and N pools), and ORFs (summed responses to ORF3, 6–8) from cryopreserved PBMCs in recovered patients with or without diabetes, following symptomatic SARS-CoV-2 infection. Data are shown in IFN-γ spot-forming units (SFU)/million PBMC. (C) Comparison of the relative frequency of CD4+ (top panels) and CD8+ (bottom panels) T cells proliferating to individual peptide pools S1, S2, M, N, ORF3&6, ORF7&8, assessed by flow cytometry (gating strategy shown in Supplementary Fig. S2A) from cryopreserved PBMC, in SARS-CoV-2-recovered patients with or without diabetes. A two-tailed Wilcoxon rank-sum test was used to compare between the groups (without correction for multiple testing), and fold changes in brackets referring to the P value comparisons directly below are shown on the top of the dot plots, in case of significant differences. The number of individuals (n) evaluated per assay is displayed at the bottom of the corresponding dot plots. Horizontal bars represent the medians, and the median values are shown in brackets immediately above the number of individuals (n) in each column
Figure 5.
Figure 5.
Associations of obesity and diabetes mellitus with antibody, memory B cell, and T-cell responses to SARS-CoV-2. (A) Correlations of immunological parameters with age, HbA1c, BMI, SpO2 (lowest recorded oxygen saturation in blood during infection), and days post-symptoms onset in SARS-CoV-2-recovered patients. Spearman’s correlation coefficient (color coded) and only significant values are shown after adjusting for multiple testing using the Benjamini–Hochberg correction at the significance threshold FDR < 0.05. (B) Forest plot illustrating associations of overweight/obesity with antibody, memory B cells, IFN-γ secretion, T-cell proliferation, and intracellular cytokine responses to SARS-CoV-2 in recovered patients. The point estimates represent the standardized unit changes of immunological parameters in overweight/obesity, while adjusted for age, sex, diabetes status, disease severity, and days post-symptoms onset. (C) Forest plot illustrating associations of diabetes mellitus with immune responses to SARS-CoV-2 in recovered patients. The point estimates represent the standardized unit changes of immunological parameters in diabetes, while adjusted for age, sex, obesity status, disease severity, and days post-symptoms onset. Error bars represent 95% confidence intervals. The non-significant (P ≥ 0.05) results are displayed as hollow points. Detailed results from regression models are shown in Supplementary Table S2. Error bars for (B) and (C) represent 95% confidence intervals, and the non-significant (P ≥ 0.05) results are displayed as hollow points. Detailed results from regression models used for (B) and (C) are shown in Supplementary Table S2a–f.

References

    1. Zhou F, Yu T, Du R, Fan G, Liu Y, Liu Z, et al. Clinical course and risk factors for mortality of adult inpatients with COVID-19 in Wuhan, China: a retrospective cohort study. Lancet (London, England) 2020, 395, 1054–62. doi: 10.1016/S0140-6736(20)30566-3 - DOI - PMC - PubMed
    1. Lighter J, Phillips M, Hochman S, Sterling S, Johnson D, Francois F, et al. Obesity in patients younger than 60 years is a risk factor for Covid-19 hospital admission. Clin Infect Dis 2020, 71, 896–7. doi: 10.1093/cid/ciaa415 - DOI - PMC - PubMed
    1. Palaiodimos L, Kokkinidis DG, Li W, Karamanis D, Ognibene J, Arora S, et al. Severe obesity, increasing age and male sex are independently associated with worse in-hospital outcomes, and higher in-hospital mortality, in a cohort of patients with COVID-19 in the Bronx, New York. Metabolism 2020, 108, 154262. doi: 10.1016/j.metabol.2020.154262 - DOI - PMC - PubMed
    1. Hendren NS, De Lemos JA, Ayers C, Das SR, Rao A, Carter S, et al. Association of body mass index and age with morbidity and mortality in patients hospitalized with COVID-19: results from the American Heart Association COVID-19 Cardiovascular Disease Registry. Circulation 2021, 143, 135–44. doi: 10.1161/CIRCULATIONAHA.120.051936 - DOI - PubMed
    1. Gao M, Piernas C, Astbury NM, Hippisley-Cox J, O'Rahilly S, Aveyard P, et al. Associations between body-mass index and COVID-19 severity in 6·9 million people in England: a prospective, community-based, cohort study. The Lancet Diabetes Endocrinol 2021, 9, 350–9. doi: 10.1016/S2213-8587(21)00089-9 - DOI - PMC - PubMed

MeSH terms