. 2024 May 21;5(5):101520.
doi: 10.1016/j.xcrm.2024.101520. Epub 2024 Apr 19.

Myosin inhibitor reverses hypertrophic cardiomyopathy in genotypically diverse pediatric iPSC-cardiomyocytes to mirror variant correction

Affiliations

Myosin inhibitor reverses hypertrophic cardiomyopathy in genotypically diverse pediatric iPSC-cardiomyocytes to mirror variant correction

Caroline Kinnear et al. Cell Rep Med. .

Abstract

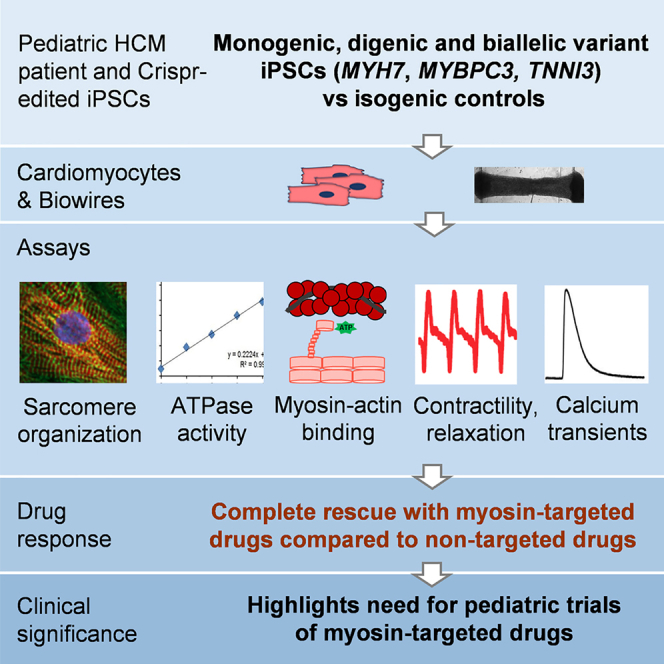
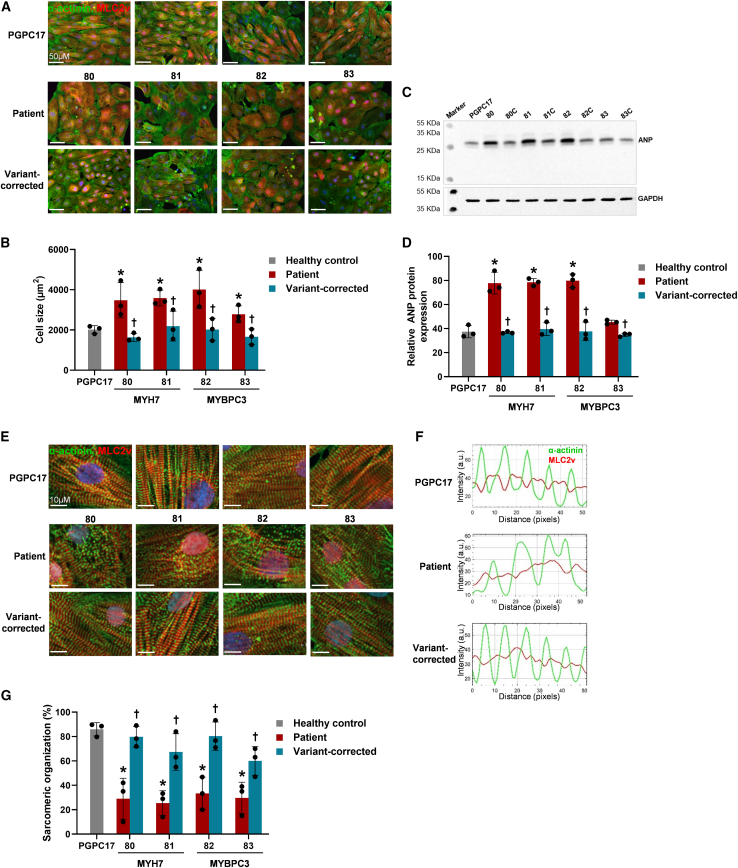
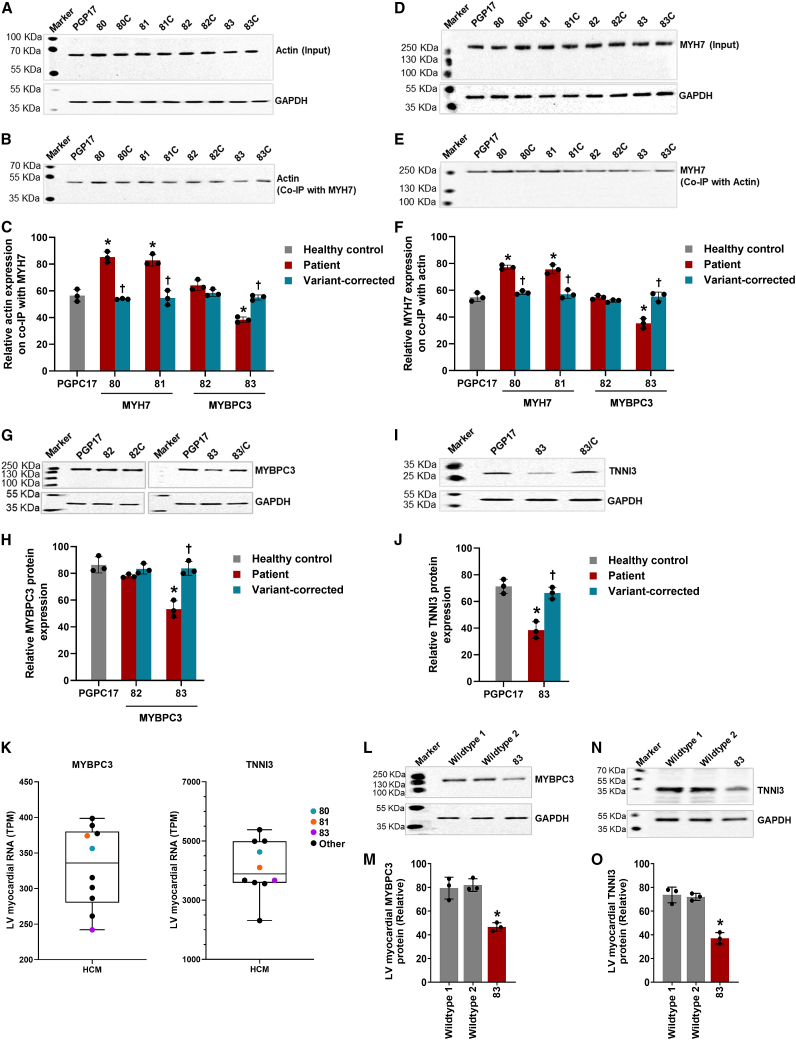
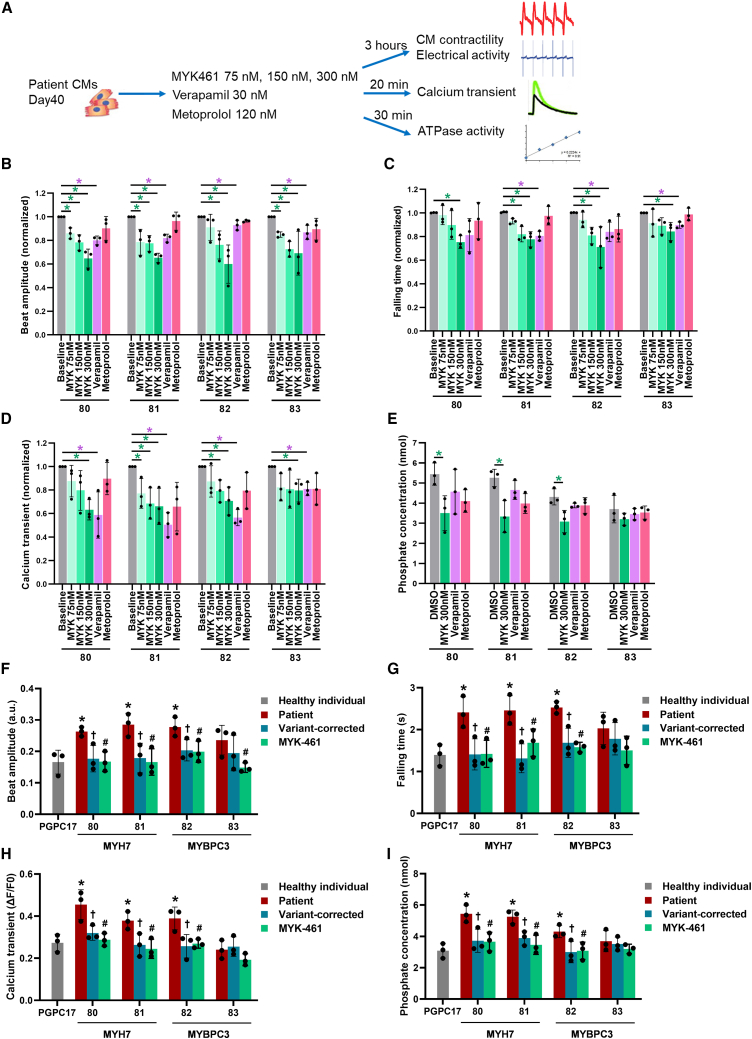
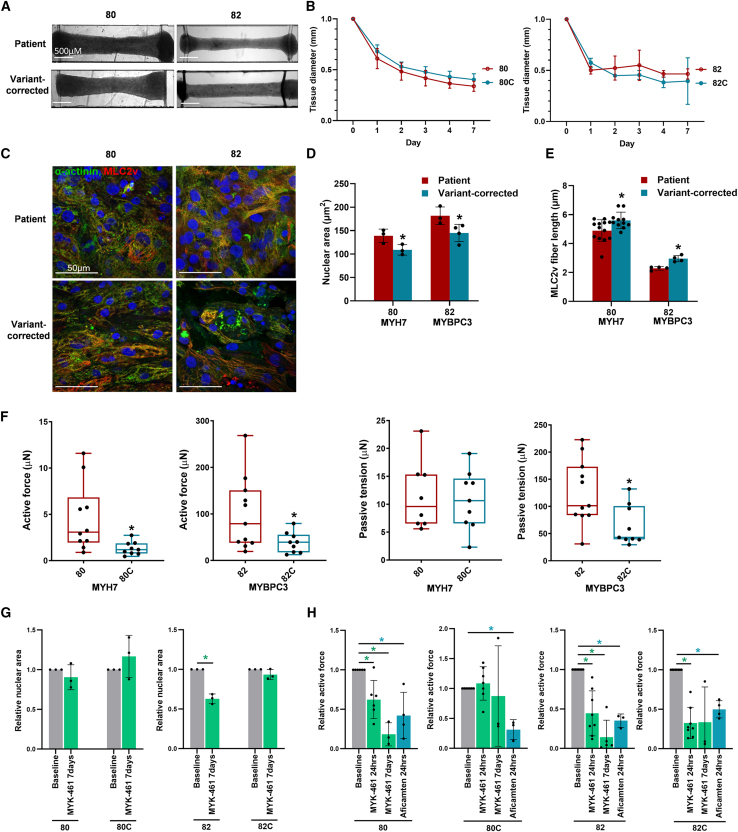
Pathogenic variants in MYH7 and MYBPC3 account for the majority of hypertrophic cardiomyopathy (HCM). Targeted drugs like myosin ATPase inhibitors have not been evaluated in children. We generate patient and variant-corrected iPSC-cardiomyocytes (CMs) from pediatric HCM patients harboring single variants in MYH7 (V606M; R453C), MYBPC3 (G148R) or digenic variants (MYBPC3 P955fs, TNNI3 A157V). We also generate CMs harboring MYBPC3 mono- and biallelic variants using CRISPR editing of a healthy control. Compared with isogenic and healthy controls, variant-positive CMs show sarcomere disorganization, higher contractility, calcium transients, and ATPase activity. However, only MYH7 and biallelic MYBPC3 variant-positive CMs show stronger myosin-actin binding. Targeted myosin ATPase inhibitors show complete rescue of the phenotype in variant-positive CMs and in cardiac Biowires to mirror isogenic controls. The response is superior to verapamil or metoprolol. Myosin inhibitors can be effective in genotypically diverse HCM highlighting the need for myosin inhibitor drug trials in pediatric HCM.

Keywords: CRISPR gene editing; MYBPC3; MYH7; cardiomyocytes; hypertrophic cardiomyopathy; induced pluripotent stem cells; metoprolol; myosin ATPase inhibitor; pediatric; verapamil.


Conflict of interest statement

Declaration of interests S.M. is a consultant for Bristol Myers Squibb and Tenaya Therapeutics. M.R. and Y.Z. are inventors on an issued US patent covering Biowire tissue fabrication. They receive royalties from Valo Health. M.R. has a consulting agreement with Valo Health and had a consulting agreement with Tenaya Therapeutics. M.R. and Y.Z. are co-founders of TARA Biosystems Inc. and held equity in the company until April 2022.

Figures

None
Graphical abstract
Figure 1
Figure 1
Location of variants in functional protein domains (A) Cardiac beta-myosin heavy chain encoded by the MYH7 gene, consists of three regions: subfragment 1 (S1) or the head, subfragment 2 (S2) or the neck, and light meromyosin (LMM), also known as the tail. Arrows demonstrate the missense variants - V606M (patient 80) and R453C (patient 81) located in the region responsible for binding to actin. (B) Cardiac myosin-binding protein C3 (MYBP-C3). Ovals represent immunoglobulin-like domains and rectangles represent fibronectin type III domains. P/A is the proline/alanine region and M the phosphorylatable domain. The G148R missense variant (patient 82 and ∗MYBPC3 gene-edited line in green) is located in the actin binding region, the R502W missense variant (∗MYBPC3 gene-edited line in green) targets the C3 central domain, while the P955fs protein-truncating variant (patient 83) is located in the region that incorporates into the A band of the sarcomere. See also Figure S1 and Table S1.
Figure 2
Figure 2
Cardiomyocyte size and sarcomere organization in healthy control, HCM patient, and variant-corrected iPSC-CMs Representative images and bar graphs showing results of immunofluorescence staining with α-actinin (green) and MLC2v (red) of healthy control, patient, and variant-corrected CMs. (A and B) Myocyte size: All four patient lines showed increased myocyte size (3465 ± 512 μM2) compared with PGPC17 (2022 ± 194 μM2). Variant correction restored myocyte size to that seen in PCPC17 control line (1878 ± 274 μM2). (C and D) ANP protein expression, cardiomyocyte hypertrophy marker, on western blots was higher in cell lysates from 80, 81, and 82 patient CMs compared with PGPC17 and variant-corrected CMs. (E–G) Sarcomere organization was measured using line-scan analysis of α-actinin and MLC2v fluorescence intensity longitudinally throughout myofibers. PGPC17 control showed 85% ± 5% CMs with well-aligned myosin-actin filaments. The four patient lines (80, 81, 82, 83) showed a low percentage of CMs with organized sarcomeres (29% ± 3%). CMs with sarcomere organization significantly improved in variant-corrected lines to 72% ± 10%. ∗p < 0.05 patient vs. PGPC17, p < 0.05 patient vs. variant-corrected. n = 3 independent experiments, using four technical replicates for each experiment. Error bars represent standard deviation. 80, MYH7 V606M; 81, MYH7 R453C; 82, MYBPC3 G148R; 83, MYBPC3 P955fs and TNNI3 A157V. CM, cardiomyocytes; MLC2v, ventricular myosin light chain 2; ANP, atrial natriuretic peptide. See also Table S2.
Figure 3
Figure 3
Contractile and electrophysiological phenotype of healthy control, HCM patient, and variant-corrected iPSC-CMs (A) Beat amplitude (serial recordings) measured using the real-time cell analysis (RTCA) CardioECR xCELLigence system from day 30–40 was higher in patient 80 compared with PGPC17 healthy control and variant-corrected CMs. (B–H) Bar graphs showing averaged values for functional parameters at day 40. (B) Beat amplitude and (C) falling time were higher in 80, 81, and 82 patient CMs compared with PGPC17 control. Both abnormalities were rescued in the variant-corrected lines. The 83 CMs did not show higher beat amplitude or higher falling time compared with PGPC17. (D) Beat rate, (E) field potential amplitude, and (F) field potential duration were not different between HCM patient CMs compared with PGPC17 control and variant-corrected CMs. (G) Calcium transients: ΔF/F0, ratio of peak fluorescence intensity to baseline intensity, was higher in 80, 81, and 82 compared with PGPC17 and variant-corrected CMs. (H) ATPase activity: Phosphate concentration, a measure of ATPase activity, was higher in 80, 81, and 82 compared with PGPC17 and variant-corrected CMs. ∗p < 0.05 patient vs. PGPC17, p < 0.05 patient vs. corrected. n = 3 independent experiments, using four technical replicates for each experiment. Error bars represent standard deviation. 80, MYH7 V606M; 81, MYH7 R453C; 82, MYBPC3 G148R; 83, MYBPC3 P955fs and TNNI3 A157V. CM, cardiomyocytes; a.u., arbitrary unit; bpm, beat per minute. See also Table S2.
Figure 4
Figure 4
Myosin-actin co-immunoprecipitation in iPSC-CM lysates (A) Baseline actin protein expression by western blots was not different in cell lysates from patient compared with control and variant-corrected CMs (representative blots shown). GAPDH was used as the housekeeping protein. (B and C) Actin protein expression on co-immunoprecipitation (co-IP) with anti-MYH7 antibody (representative blots and quantification relative to GAPDH): There was higher actin protein expression on co-IP with MYH7 antibody in 80 and 81 patient CMs but not in 82 patient CMs compared with PGPC17 control and variant-corrected CMs. Actin protein expression was lower on co-IP with MYH7 antibody in 83 patient CMs compared with PGPC17 control and variant-corrected CMs. (D) Baseline MYH7 protein expression on western blots was not different in cell lysates from control, patient, and variant-corrected CMs. (E and F) MYH7 protein expression on co-IP with anti-actin antibody: There was higher MYH7 protein expression on co-IP with actin antibody in 80 and 81 patient CMs, but not in 82 patient CMs compared with PGPC17 control and variant-corrected lines. MYH7 protein expression was lower on co-IP with actin antibody in 83 patient CMs compared with PGPC17 control and variant-corrected CMs. (G and H) Baseline MYBPC3 expression in MYBPC3 mutant lines: MYBPC3 protein levels were not different in 82 patient CMs compared with controls but were lower in 83 compared with PGPC17 and variant-corrected CMs. (I and J) Baseline TNNI3 expression: TNNI3 protein expression levels were significantly lower in 83 patient CMs compared with PGPC17 and variant-corrected CMs. (K–O) MYBPC3 and TNNI3 RNA and protein expression in LV myocardium. (K) Boxplot showing the mean and range (minimum to maximum) expression. RNA sequencing performed on LV myocardium from patients 80, 81, and 83 and seven other HCM patients showed lower MYBPC3 mRNA levels and borderline low TNNI3 levels in patient 83 compared with other HCM patients. (L and M) MYBPC3 protein expression in LV myocardium using western blot was lower in patient 83 compared with wild-type controls. (N and O) TNNI3 protein expression in LV myocardium using western blot was lower in patient 83 compared with wild-type controls. ∗p < 0.05 patient vs. PGPC17, p < 0.05 patient vs. corrected. n = 3 independent experiments. Error bars represent standard deviation. 80, MYH7 V606M; 81, MYH7 R453C; 82, MYBPC3 G148R; 83, MYBPC3 P955fs and TNNI3 A157V. CM, cardiomyocytes; LV, left ventricular; TPM, transcript per million. See also Table S2.
Figure 5
Figure 5
Drug responses to MYK-461, verapamil, and metoprolol in HCM patient iPSC-CMs (A) Schematic illustration of drug treatment (dose and duration) and functional assays to assess drug response. (B) Beat amplitude: MYK-461 caused a dose-dependent decrease in beat amplitude in all HCM patient lines. Verapamil also reduced beat amplitude in all patient CMs, but this effect was lower than that seen with highest dose of MYK-461. Metoprolol had no effect. (C) Falling time: MYK-461 caused a dose-dependent decrease in falling time in all HCM patient CMs. Verapamil decreased falling time in 81, 82, and 83 CMs but not in 81, while metoprolol had no effect on falling time. (D) Calcium transients: MYK-461 caused a dose-dependent decrease in calcium transients in all four patient CMs but the response was blunted in 83 CMs. Verapamil decreased calcium transients in all four patient CMs but the response was blunted in 83 CMs. Metoprolol had no effect. (E) ATPase activity: MYK-461 decreased ATPase activity in 80, 81, and 82 CMs but not in 83 CMs. Verapamil and metoprolol had no effect. (F–I) Effect of highest MYK-461 dose compared with PGPC17 control and with variant-corrected lines. (F) Beat amplitude: MYK-461 (300 nM) decreased abnormal beat amplitude to the same level as PGPC17 and variant-corrected lines in all HCM patient CMs. (G) Falling time, (H) calcium transients, and (I) ATPase activity were decreased by MYK-461 treatment in 80, 81, and 82 CMs to levels seen in PGPC17 and variant-corrected CMs. ∗p < 0.05, p < 0.05 patient vs. corrected, #p < 0.05 patient vs. MYK-461. n = 3 independent experiments, using four technical replicates for each experiment. Error bars represent standard deviation. (B)–(D) Drug treatment values were normalized to pre-treatment. 80, MYH7 V606M; 81, MYH7 R453C; 82, MYBPC3 G148R; 83, MYBPC3 P955fs and TNNI3 A157V. CM, cardiomyocytes; a.u., arbitrary unit; ΔF/F0, ratio of peak fluorescence intensity to baseline intensity. See also Table S3.
Figure 6
Figure 6
Phenotype and effect of myosin inhibitors on MYBPC3 gene-edited iPSC-CMs (A) Sarcomere organization was reduced in all 3 MYBPC3 edited CMs compared with PGPC17 control CMs (65 ± 1.9% vs. 79 ± 6.8%). (B) Beat amplitude was higher in biallelic but not in G148R and R502W CMs compared with PGPC17 CMs. (C) Calcium transients were higher in G148R and biallelic CMs compared with PGPC17 CMs. (D) ATPase activity was higher in all 3 MYBPC3 edited CMs compared with PGPC17 CMs. (E) Baseline actin protein expression by western blots was not different in cell lysates from MYBPC3 edited compared with PGPC17 control CMs (representative blots). GAPDH was used as the housekeeping protein. (F and G) Actin protein expression on co-immunoprecipitation with anti-MYH7 antibody (representative blots and quantification relative to GAPDH) was higher in R502W and biallelic CMs, but not in G148R CMs compared with PGPC17 control CMs. (H) Baseline MYH7 protein expression on western blots was not different in cell lysates from controls and MYPBC3 edited CMs. (I and J) MYH7 protein expression on co-immunoprecipitation with anti-actin antibody was higher in R502W and biallelic CMs, but not in G148R CMs compared with PGPC17 control CMs. (K and L) Baseline MYBPC3 expression in MYBPC3 CMs was not different in G148R CMs compared with control CMs but were lower in R502W and biallelic CMs compared with PGPC17 control CMs. (M) Effect of myosin inhibitors on beat amplitude: MYK-461 reduced beat amplitude in all MYBPC3 edited CMs at 3 h and 48 h of treatment. Aficamten decreased beat amplitude at 3 h. (N) Effect of myosin inhibitors on beat amplitude calcium transients: MYK-461 and aficamten decreased calcium transients in all MYBPC3 CMs. ∗p < 0.05. n = 3–6 independent experiments, using four technical replicates for each experiment. Error bars represent standard deviation. CM, cardiomyocytes; a.u., arbitrary unit; ΔF/F0, ratio of peak fluorescence intensity to baseline intensity; Co-IP, co-immunoprecipitation; Comp. het., compound heterozygous. See also Figure S6 and Table S4.
Figure 7
Figure 7
Phenotype and effect of myosin inhibitors on cardiac Biowires from patient and variant-corrected iPSC-CMs (A) Bright field images of Biowires (day 7 of seeding) from 80 to 82 patient CMs within microwells. (B) Tissue compaction increased from day 0 to day 7 in patient and variant-corrected Biowires. (C) Confocal images (representative) of Biowire tissues immunostained for α-actinin and MLC2v. (D) Nuclear area was larger in patient Biowires compared with variant-corrected Biowires. (E) Fiber length (MLC2v) was lower in patient Biowires (suggesting sarcomere disorganization) compared with variant-corrected Biowires. (F) Active force was higher in patient Biowires compared with variant-corrected Biowires. Passive tension was only higher in 82 patient Biowires compared with variant-corrected Biowires. (G) Effect of MYK-461 on nuclear area. Nuclear area was reduced in 82 but not 80 patient Biowires after 7 days of treatment. (H) Effect of myosin inhibitors on active force. MYK-461 (24 h and 7 days of treatment) and aficamten (24-h treatment) reduced active force in 80 and 82 patient Biowires and in 82 variant-corrected Biowires. Aficamten also reduced active force in 80 variant-corrected Biowires. ∗p < 0.05. n = 3 to 13 biological replicates. Error bars represent standard deviation. 80, MYH7 V606M; 82, MYBPC3 G148R. CMs, cardiomyocytes; MLC2v, ventricular myosin light chain 2. See also Tables S2 and S3.

References

    1. Maron B.J. Hypertrophic cardiomyopathy: a systematic review. JAMA. 2002;287:1308–1320. doi: 10.1001/jama.287.10.1308. - DOI - PubMed
    1. Garfinkel A.C., Seidman J.G., Seidman C.E. Genetic Pathogenesis of Hypertrophic and Dilated Cardiomyopathy. Heart Fail. Clin. 2018;14:139–146. doi: 10.1016/j.hfc.2017.12.004. - DOI - PMC - PubMed
    1. Keren A., Syrris P., McKenna W.J. Hypertrophic cardiomyopathy: the genetic determinants of clinical disease expression. Nat. Clin. Pract. Cardiovasc. Med. 2008;5:158–168. doi: 10.1038/ncpcardio1110. - DOI - PubMed
    1. Maron B.J., Maron M.S., Semsarian C. Genetics of hypertrophic cardiomyopathy after 20 years: clinical perspectives. J. Am. Coll. Cardiol. 2012;60:705–715. doi: 10.1016/j.jacc.2012.02.068. - DOI - PubMed
    1. Hinken A.C., Solaro R.J. A dominant role of cardiac molecular motors in the intrinsic regulation of ventricular ejection and relaxation. Physiology. 2007;22:73–80. doi: 10.1152/physiol.00043.2006. - DOI - PubMed

MeSH terms