. 2024 May 2;31(5):657-675.e8.
doi: 10.1016/j.stem.2024.03.017. Epub 2024 Apr 19.

Generation of human alveolar epithelial type I cells from pluripotent stem cells

Affiliations

Generation of human alveolar epithelial type I cells from pluripotent stem cells

Claire L Burgess et al. Cell Stem Cell. .

Abstract

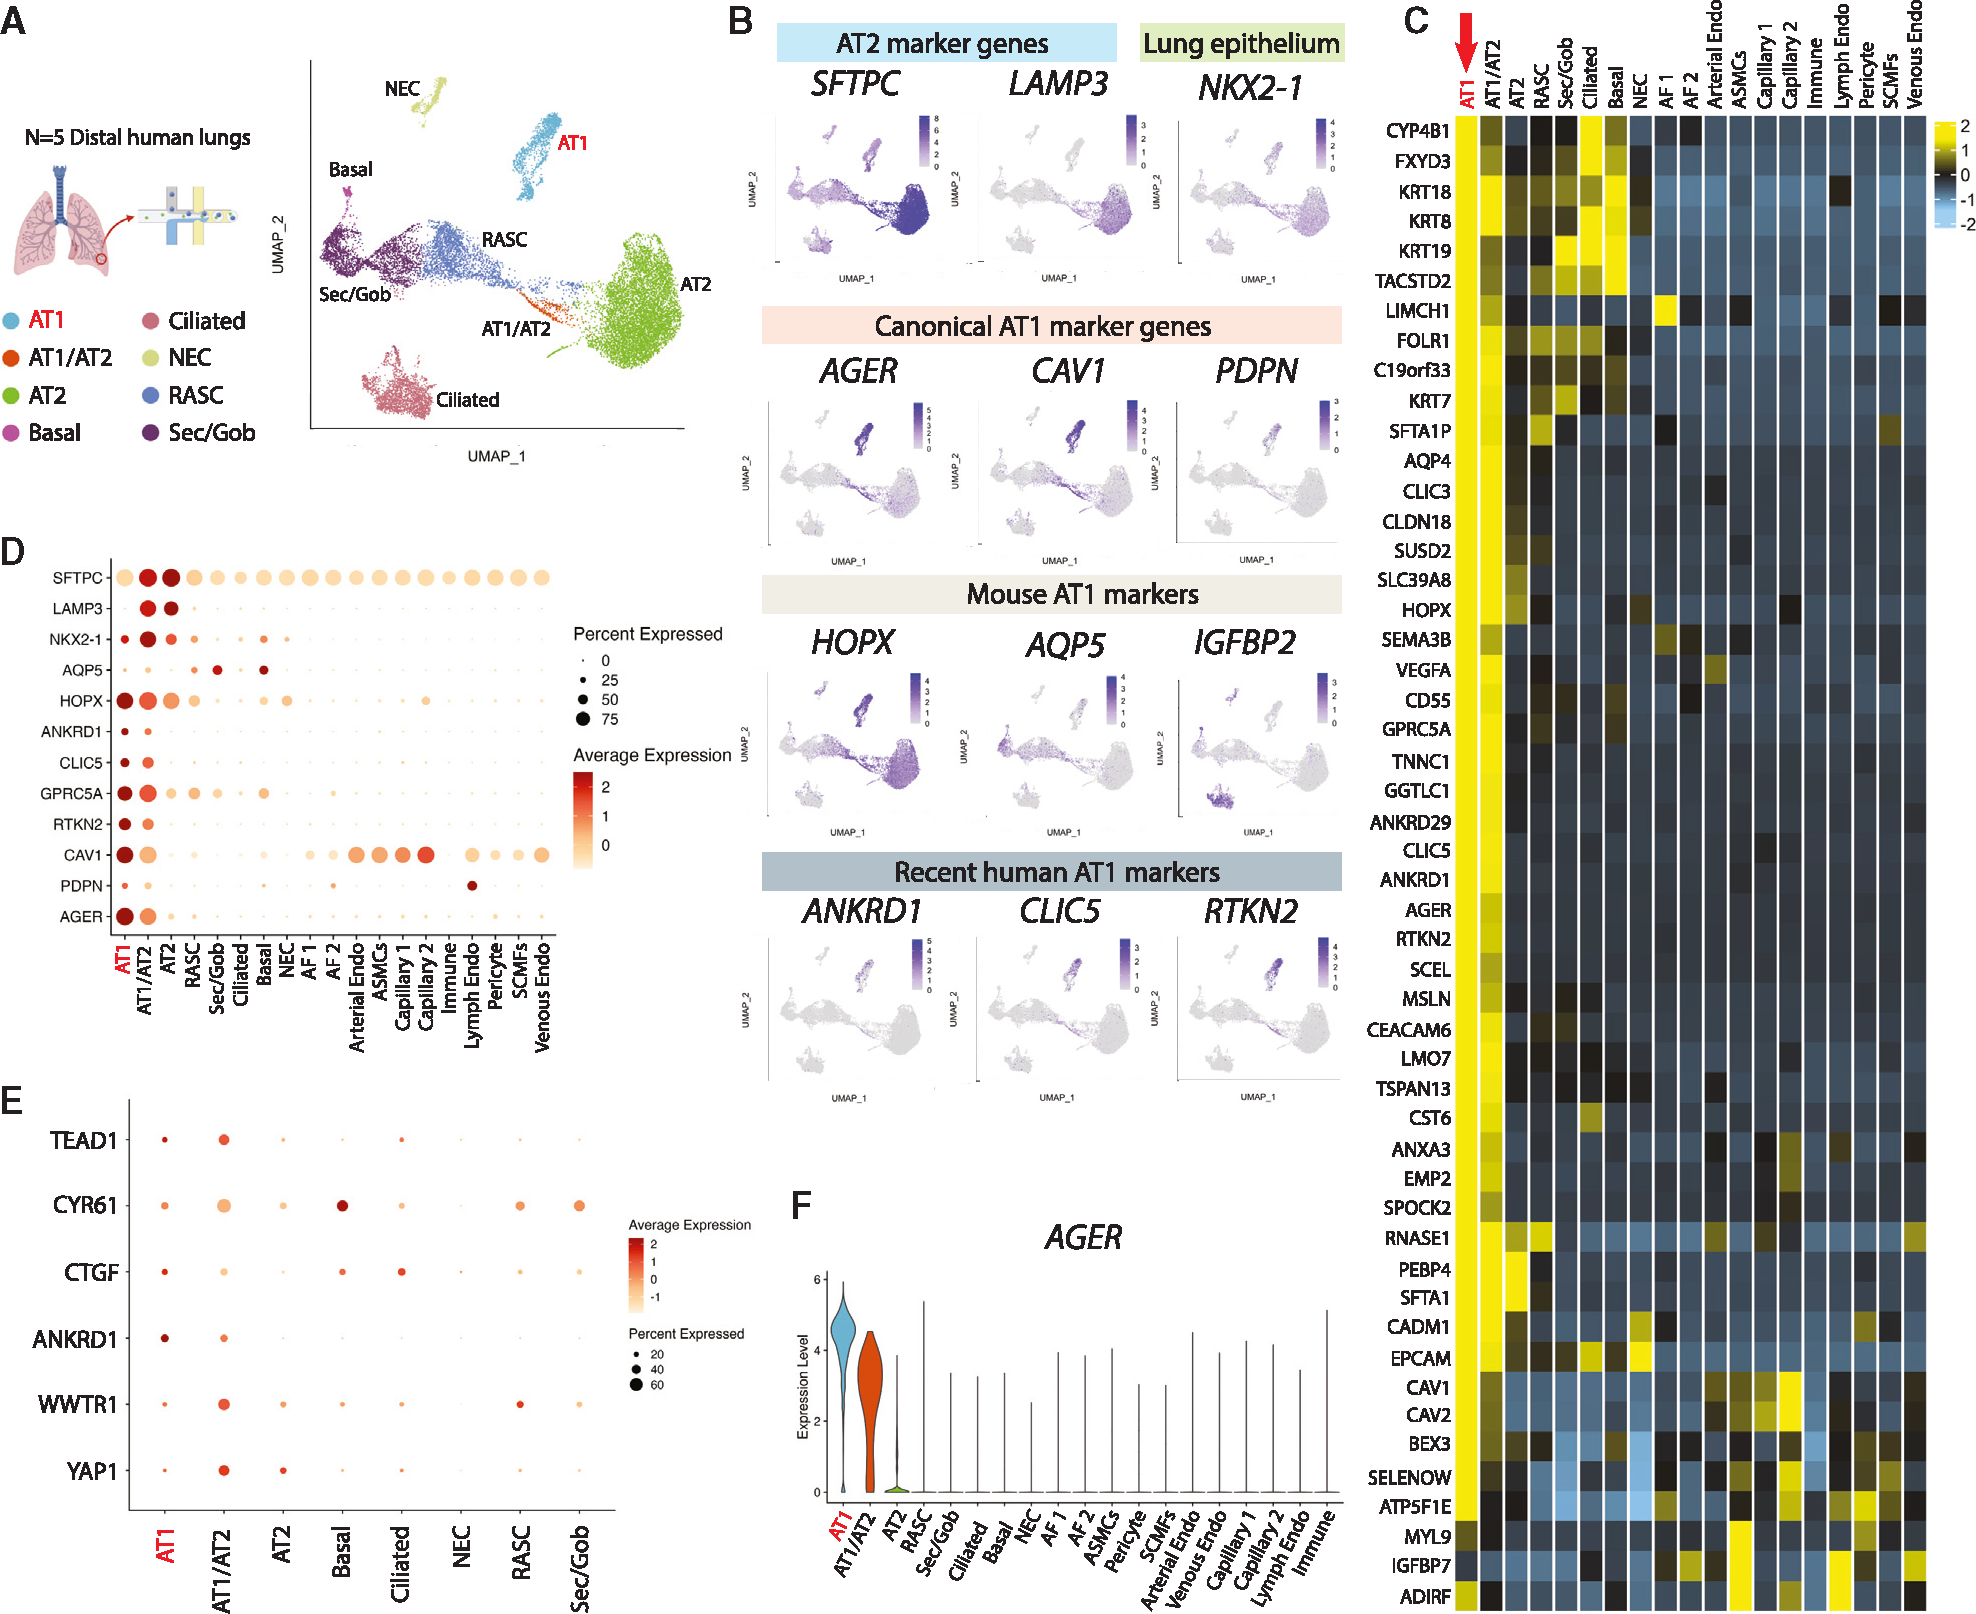
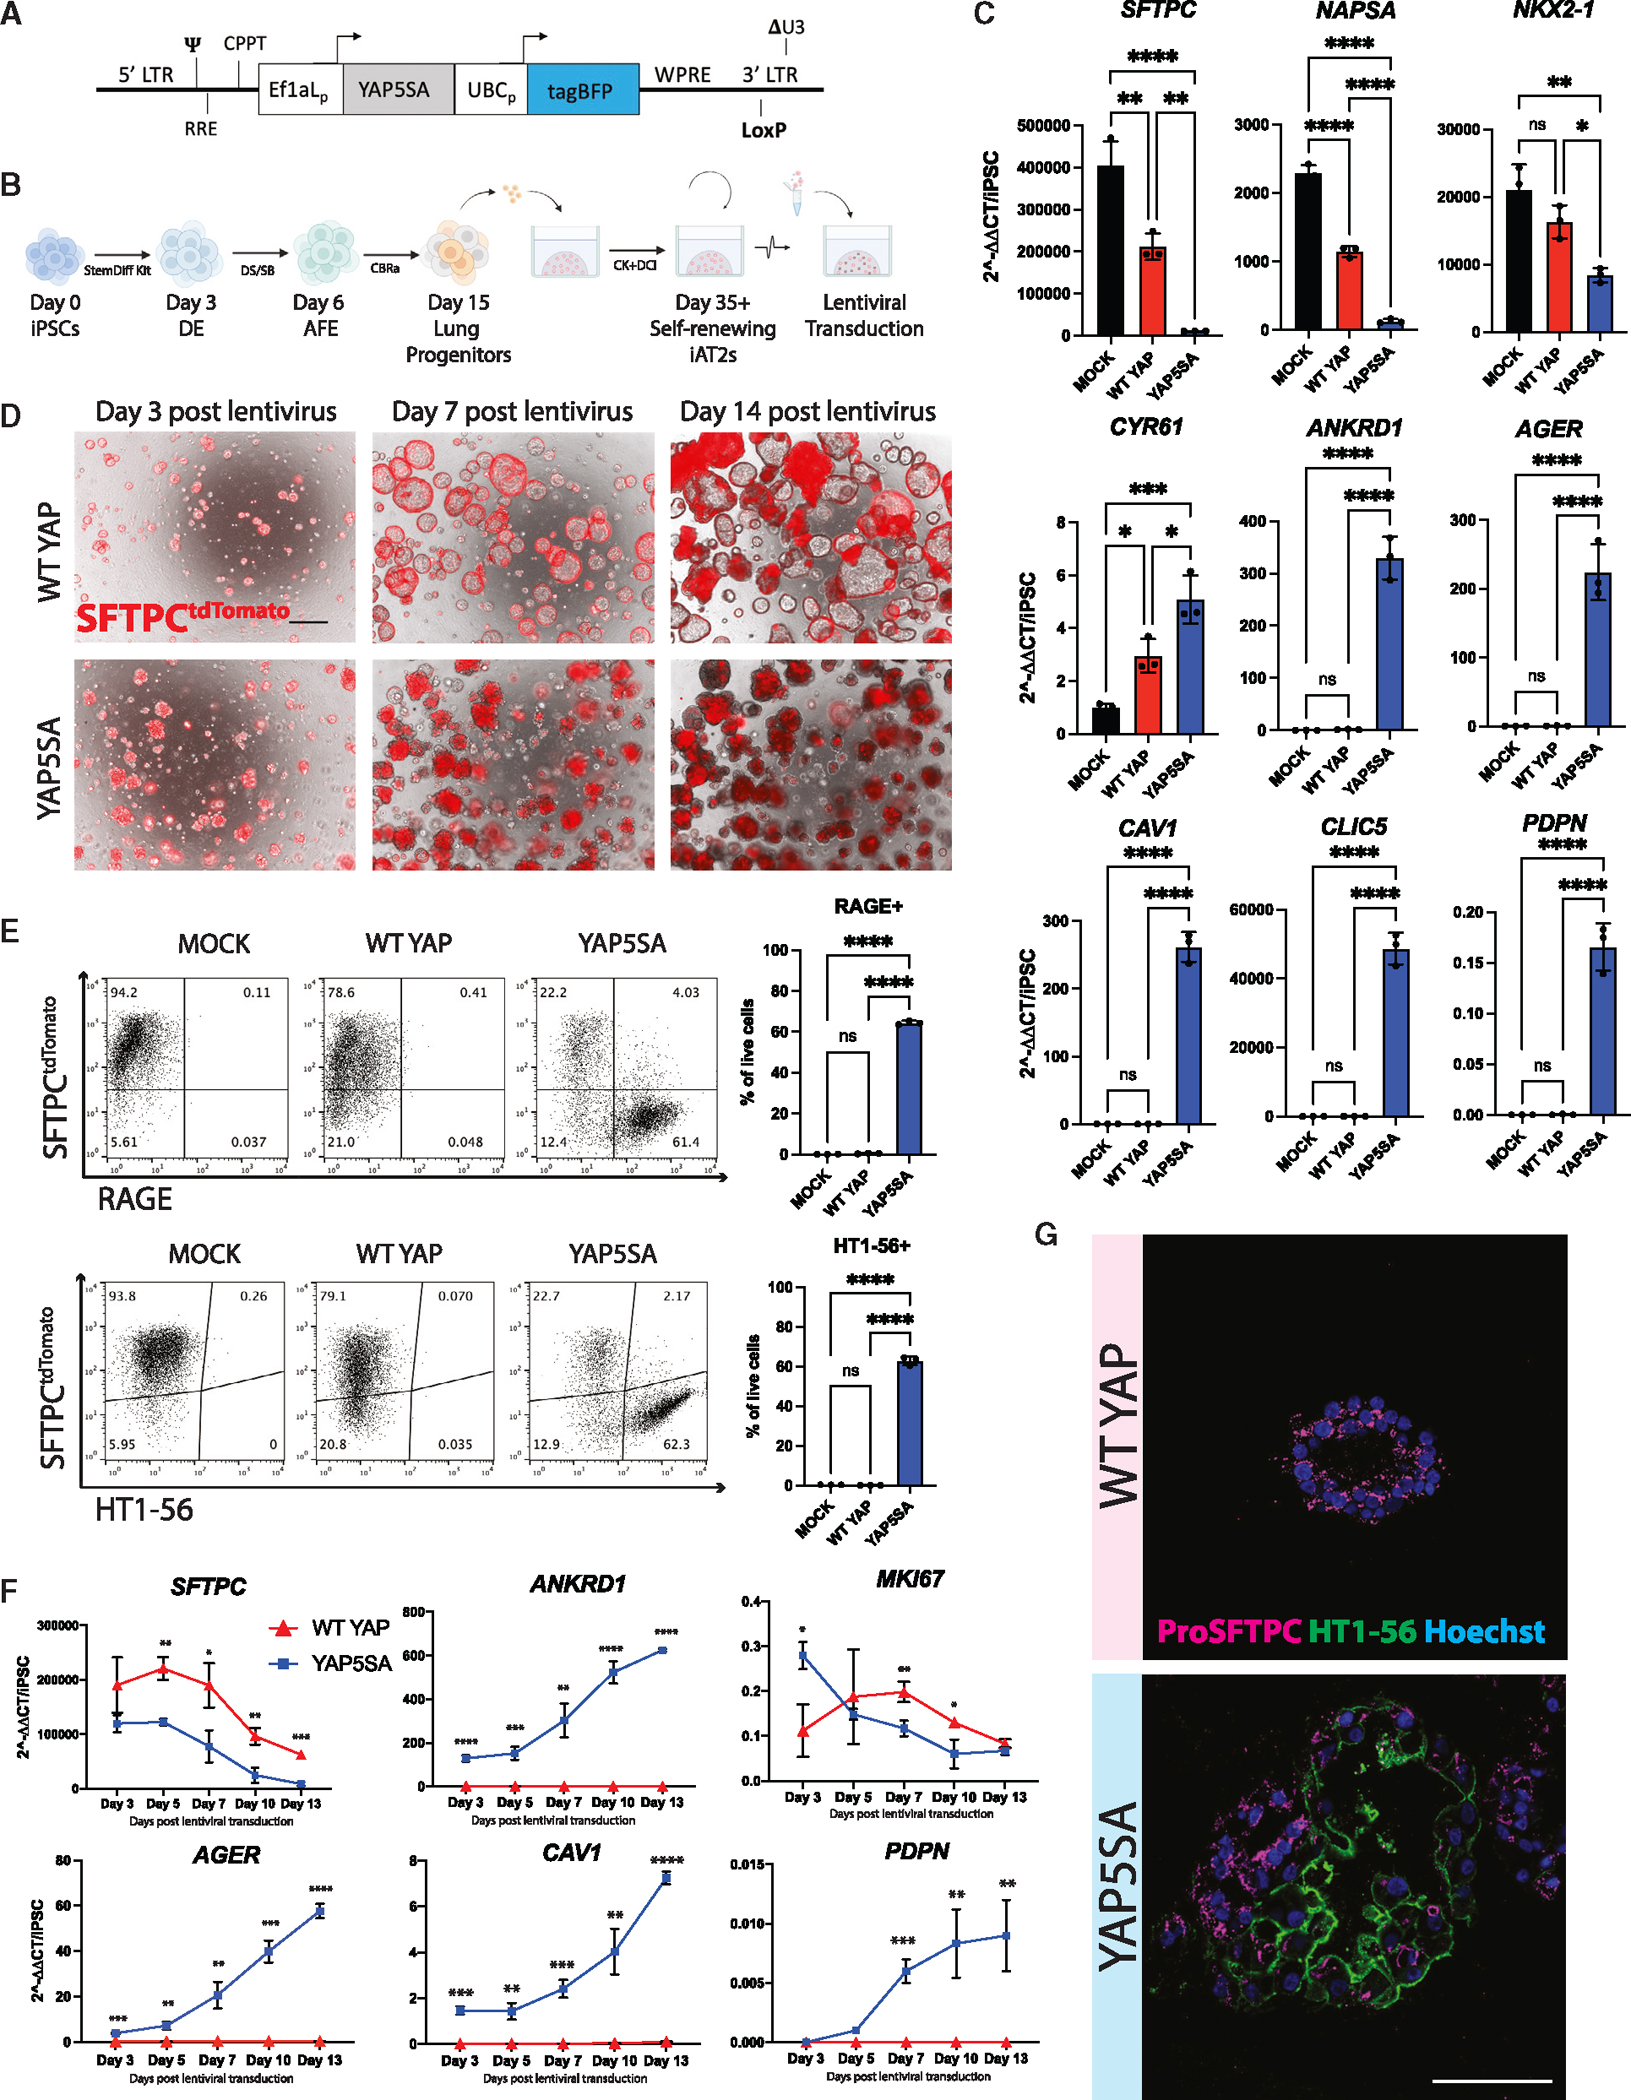
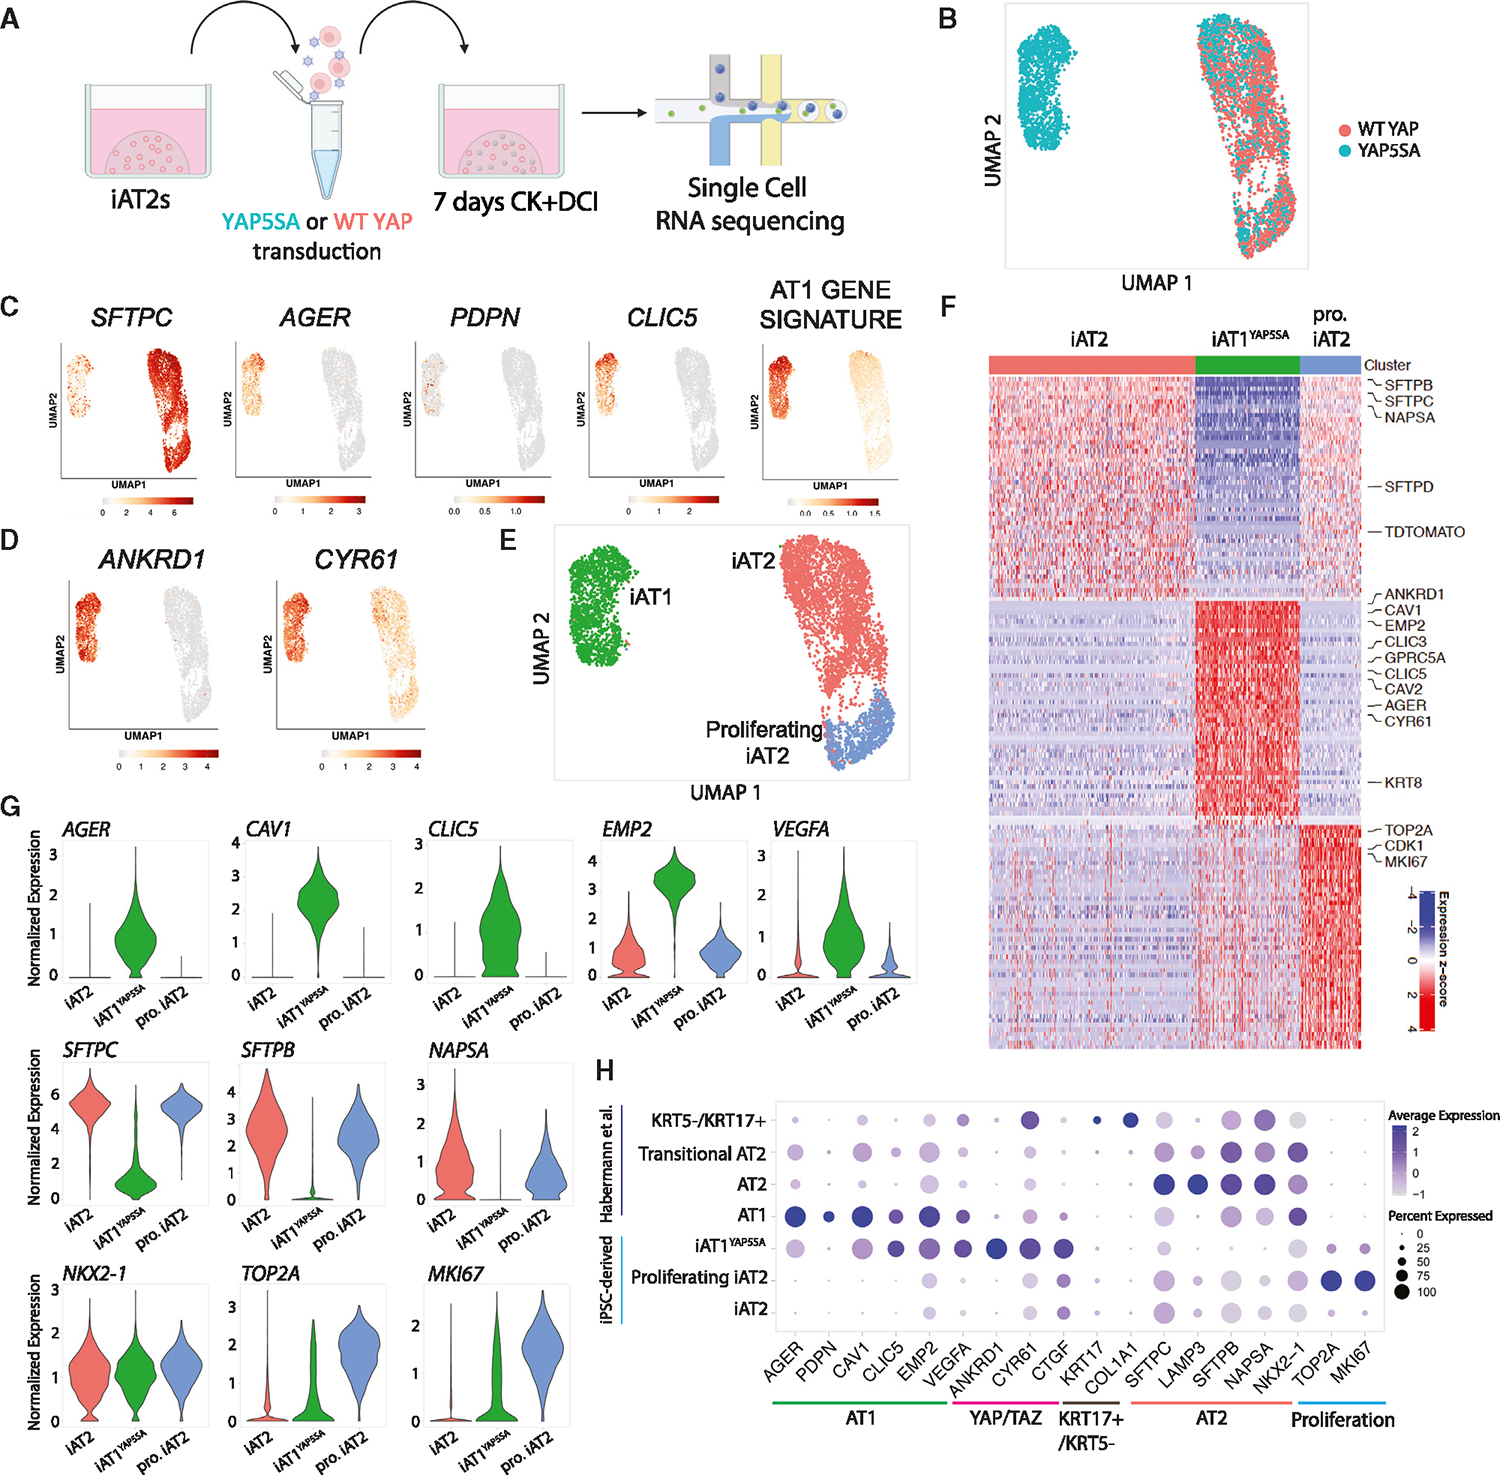
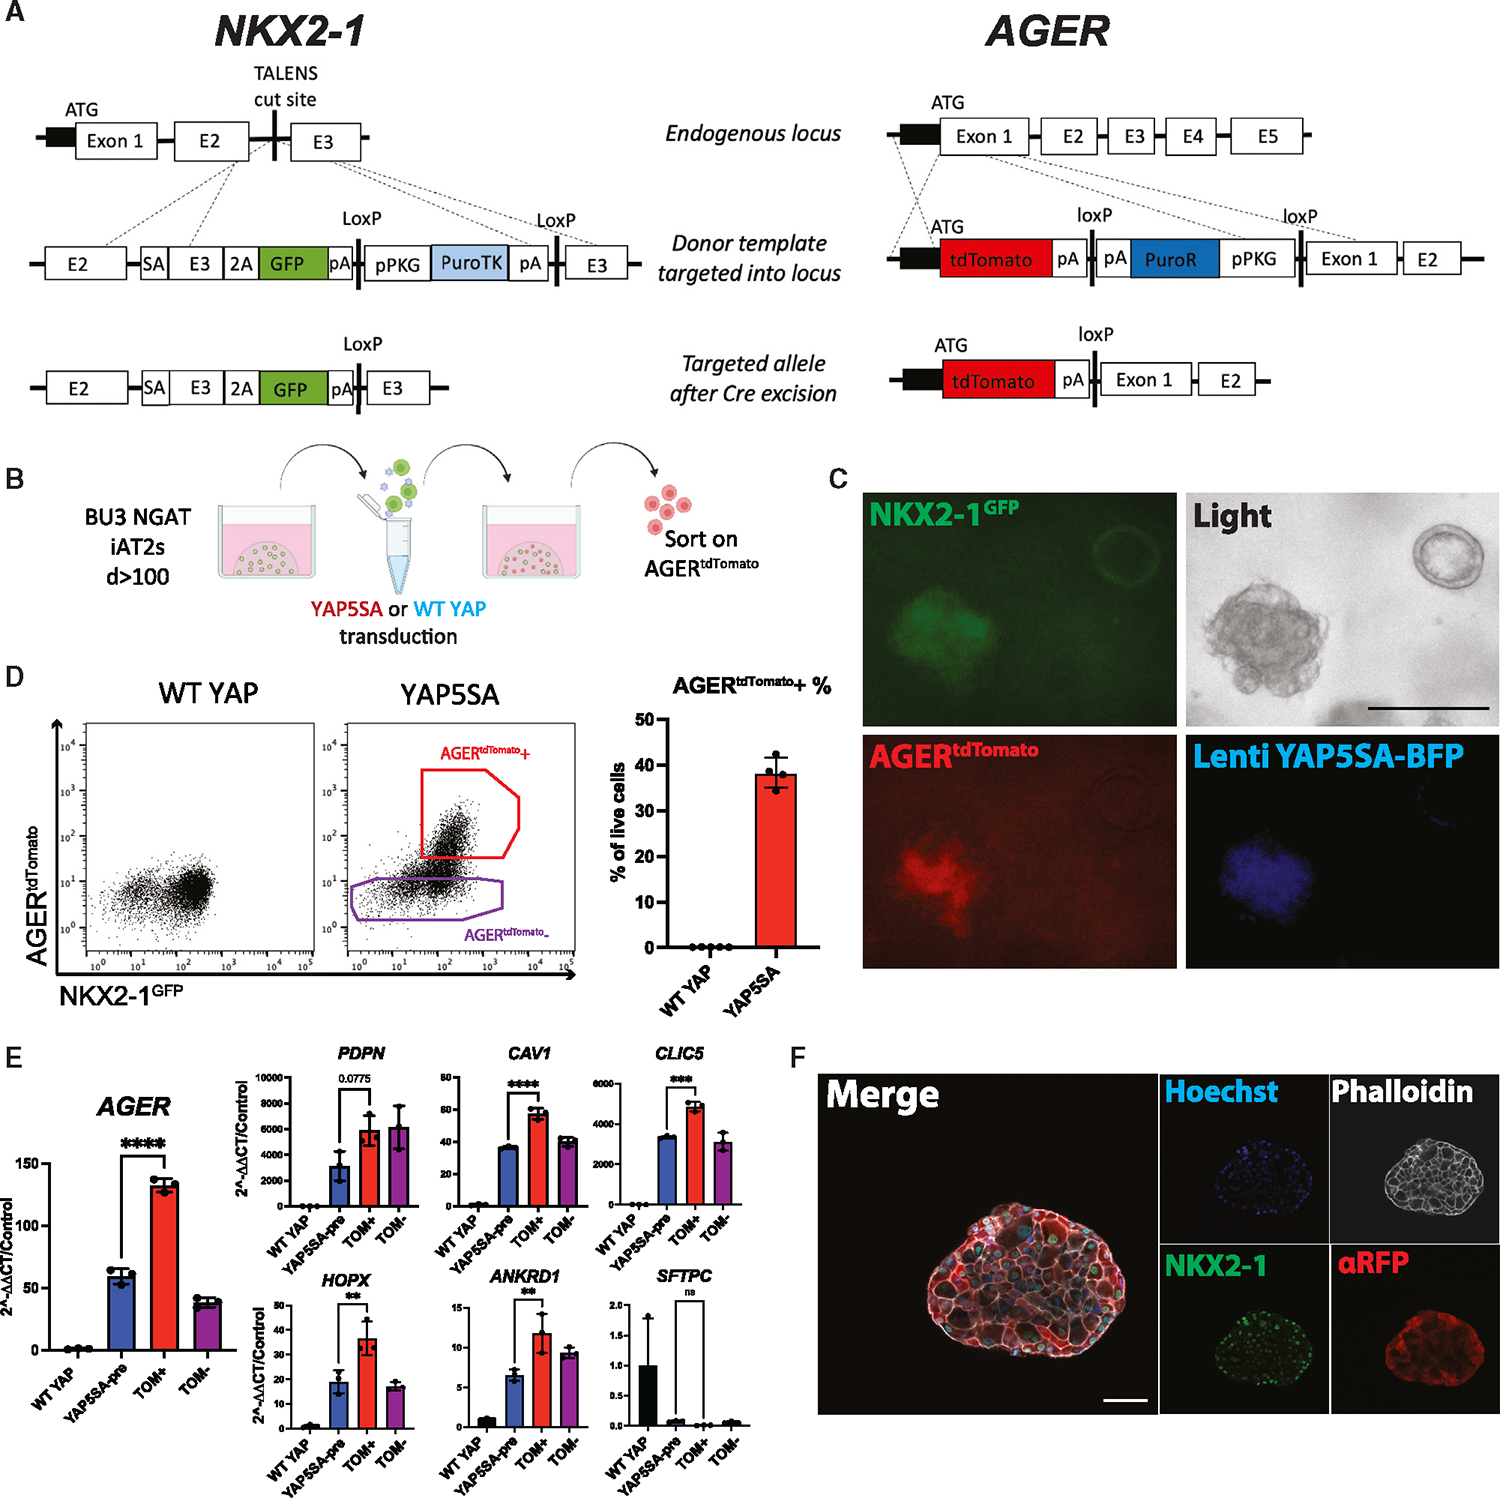
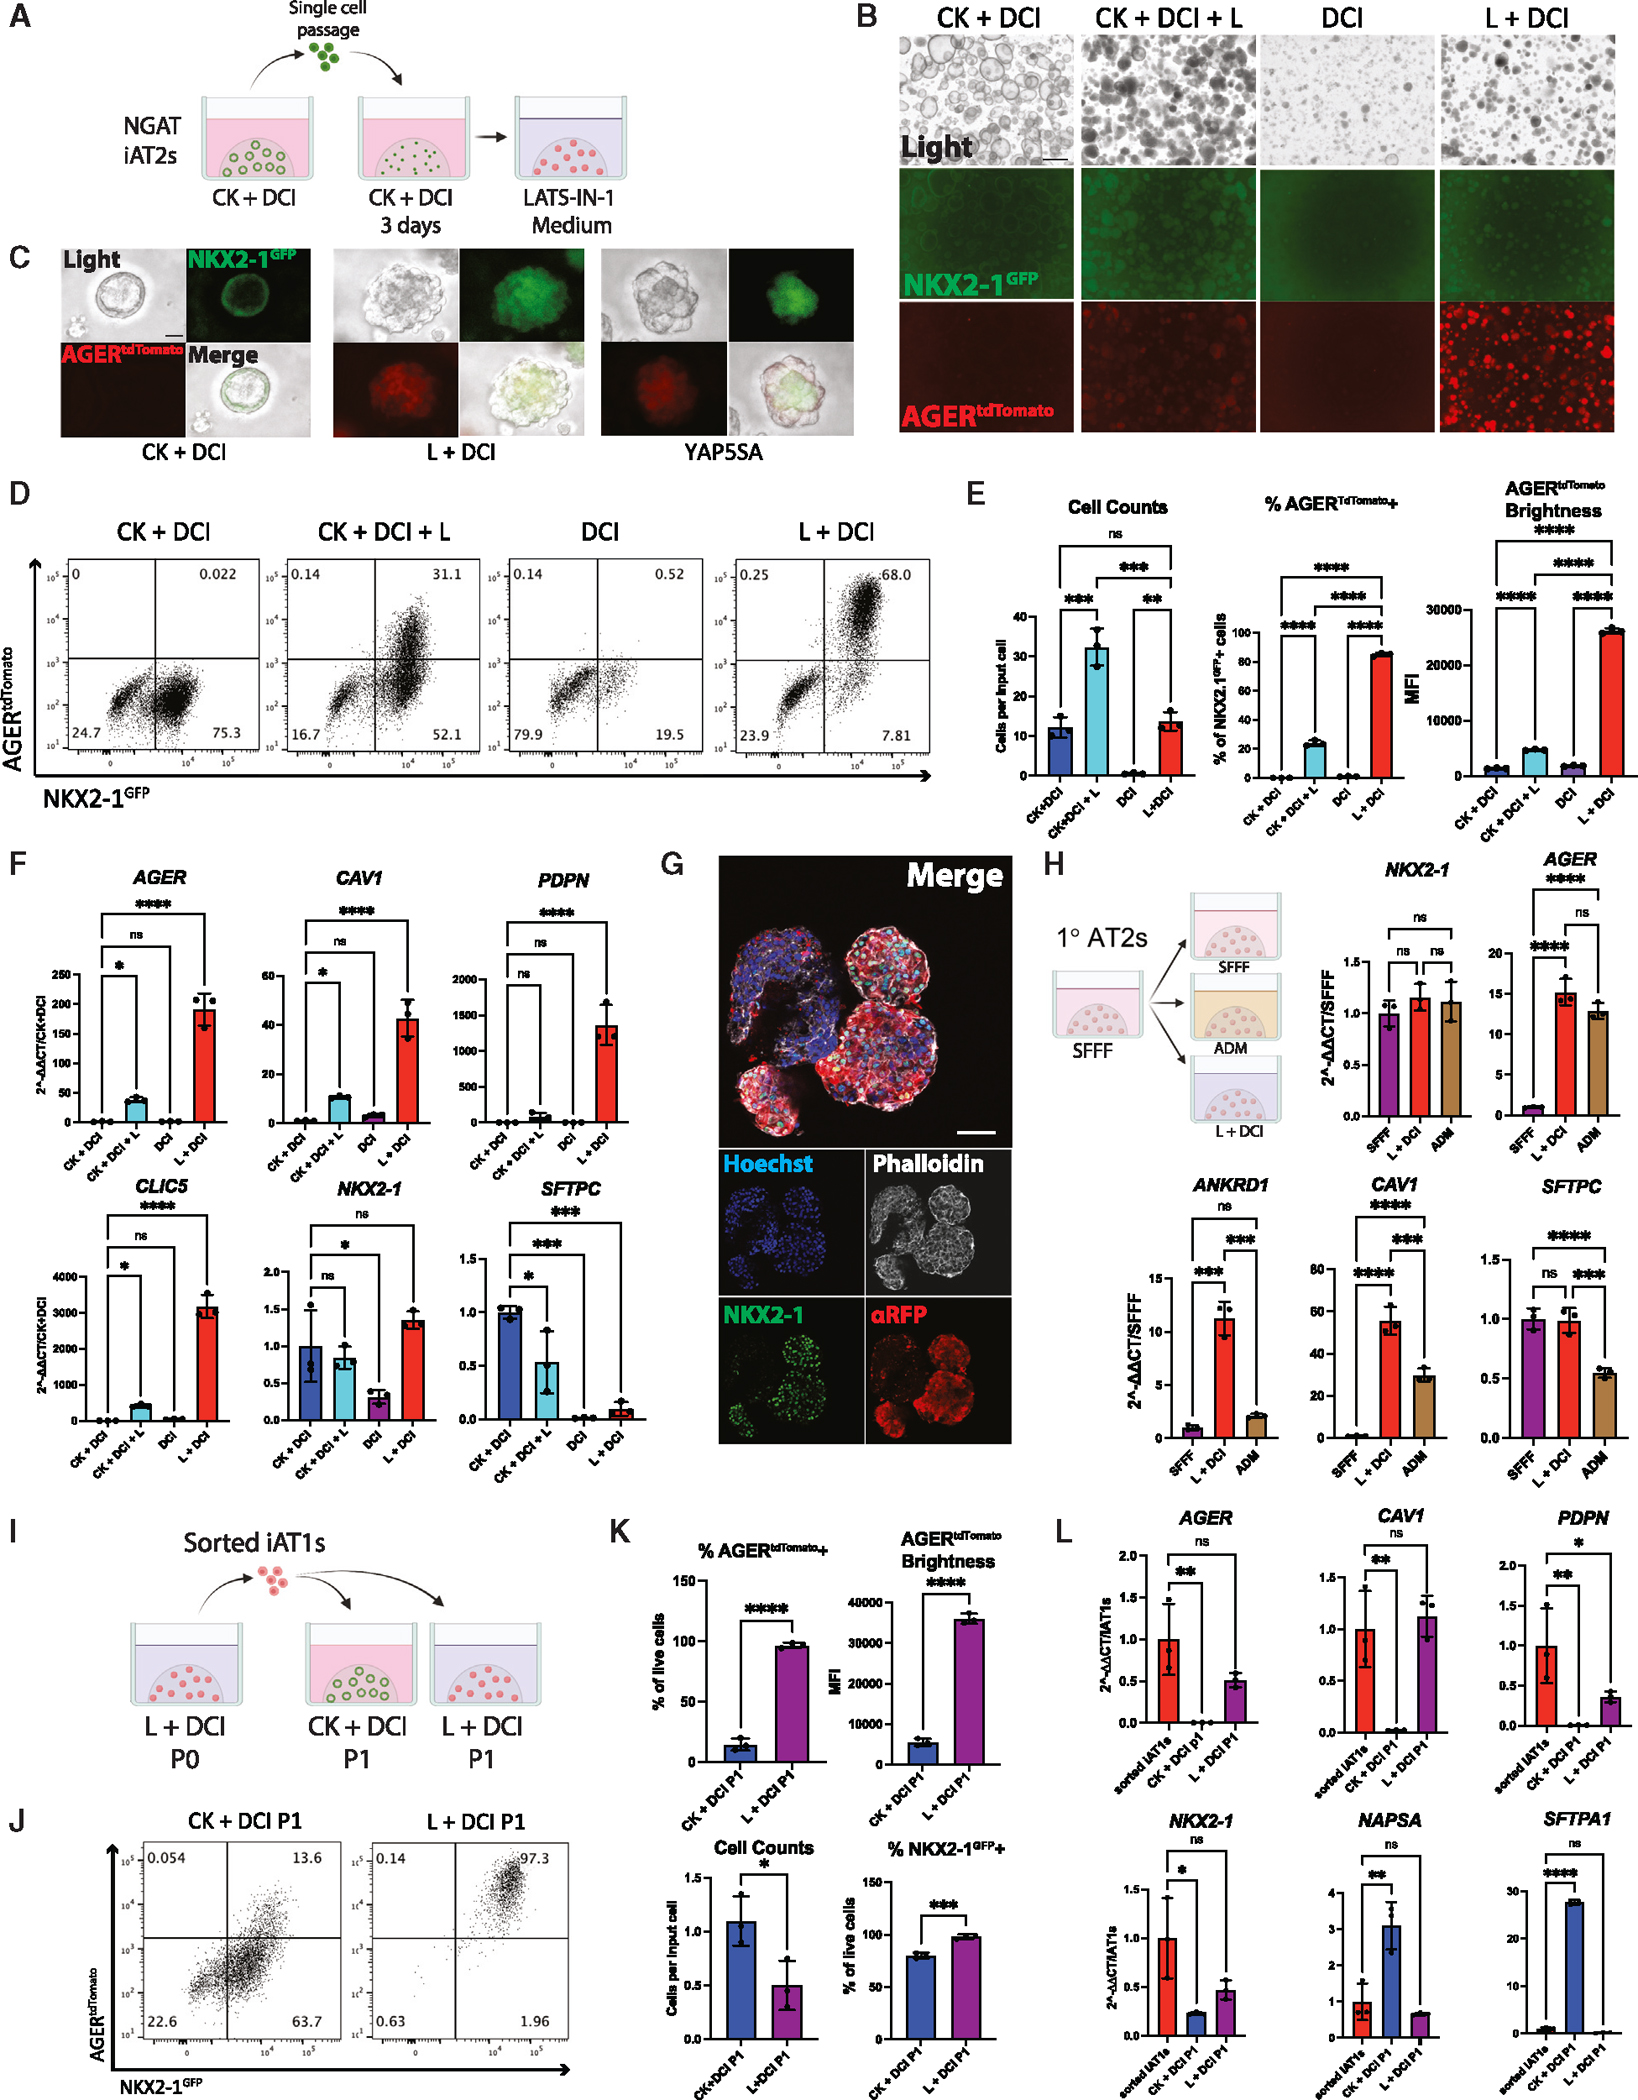
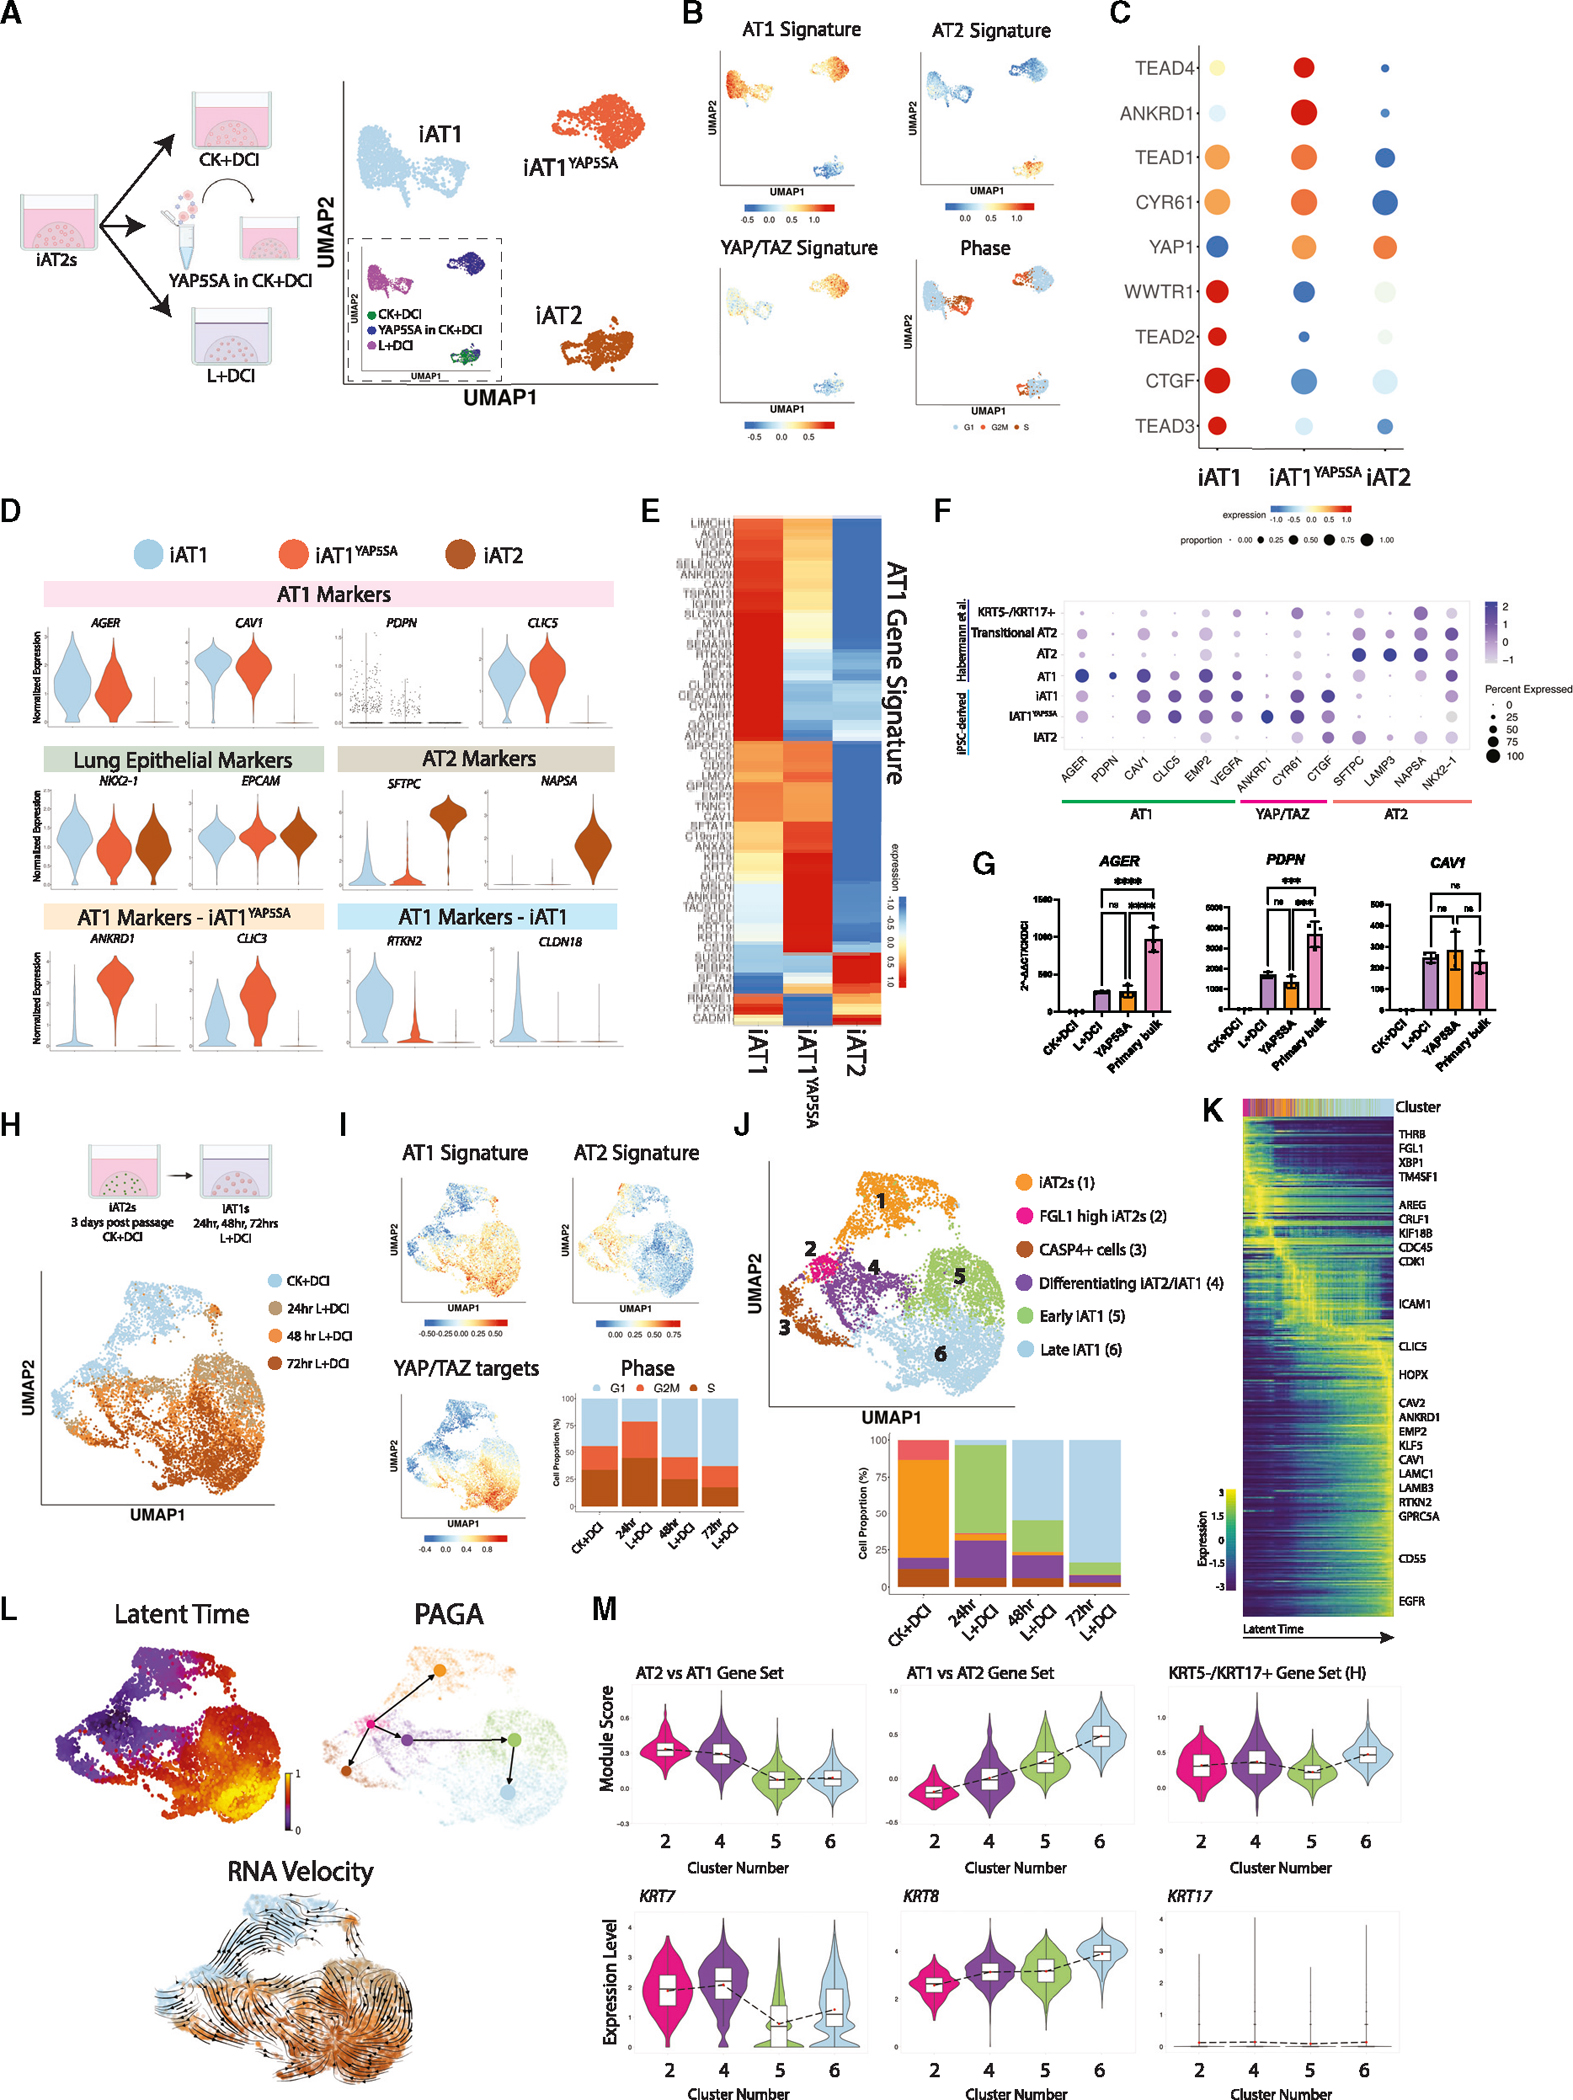
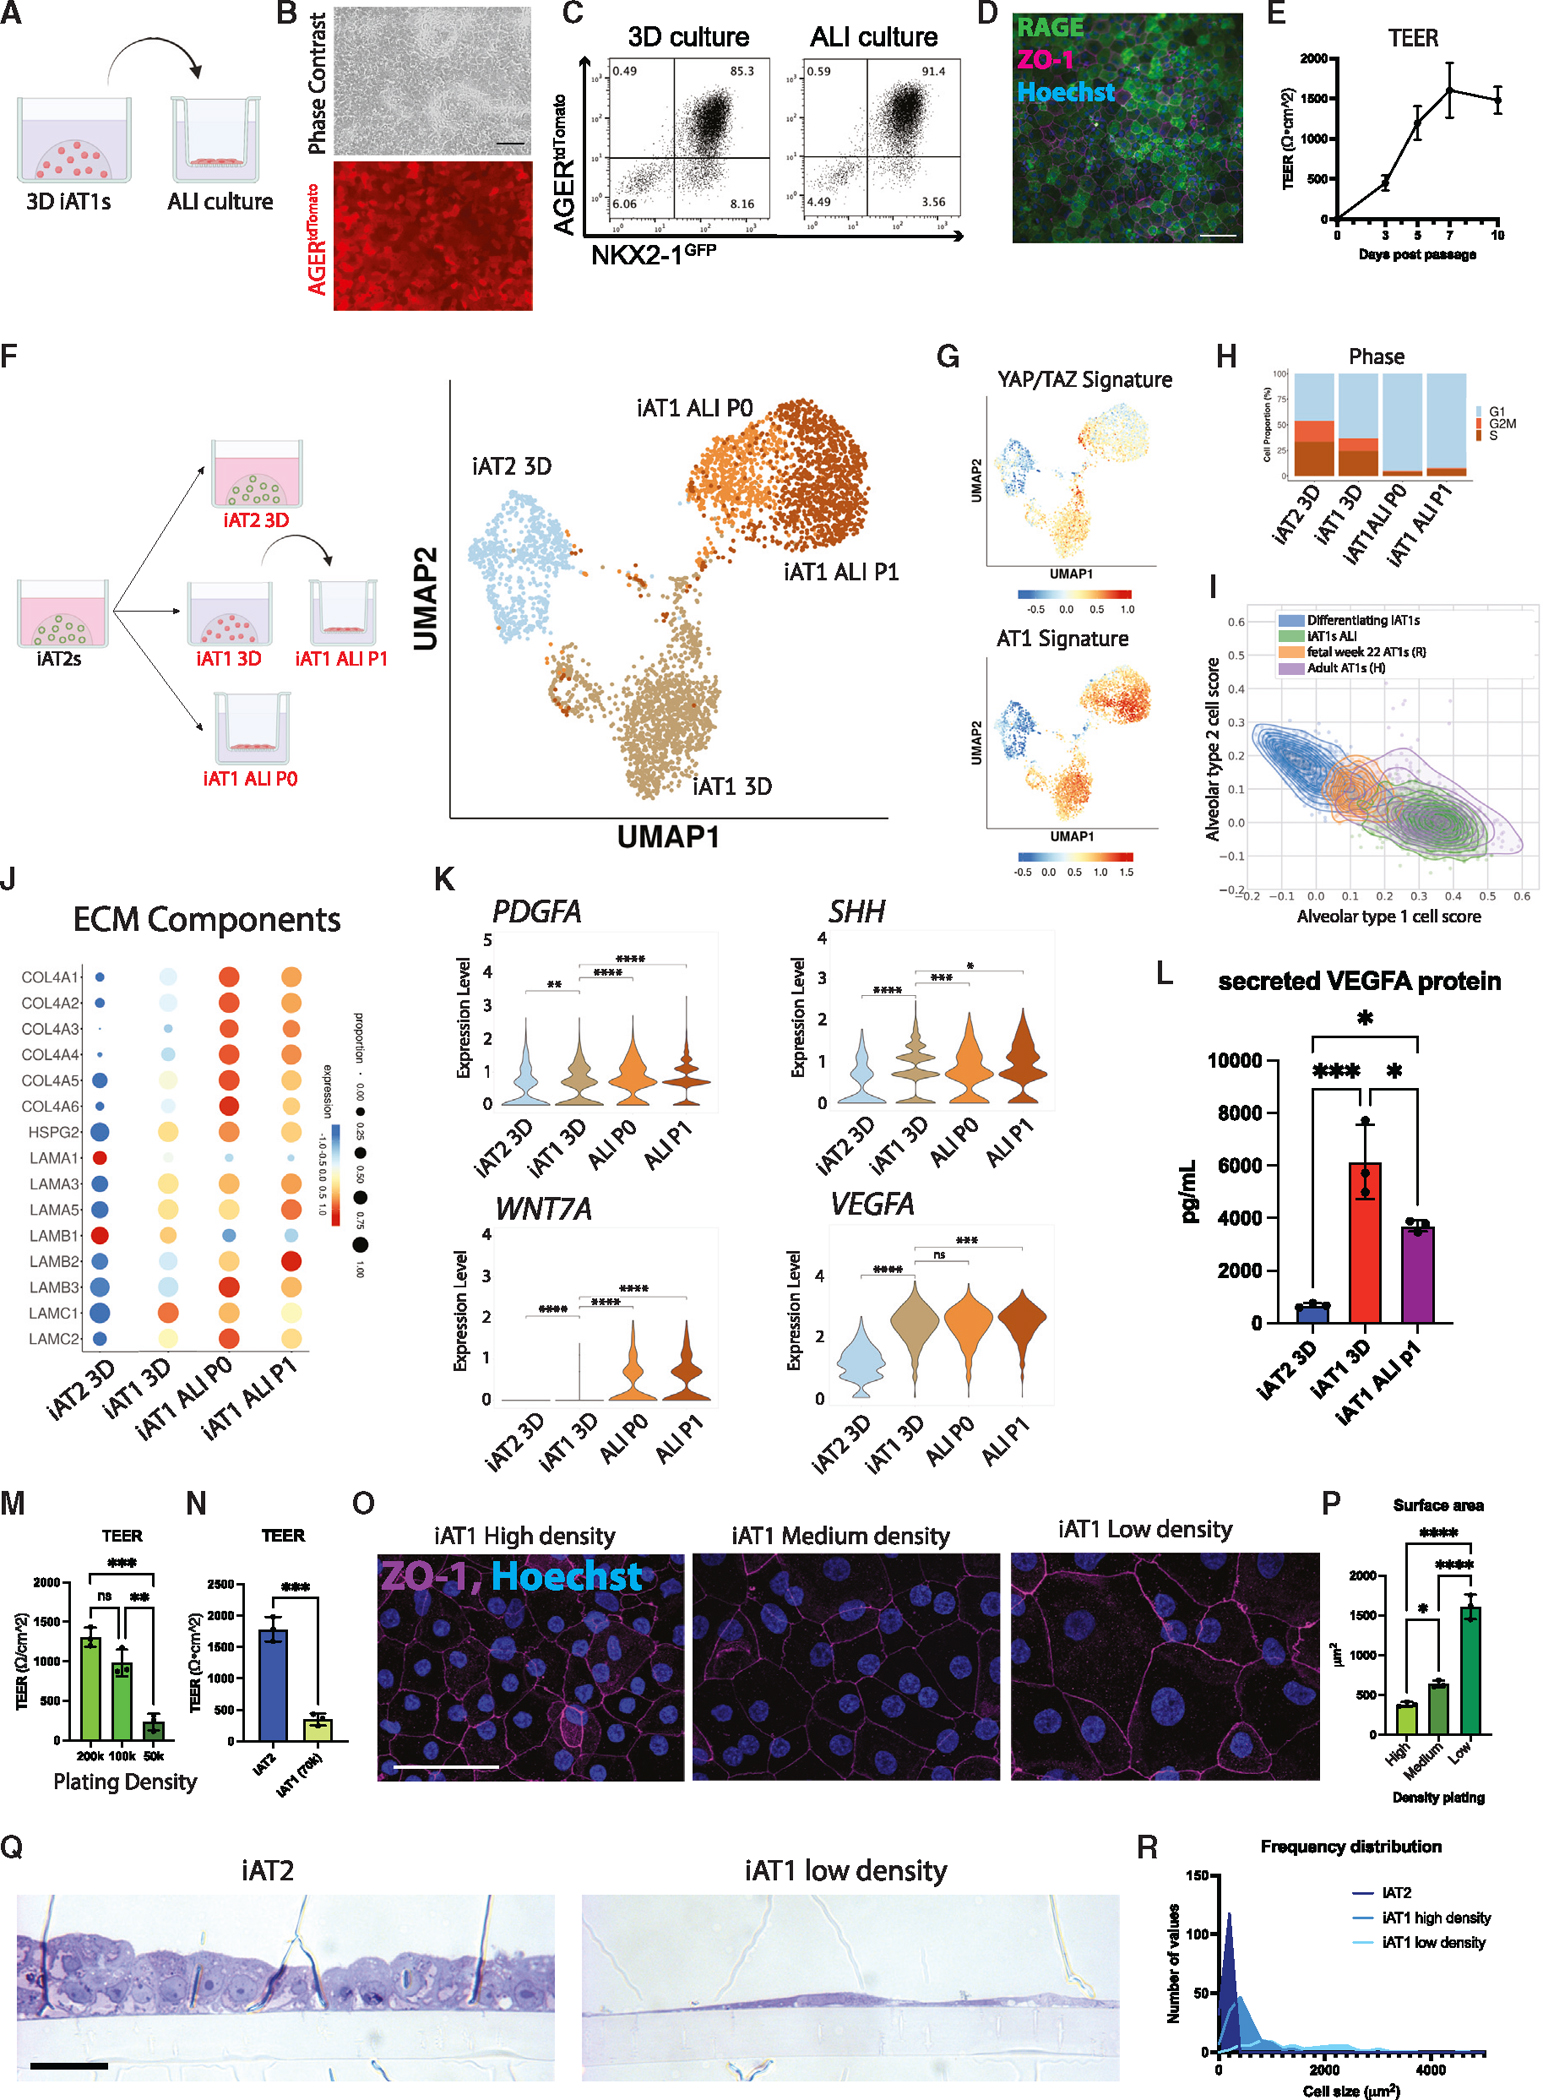
Alveolar epithelial type I cells (AT1s) line the gas exchange barrier of the distal lung and have been historically challenging to isolate or maintain in cell culture. Here, we engineer a human in vitro AT1 model system via directed differentiation of induced pluripotent stem cells (iPSCs). We use primary adult AT1 global transcriptomes to suggest benchmarks and pathways, such as Hippo-LATS-YAP/TAZ signaling, enriched in these cells. Next, we generate iPSC-derived alveolar epithelial type II cells (AT2s) and find that nuclear YAP signaling is sufficient to promote a broad transcriptomic shift from AT2 to AT1 gene programs. The resulting cells express a molecular, morphologic, and functional phenotype reminiscent of human AT1 cells, including the capacity to form a flat epithelial barrier producing characteristic extracellular matrix molecules and secreted ligands. Our results provide an in vitro model of human alveolar epithelial differentiation and a potential source of human AT1s.

Keywords: Hippo signaling; LATS inhibition; alveolar epithelial type I cells; directed differentiation; lung; lung epithelial reporter; pluripotent stem cells.


Conflict of interest statement

Declaration of interests The authors have filed a patent application related to the generation of human alveolar epithelial type I cells from pluripotent stem cells detailed in this manuscript.

Figures

Figure 1.
Figure 1.. Transcriptomic profiling at single-cell resolution of primary adult human AT1s.
(A) UMAP of an integrated analysis of 15,769 primary distal lung epithelial cells (from Basil et al., N = 5, including 1,401 AT1s and 7,039 AT2s). (B) Expression of indicated AT2 marker genes; lung epithelial marker NKX2–1; canonical AT1 marker genes; mouse-specific AT1 marker genes; and more recent human AT1 marker genes. (C) Heatmap showing average expression for each cell type of top differentially upregulated human AT1 genes compared with all distal lung cells. (D and E) (D) Expression of selected AT1 and AT2 marker genes and (E) Hippo signaling-related genes across all lung cell types. (F) AGER expression across indicated cell types. See also Figure S1 and Table S1.
Figure 2.
Figure 2.. iAT2s upregulate AT1 marker genes in response to activated nuclear YAP.
(A) Lentiviral vector encoding dual promoters driving activated nuclear YAP (YAP5SA) and a tagBFP reporter. (B) Directed differentiation protocol for producing and lentivirally transducing iAT2s (clone SPC2-ST-B2) as previously published. (“StemDiff,” definitive endoderm kit; “DE,” definitive endoderm; “AFE,” anterior foregut endoderm; “DS/SB,” dorsomorphin and SB431542; CBRa, Chir, BMP4, retinoic acid; CK+DCI, iAT2 medium as detailed in the STAR Methods). (C) Expression of indicated genes by RT-qPCR relative to day 0 iPSCs in whole-well RNA extracts taken 14 days post YAP5SA, WT YAP, or Mock lentiviral transduction (N = 3 transductions, one-way ANOVA). (D) Representative live cell imaging of iAT2s following transduction with either WT YAP or YAP5SA lentivirus (bright field/SFTPCtdTomato overlay, scale bars, 500 μm). (E) Flow cytometry analysis of SFTPCtdTomato and either RAGE protein or AT1 marker HT1–56 (N = 3 wells per condition, Student’s t test). (F) Gene expression by RT-qPCR over time following WT YAP vs. YAP5SA transduction of iAT2s, relative to day 0 iPSCs (N = 3 transductions). (G) Immunofluorescence staining for ProSFTPC (magenta) and HT1–56 (green) (nuclei, blue; scale bars, 100 μm). *p < 0.05, **p < 0.01, ***p < 0.001, and ****p < 0.001, bars represent mean ± SD for all panels. iPSC clone = SPC2-ST-B2. See also Figure S2.
Figure 3.
Figure 3.. Nuclear YAP overexpression drives AT1 program in a cell-autonomous manner.
(A) scRNA-seq of iAT2s 7 days post WT YAP or YAP5SA lentiviral transduction (SPC2-ST-B2 clone). (B) UMAP of WT YAP- and YAP5SA-exposed samples. (C and D) (C) Gene expression of: select AT2 and AT1 markers and 50-gene AT1 signature (Figure 1; Table S1), and (D) select YAP downstream targets. (E) Louvain clustering (res 0.05). (F) Top 50 DEGs for clusters shown in (E). (G) Gene expression of specific AT2, AT1, and proliferation markers across the clusters shown in (E) (“pro. iAT2,” proliferating iAT2s). (H) Dot plot showing expression levels and frequencies of the indicated genes in iPSC-derived cells and scRNA-seq profiles of human adult primary populations previously published by Habermann et al. See also Figure S2 and Table S2.
Figure 4.
Figure 4.. NKX2–1GFP;AGERtdTomato reporter iPSC line enables tracking and purification of iAT1YAP5SA cells.
(A) Gene editing strategy to generate BU3 NKX2–1GFP;AGERtdTomato (NGAT) dual reporter iPSC line for tracking lung epithelial lineages and AT1-like cells (BU3 NKX2–1GFP reporter previously published by Hawkins et al.). (B) AGERtdTomato+ cells sorted and analyzed 14 days after transduction of iAT2s with lentiviral WT YAP or YAP5SA. (C) Live cell fluorescence microscopy of YAP5SA-transduced cells growing next to an un-transduced epithelial sphere (GFP, tdTomato, and TagBFP fluorescence; scale bar, 200 μm). (D) Flow cytometry of iAT2s (showing sorting gate for AGERtdTomato + and − cells with AGERtdTomato+ percentage quantified. (E) Gene expression in sorted cells from (D). WT YAP, unsorted WT YAP transduced cells; YAP5SA-pre, unsorted YAP5SA transduced cells; TOM+,AGERtdTomato+ sorted cells; TOM−, AGERtdTomato−-sorted cells (N = 3 transductions, one-way ANOVA). (F) Immunofluorescence staining of NKX2–1 protein and tdTomato (αRFP) (NKX2–1: green, F-actin: phalloidin white, tdTomato: red, nuclei: blue. Scale bars, 50 μm). *p < 0.05, **p < 0.01, ***p < 0.001, and ****p < 0.001, bars represent mean ± SD, BU3 NGAT iPSC line for all panels. See also Figure S3.
Figure 5.
Figure 5.. Serum-free medium-based induction of AGERtdTomato.
(A) iAT2s were passaged as usual into CK+DCI medium for 3 days. Medium was then kept the same or switched to LATS inhibitor-based media, CK+DCI+L, DCI, or L+DCI (C, Chir; K, rhKGF; L, LATS-IN-1; DCI as defined in Figure 2). (B and C) (B) Live fluorescence microscopy of iAT2s at 12 days post passage, either without (B) or with (C) YAP5SA transduction comparison (scale bars, 500 μm in B; 50 μm in C). (D) Representative flow cytometry of NKX2–1GFP and AGERtdTomato 9 days after changing to each indicated medium. (E) Cell counts and quantification of AGERtdTomato+ percentage and MFI 9 days post medium change (N = 3 wells per condition, one-way ANOVA). (F) Gene expression of AT1 and AT2 markers by whole-well RT-qPCR (N = 3 wells per condition, one-way ANOVA). (G) Whole-mount immunofluorescence microscopy of organoids in L+DCI. (NKX2–1: green, F-actin: phalloidin white, tdTomato: red, nuclei: blue. scalebars, 50 μm). (H) Primary adult human AT2 cells (1AT2s) were cultured as described in SFFF or ADM compared with L+DCI (medium changed 7 days post plating). Whole-well RT-qPCR of selected genes 7 days post medium change (N = 3 per condition, one-way ANOVA). (I) Experimental schematic: iAT1s were grown in L+DCI for 10 days (P0), sorted on AGERtdTomato, and then plated in 3D Matrigel in either L+DCI or CK+DCI. Outgrowths were analyzed after an additional 9 days (P1). (J) Representative flow cytometry plots P1 from (I). (K) Quantification of (J): cell counts or transcript expression. (L) Whole-well RT-qPCR of cells from (I). Control-sorted iAT1s are freshly sorted AGERtdTomato+ from P0 (N = 3 wells per condition; K, Student’s t test; L, one-way ANOVA). *p < 0.05, **p < 0.01, ***p < 0.001, and ****p < 0.001, bars represent mean ± SD. BU3 NGAT iPSC line for all panels. See also Figures S4 and S5.
Figure 6.
Figure 6.. iAT1s generated by defined medium or lentiviral YAP5SA express a broad AT1 transcriptomic program.
(A) SPC2-ST-B2 iAT2s were grown in CK+DCI either with or without YAP5SA transduction, or grown in CK+DCI for 3 days before switching to L+DCI. 9 days post passage live cells were profiled by scRNA-seq. UMAP visualization of single-cell transcriptomes by original sample name (inset) or after Louvain clustering (res 0.05). Clusters were named iAT2, iAT1YAP5SA, and iAT1. (B) Gene expression overlays of our AT1 50-gene signature, a 22-gene YAP/TAZ signature, human AT2 50-gene signature, or cell cycle phase. (C) Dot plot of transcript expression levels/frequencies of YAP/TAZ downstream targets and TEADs. (D) Violin plots quantifying expression of indicated markers. (E) Heatmap showing average expression (normalized by column) of genes in the AT1 50-gene set. (F) Dot plot showing expression levels and frequencies of AT1, AT2, and YAP/TAZ targets in this dataset compared with human adult primary populations previously published by Habermann et al. (G) Expression of AT1 marker genes by RT-qPCR in whole-well extracts of L+DCI-induced and YAP5SA-transduced iAT1s compared with bulk primary human distal lung tissue; fold change normalized to 18S (2^−DDCT) is calculated relative to iAT2s in CK+DCI (N = 3 wells per condition, one-way ANOVA). (H) UMAP visualization of single-cell transcriptomes at 24 h intervals over 4 days of iAT2 (CK+DCI) to iAT1 (L+DCI) differentiation in 3D (BU3 NGAT). (I) Gene expression overlays of human AT1 and AT2 50-gene signatures, 22-gene YAP/TAZ target signature, and cell cycle phase. (J) UMAP visualization of Louvain clustering. (K) Heatmap of top 300 driver genes for RNA velocity path. (L) Pseudotime analysis visualized on UMAP (latent time, partition-based graph abstraction [PAGA], and RNA velocity). M) Violin plots showing module scores of gene sets or expression of individual genes (H = gene set from Habermann et al.) *p < 0.05, **p < 0.01, ***p < 0.001, and ****p < 0.001, bars represent mean ± SD for all panels. See also Figure S6.
Figure 7.
Figure 7.. iAT1s cultured at air-liquid interface (ALI) express AT1-like molecular and functional phenotypes.
(A) Experimental schematic: iAT1s were cultured in 3D in L+DCI for 8–11 days before passaging and replating onto transwell inserts in L+DCI. Upper chamber media was aspirated after 3 days (airlift) to form ALI. (B) Live cell imaging showing retention of AGERtdTomato after ALI culture (scale bar, 100 μm). (C) Representative flow cytometry of NKX2–1GFP and AGERtdTomato expression in 3D or ALI cultures (6 days). (D) Immunofluorescence microscopy of RAGE and ZO-1 in iAT1s at ALI (scale bar, 100 μM). (E) Transepithelial electrical resistance (TEER) measurements of BU3 NGAT iAT1s over 10 days of ALI cultures (air lifted at day 3; N = 3). (F) scRNA-seq profiling of iAT2s in 3D CK+DCI; iAT1s in 3D L+DCI; or iAT1s in ALI cultures, which were plated either from iAT2s into L+DCI (iAT1 ALI P0) or from 3DiAT1s after 9 days pre-culturing in 3D L+DCI (iAT1 ALI P1). (G) UMAP overlays of YAP/TAZ 22-gene signature and primary human AT1 50-gene signature (Table S1). (H) Cell cycle phase distribution across samples. (I) Alignment scores to primary human AT1 and AT2s using scTOP analysis comparing two iAT1 populations (differentiating iAT1/iAT2—Figure 6 and iAT1s ALI—this figure) with primary human fetal lung at 22 weeks and adult primary human AT1s. (J and K) Expression of transcripts encoding (J) ECM components and (K) secreted ligands, comparing the samples from (E) (pairwise t test). (L) Analysis of secreted VEGFA protein in conditioned media at day 10 of culture of each indicated sample (N = 3 wells per condition, one-way ANOVA). (M) TEER of iAT1s after plating at high, medium, and low densities and outgrowth in ALI cultures in L+DCI (N = 3 wells per condition, one-way ANOVA). (N) TEER of iAT2s compared with iAT1s plated at low density (SPC2-ST-B2) (N = 3 wells per condition, Student’s t test). (O) Tight junction protein ZO-1 staining (magenta) at high, medium, and low plating density outgrowths at day 10 (scale bars, 50 μm). (P) Average surface area of cells calculated using ZO-1 cell outlines at different iAT1 ALI plating densities (N = 3 per condition, averaged from ~150 cells per sample). (Q) Cross-sectional imaging of SPC2-ST-B2 iAT2s at ALI and iAT1 P1s plated at low densities (Toluidine blue stain, scale bars, 10 μm). (R) Frequency distribution of cell surface areas of iAT2, iAT1 high density, and iAT1 low density (N = 149, 139, and 79, respectively). *p < 0.05, **p < 0.01, ***p < 0.001, and ****p < 0.001, bars represent mean ± SD for all panels, BU3 NGAT iPSC line unless otherwise noted. See also Figure S7.

Update of

References

    1. Weibel ER (2015). On the tricks alveolar epithelial cells play to make a good lung. Am. J. Respir. Crit. Care Med. 191, 504–513. 10.1164/rccm.201409-1663OE. - DOI - PubMed
    1. Habermann AC, Gutierrez AJ, Bui LT, Yahn SL, Winters NI, Calvi CL, Peter L, Chung MI, Taylor CJ, Jetter C, et al. (2020). Single-cell RNA sequencing reveals profibrotic roles of distinct epithelial and mesenchymal lineages in pulmonary fibrosis. Sci. Adv. 6, eaba1972. 10.1126/sciadv.aba1972. - DOI - PMC - PubMed
    1. Kobayashi Y, Tata A, Konkimalla A, Katsura H, Lee RF, Ou J, Banovich NE, Kropski JA, and Tata PR (2020). Persistence of a regeneration-associated, transitional alveolar epithelial cell state in pulmonary fibrosis. Nat. Cell Biol. 22, 934–946. 10.1038/S41556-020-0542-8. - DOI - PMC - PubMed
    1. Choi J, Park JE, Tsagkogeorga G, Yanagita M, Koo BK, Han N, and Lee JH (2020). Inflammatory Signals Induce AT2 Cell-Derived Damage-Associated Transient Progenitors that Mediate Alveolar Regeneration. Cell Stem Cell 27, 366–382.e7. 10.1016/J.STEM.2020.06.020. - DOI - PMC - PubMed
    1. Evans MJ, Cabral LJ, Stephens RJ, and Freeman G (1975). Transformation of alveolar Type 2 cells to Type 1 cells following exposure to NO2. Exp. Mol. Pathol. 22, 142–150. 10.1016/0014-4800(75)90059-3. - DOI - PubMed

Publication types

MeSH terms