. 2024 Jun:237:102612.
doi: 10.1016/j.pneurobio.2024.102612. Epub 2024 Apr 19.

Persistent ∆FosB expression limits recurrent seizure activity and provides neuroprotection in the dentate gyrus of APP mice

Affiliations

Persistent ∆FosB expression limits recurrent seizure activity and provides neuroprotection in the dentate gyrus of APP mice

Gabriel S Stephens et al. Prog Neurobiol. 2024 Jun.

Abstract

Recurrent seizures lead to accumulation of the activity-dependent transcription factor ∆FosB in hippocampal dentate granule cells in both mouse models of epilepsy and mouse models of Alzheimer's disease (AD), which is also associated with increased incidence of seizures. In patients with AD and related mouse models, the degree of ∆FosB accumulation corresponds with increasing severity of cognitive deficits. We previously found that ∆FosB impairs spatial memory in mice by epigenetically regulating expression of target genes such as calbindin that are involved in synaptic plasticity. However, the suppression of calbindin in conditions of neuronal hyperexcitability has been demonstrated to provide neuroprotection to dentate granule cells, indicating that ∆FosB may act over long timescales to coordinate neuroprotective pathways. To test this hypothesis, we used viral-mediated expression of ∆JunD to interfere with ∆FosB signaling over the course of several months in transgenic mice expressing mutant human amyloid precursor protein (APP), which exhibit spontaneous seizures and develop AD-related neuropathology and cognitive deficits. Our results demonstrate that persistent ∆FosB activity acts through discrete modes of hippocampal target gene regulation to modulate neuronal excitability, limit recurrent seizure activity, and provide neuroprotection to hippocampal dentate granule cells in APP mice.

Keywords: Alzheimer’s disease; Epigenetic; Epilepsy; Hippocampus; Neuroprotection; ∆FosB.


Conflict of interest statement

Declaration of Competing Interest The authors declare that they have no known competing financial interests or personal relationships that could have appeared to influence the work reported in this paper.

Figures

Figure 1.
Figure 1.. Prolonged inhibition of ΔFosB activity in DGCs exacerbates recurrent seizure activity in APP mice.
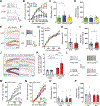
(A) Violin plot showing number of seizures per day in APP mice with 1 month or 2–4 month DG expression of AAV-GFP or AAV-ΔJunD. Dashed white lines indicate medians, dotted white lines indicate interquartile ranges. (B-C) Representative EEG traces of convulsive or non-convulsive seizure activity recorded via the hippocampal depth electrode in APP mice with (B) 1 month or (C) 2–4 month DG expression of AAV. (D-E) Proportion of seizures that were convulsive or non-convulsive in APP mice after (D) 1 month or (E) 2–4 month DG expression of AAV. All seizures observed for mice in each group were combined, and proportions were calculated for each group. Numbers in the bars indicate number of seizures observed of each type. (F) Rates of epileptiform spikes in APP mice after 1 month or 2–4 month DG expression of AAV. Bars indicate means ± SEM. Dots indicate individual mice. (G) Representative EEG traces of epileptiform spikes recorded via the hippocampal depth electrode in APP mice with 1 month or 2–4 month DG expression of AAV. An arrowhead marks the epileptiform spike shown in the top trace that is depicted in greater detail in the corresponding bottom trace. (H) Mantel-Cox survival analysis of APP-GFP and APP-ΔJunD mice after AAV injection; difference between overall survival curves of APP-GFP vs APP-ΔJunD mice was not statistically significant (p = 0.17). (I-J) Proportion of APP mice alive at (I) 1 month or (J) 2–4 months after AAV injection. Numbers in the bars indicate numbers of mice. *p < 0.05, ***p < 0.001 using Benjamini-Hochberg FDR post hoc test after two-way ANOVA (A, F). For (A), there was a significant effect of interaction [F(1,60) = 4.034, p = 0.049], but no effect of AAV [F(1,60) = 0.021, p = 0.88] or expression time [F(1,60) = 0.032, p = 0.86]. For (F), there was a significant effect of interaction [F(1,26) = 18.46, p = 0.0002] and expression time [F(1,26) = 13.37, p = 0.0011], but no effect of AAV [F(1,26) = 3.94, p = 0.058]. **p < 0.01 using Fisher’s Exact Test (D-E, I-J).
Figure 2.
Figure 2.. Unlike abbreviated ΔFosB blockade, prolonged ΔFosB blockade does not ameliorate spatial memory deficits in APP mice.
(A-B) Spatial memory in the object location memory task was assessed in NTG and APP mice at (A) 1 month or (B) 3 months after AAV injection by calculation of a discrimination index from the difference between the percentage of time spent with the displaced object during the training and testing phases of the task. Bars indicate means ± SEM. Dots indicate individual mice. ***p < 0.001 using Benjamini-Hochberg FDR post hoc test after two-way ANOVA (A-B). For (A), there was a significant effect of genotype [F(1,24) = 30.43, p < 0.0001], AAV [F(1,24) = 82.15, p < 0.0001], and interaction [F(1,24) = 95.03, p < 0.0001]. For (B), there was a significant effect of genotype [F(1,26) = 203.0, p < 0.0001], but not for AAV [F(1,26) = 0.2209, p = 0.6423] or interaction [F(1,26) = 1.024, p = 0.3210].
Figure 3.
Figure 3.. Excitability of DGCs is reduced by ΔFosB overexpression and increased by ΔFosB blockade.
(A-D) Slice electrophysiology recordings of DGCs from wildtype mice with 1 month overexpression of GFP, ΔFosB, or ΔJunD, showing (A) example traces upon injection of 125 pA current, (B) number of action potentials fired per current step, (C) rheobase, the minimum current to elicit an action potential, and (D) membrane resistance. (E) Representative images of ΔFosB immunoreactivity in DGCs from 2–4 month old naïve NTG or APP mice. Scale bar = 125 μm. (F-I) Slice electrophysiology recordings of DGCs from 2–4 month old naïve NTG and APP mice, showing (F) example traces upon injection of 125 pA current, (G) number of action potentials fired per current step, (H) rheobase, and (I) membrane resistance. (J-K) Representative (J) images and (K) quantification of ΔFosB immunoreactivity in NTG or APP mice with 3 month expression of AAV-GFP or AAV-ΔJunD. Scale bar = 125 μm. (L-P) Slice electrophysiology recordings of DGCs from NTG or APP mice with 3 month expression of AAV-GFP or AAV-ΔJunD, showing (L) example traces upon injection of 125 pA current, (M-N) number of action potentials fired per current step, (O) rheobase, and (P) membrane resistance. Data indicate means ± SEM. Dots indicate individual cells or, in (K), mice. *p < 0.05, **p < 0.01, ***p < 0.001 using Benjamini-Hochberg FDR post hoc test after two-way repeated-measures ANOVA (B, M-N). For (B), there was a significant effect of current step [F(9,324) = 24.28, p < 0.0001], AAV [F(2,36) = 12.94, p < 0.0001], and interaction [F(18,324) = 5.562, p < 0.0001]. Post hoc comparisons between GFP and ΔFosB or ΔJunD groups were significant as indicated. For (M), there was a significant effect of current step [F(8,176) = 44.56, p < 0.0001], AAV [F(1,22) = 6.237, p = 0.0205], and interaction [F(8,176) = 2.180, p = 0.0311]. For (N), there was a significant effect of current step [F(8,336) = 151.5, p < 0.0001] and interaction [F(8,336) = 2.419, p = 0.0150], but no effect of AAV [F(1,42) = 2.956, p = 0.0929]. *p < 0.05 using Benjamini-Hochberg post hoc test after one-way ANOVA (C-D). For (C), there was a significant effect [F(2,48) = 3.672, p = 0.0328]. For (D), there was no significant effect [F(2,36) = 0.5117, p = 0.6038]. *p < 0.05 using Benjamini-Hochberg post hoc test after repeated-measures mixed-model analysis of genotype and current step (G). For (G), there was a significant effect of genotype [F(1,226) = 14.27, p = 0.0002] and current step [F(11,379) = 115.4, p < 0.0001], but no effect of interaction [F11,226) = 0.4913, p = 0.9076]. *p < 0.05 using two-tailed unpaired Student’s t-test (H-I). ***p < 0.001 using Benjamini-Hochberg FDR post hoc test after two-way ANOVA (K, O-P). For (K), there was a significant effect of genotype [F(1,44) = 28.96, p < 0.0001], AAV [F(1,44) = 8.630, p = 0.0052], and interaction [F(1,44) = 6.921, p = 0.0117]. For (O), there was no effect of genotype [F(1,70) = 0.4794, p = 0.4910], AAV [F(1,70) = 2.889, p = 0.0931], or interaction [F(1,70) = 1.814, p = 0.1824]. For (P), there was no effect of genotype [F(1,44) = 0.4268, p = 0.7952], AAV [F(1,44) = 0.04015, p = 0.8421], or interaction [F(1,44) = 0.06820, p = 0.8421].
Figure 4.
Figure 4.. ΔFosB is neuroprotective in conditions of excitotoxicity.
(A-D) Representative NeuN immunostaining and quantification of the average thickness of the dentate granule cell layer (DGCL) in NTG and APP mice with (A-B) 1 month or (C-D) 3 month expression of AAV-GFP or AAV-ΔJunD. Scale bar = 125 μm. (E) Timeline of experimental procedures to measure markers of cell stress under NMDA challenge in primary hippocampal neurons that express HSV-GFP or HSV-ΔFosB. (F-G) (F) Example images and (G) quantification demonstrating similar expression of both HSVs in primary neurons. Arrows indicate transduced neurons expressing GFP reporter, arrowheads indicate non-transduced neurons. Scale bar = 125 μm. (H) Example images showing healthy versus pyknotic neurons. Arrow indicates condensed chromatin, arrowhead indicates hyperintensity of MAP2 staining and neurite retraction. Scale bar = 20 μm. (I) Proportions of GFP- or ΔFosB-expressing neurons identified as pyknotic at escalating doses of NMDA. (J) Comparison of lactate dehydrogenase (LDH) release from GFP- or ΔFosB-expressing neurons at escalating doses of NMDA. “Virus Only” (VO) denotes a control condition with no vehicle washes (I-J). Data illustrate means ± SEM. Dots indicate individual mice. ***p < 0.001 using Benjamini-Hochberg post hoc test (B, D) or *p < 0.05, **p < 0.01 using Tukey’s post hoc test (I-J) after two-way ANOVA. For (B), there was no significant effect of genotype [F(1,27) = 1.131, p = 0.2969], AAV [F(1,27) = 0.01797, p = 0.8944], or interaction [F(1,27) = 0.1790, p = 0.6756]. For (D), there was a significant effect of genotype [F(1,45) = 25.15, p < 0.0001], AAV [F(1,45) = 18.28, p < 0.0001], and interaction [F(1,45) = 5.433, p = 0.0243]. For (I), there was a significant effect of NMDA dose [F(4,40) = 63.58, p < 0.0001], HSV [F(1,49) = 11.88, p = 0.001], but no effect for interaction [F(4,40) = 1.456, p = 0.234]. For (J), there was a significant effect of NMDA dose [F(3,16) = 140.0, p < 0.0001], HSV [F(1,23) = 10.00, p = 0.006], but no effect for interaction [F(3,16) = 0.007, p = 0.632].
Figure 5.
Figure 5.. ΔFosB epigenetically regulates hippocampal gene expression via discrete modes of gene regulation.
(A) Biological Process Gene Ontology (GO) network of GO Terms (nodes) that are enriched by ChIP-seq-identified ΔFosB target genes in APP mice that encode or regulate ion channels, transporters, and pathways known to impact neuronal excitability. The size of GO Term nodes indicates levels of significance (lower p-values have bigger nodes), and nodes are connected by lines whose thickness denotes numbers of genes that are shared between nodes. (B-D) Benchtop RT-qPCR quantifications showing the impact of 3 month AAV-GFP or AAV-ΔJunD expression on hippocampal mRNA expression of ΔFosB target genes (B) Hpcal1, (C) Gal, and (D) Lrrk2 in NTG and APP mice. Bars indicate means ± SEM. Dots indicate individual mice. *p < 0.05, **p < 0.01 using Benjamini-Hochberg post-hoc test after two-way ANOVA (B-D). For (B), there was a significant effect of genotype [F(1,43) = 4.816, p = 0.0336] and AAV [F(1,43) = 5.076, p = 0.0296], but no effect of interaction [F(1,43) = 1.175, p = 0.2844]. For (C), there was a significant effect of genotype [F(1,43) = 10.41, p = 0.0024] and AAV [F(1,43) = 5.670, p = 0.0218], but no effect of interaction [F(1,43) = 3.561, p = 0.0659]. For (D), there was no significant effect of genotype [F(1,43) = 1.495, p = 0.2280], AAV [F(1,43) = 0.2335, p = 0.6314], or interaction [F(1,43) = 0.09933, p = 0.7542].
Figure 6.
Figure 6.. Summary model.
In conditions with recurrent seizures, ΔFosB accumulates in hippocampal neurons and binds at target gene loci. ΔFosB then recruits other factors such as co-factors or histone-marking enzymes to epigenetically regulate gene expression in discrete modes that could, for example, stabilize expression or alter expression of different target genes. Such regulation occurs over different timescales, which may reflect cellular conditions or availability of binding partners. Persistent epigenetic regulation by ΔFosB can coordinate programs of cellular function that regulate neuronal excitability and viability, while impairing synaptic plasticity and cognition, to generate a net neuroprotective response against hyperexcitability and excitotoxicity in the contexts of recurrent seizures such as those that occur in AD and in epilepsy. Given the breadth of genes bound by ΔFosB, other impacts of ΔFosB-induced epigenetic regulation are likely to exist as well and remain to be characterized.

Similar articles

Cited by

References

    1. Aasly JO, Shi M, Sossi V, Stewart T, Johansen KK, Wszolek ZK, Uitti RJ, Hasegawa K, Yokoyama T, Zabetian CP, Kim HM, Leverenz JB, Ginghina C, Armaly J, Edwards KL, Snapinn KW, Stoessl AJ, Zhang J, 2012. Cerebrospinal fluid amyloid beta and tau in LRRK2 mutation carriers. Neurology 78, 55–61. - PMC - PubMed
    1. Adlaf EW, Vaden RJ, Niver AJ, Manuel AF, Onyilo VC, Araujo MT, Dieni CV, Vo HT, King GD, Wadiche JI, Overstreet-Wadiche L, 2017. Adult-born neurons modify excitatory synaptic transmission to existing neurons. Elife 6, e19886. - PMC - PubMed
    1. Altuna M, Giménez S, Fortea J, 2021. Epilepsy in Down Syndrome: A Highly Prevalent Comorbidity. J Clin Med 10, 2776. - PMC - PubMed
    1. Amatniek JC, Hauser WA, DelCastillo-Castaneda C, Jacobs DM, Marder K, Bell K, Albert M, Brandt J, Stern Y, 2006. Incidence and predictors of seizures in patients with Alzheimer’s disease. Epilepsia 47, 867–872. - PubMed
    1. Anouar Y, Lee HW, Eiden LE, 1999. Both inducible and constitutive activator protein-1-like transcription factors are used for transcriptional activation of the galanin gene by different first and second messenger pathways. Mol Pharmacol 56, 162–169. - PubMed

Substances