. 2024 Apr 20;24(1):142.
doi: 10.1186/s12935-024-03309-1.

High LGALS3 expression induced by HCP5/hsa-miR-27b-3p correlates with poor prognosis and tumor immune infiltration in hepatocellular carcinoma

Affiliations

High LGALS3 expression induced by HCP5/hsa-miR-27b-3p correlates with poor prognosis and tumor immune infiltration in hepatocellular carcinoma

Yinghui Ren et al. Cancer Cell Int. .

Abstract

Background: Hepatocellular carcinoma (HCC) is widely recognized for its unfavorable prognosis. Increasing evidence has revealed that LGALS3 has an essential function in initiating and developing several malignancies in humans. Nevertheless, thorough analysis of the expression profile, clinical prognosis, pathway prediction, and immune infiltration of LGALS3 has not been fully explored in HCC.

Methods: In this study, an initial pan-cancer analysis was conducted to investigate the expression and prognosis of LGALS3. Following a comprehensive analysis, which included expression analysis and correlation analysis, noncoding RNAs that contribute to the overexpression of LGALS3 were subsequently identified. This identification was further validated using HCC clinical tissue samples. TIMER2 and GEPIA2 were employed to examine the correlation between LGALS3 and HCP5 with immunological checkpoints, cell chemotaxis, and immune infiltration in HCC. The R program was applied to analyze the expression distribution of immune score in in HCC patients with high and low LGALS3 expression. The expression profiles of immune checkpoints were also analyzed. Use R to perform GSVA analysis in order to explore potential signaling pathways.

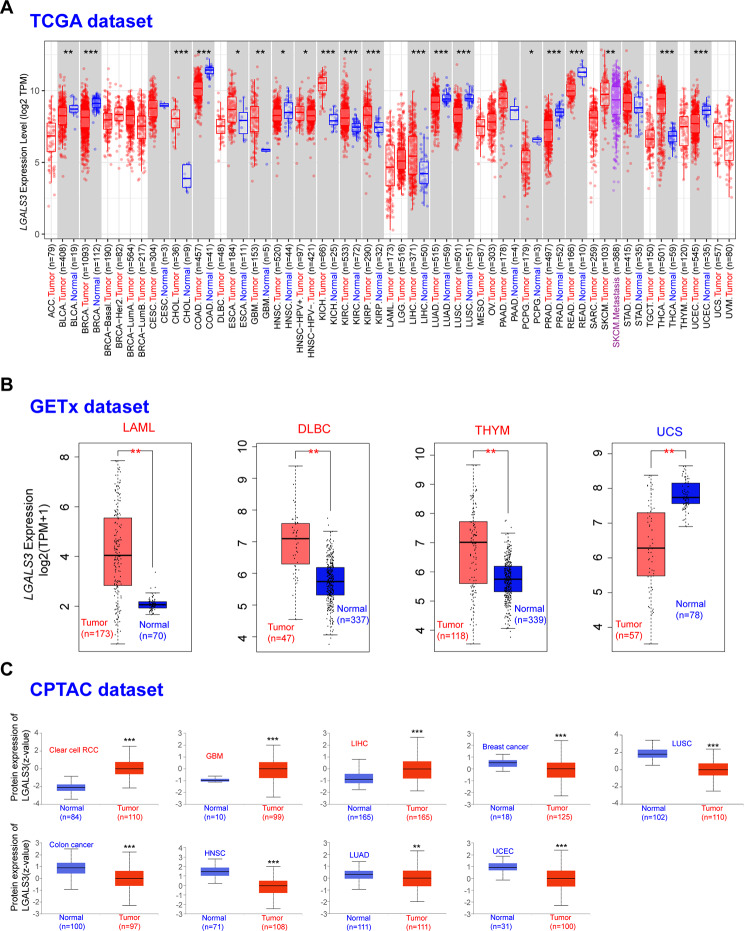
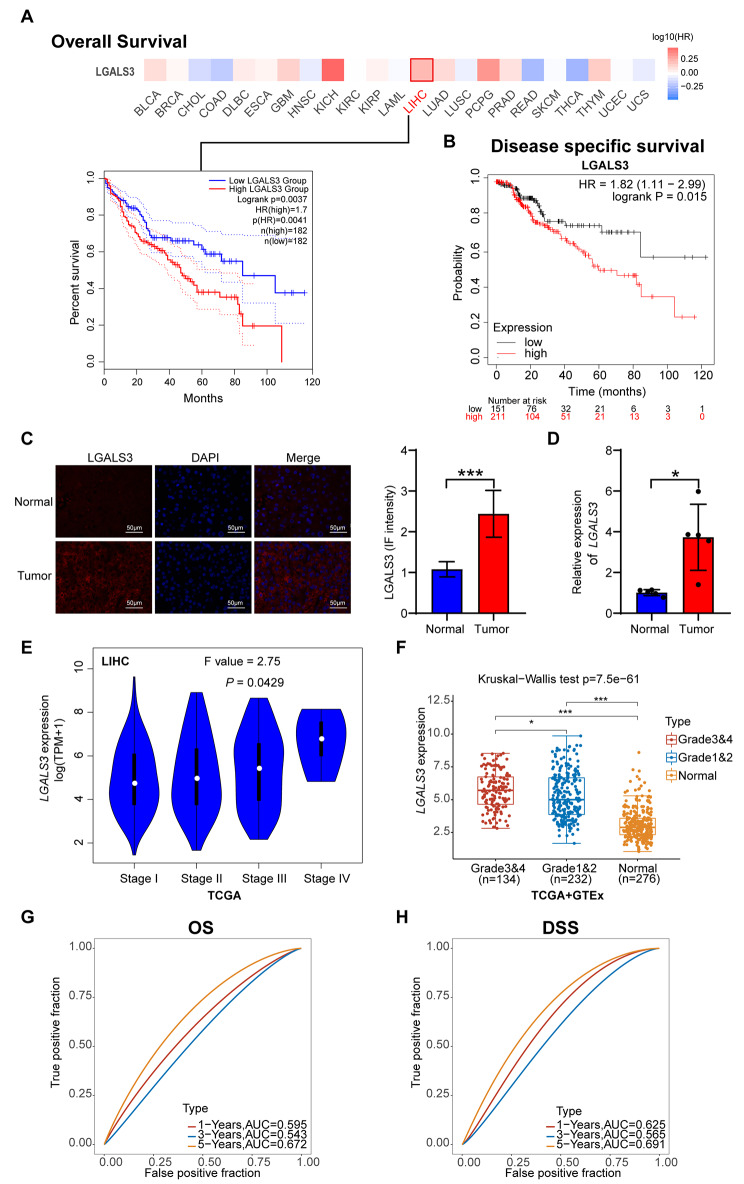
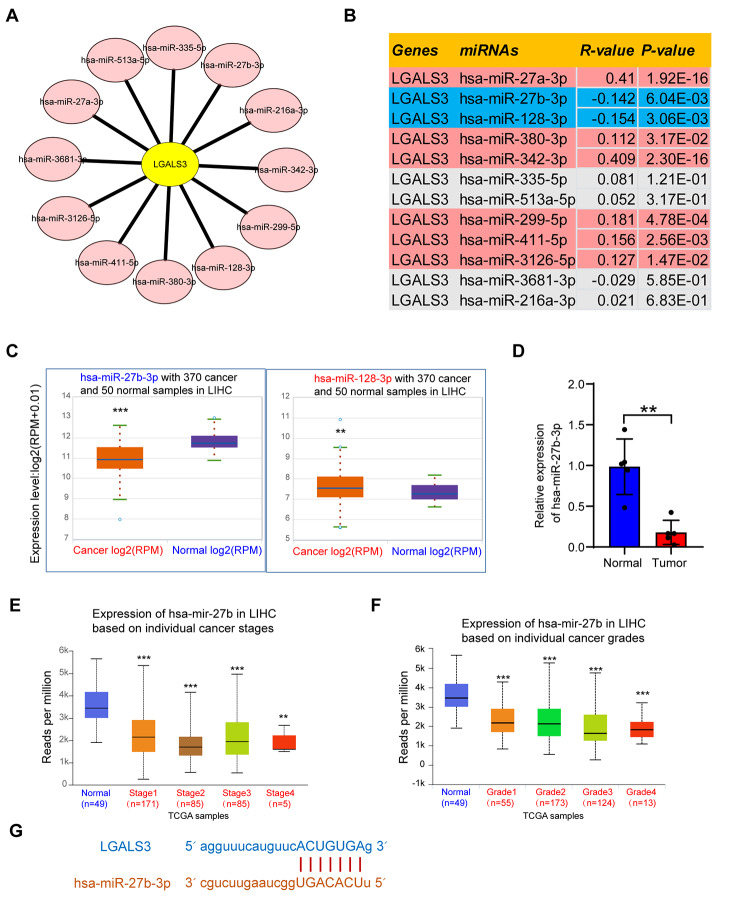
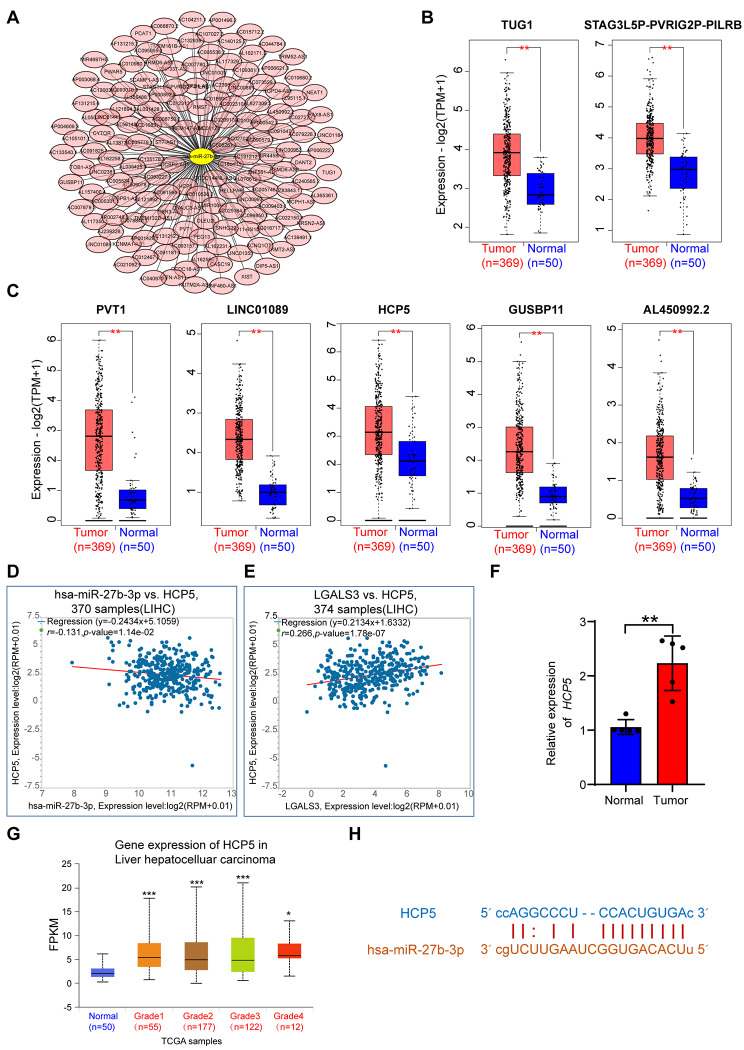
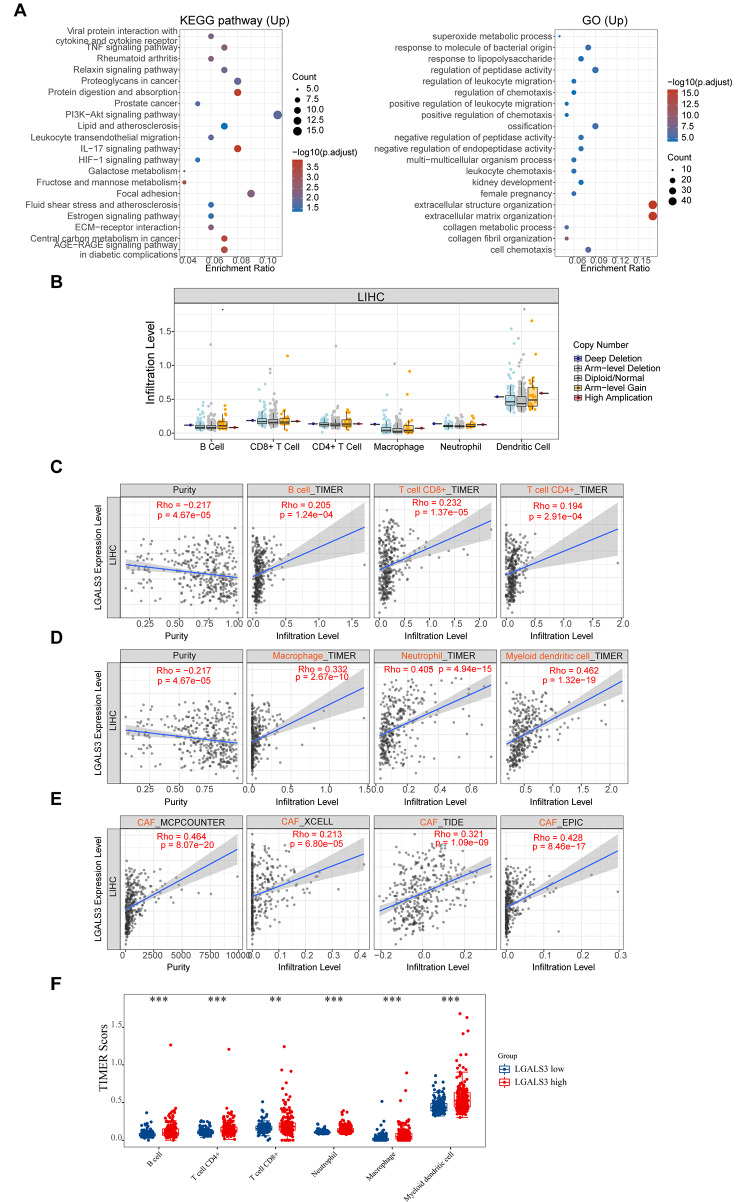
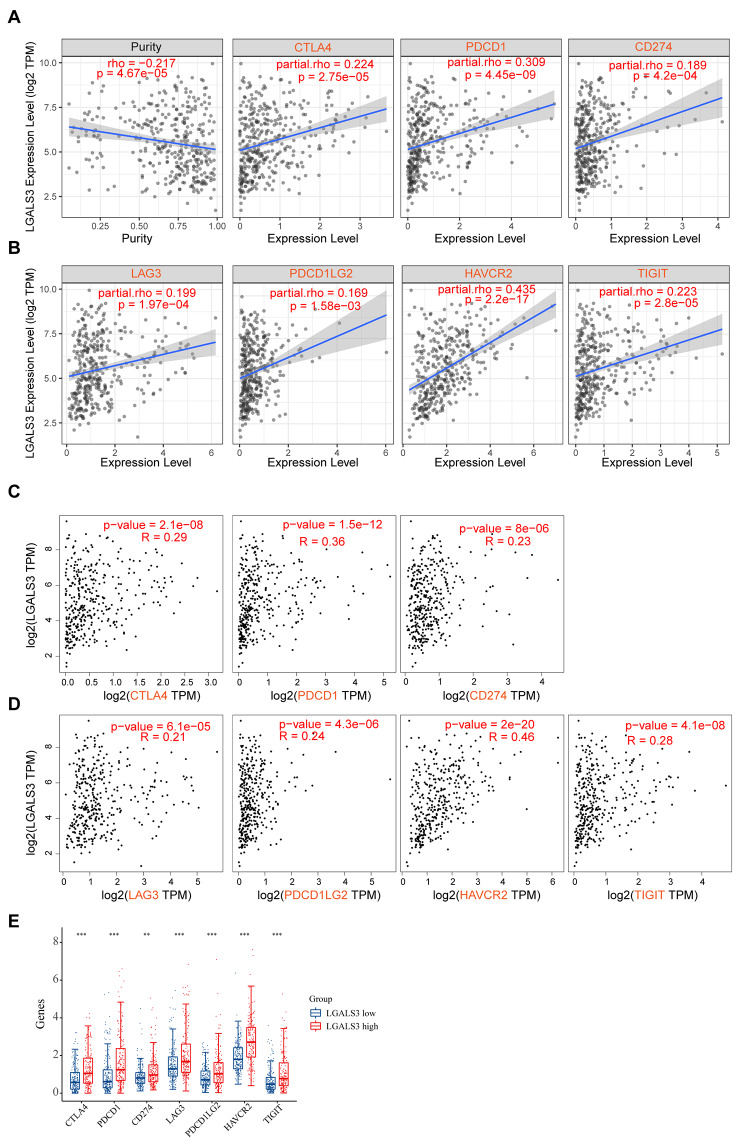
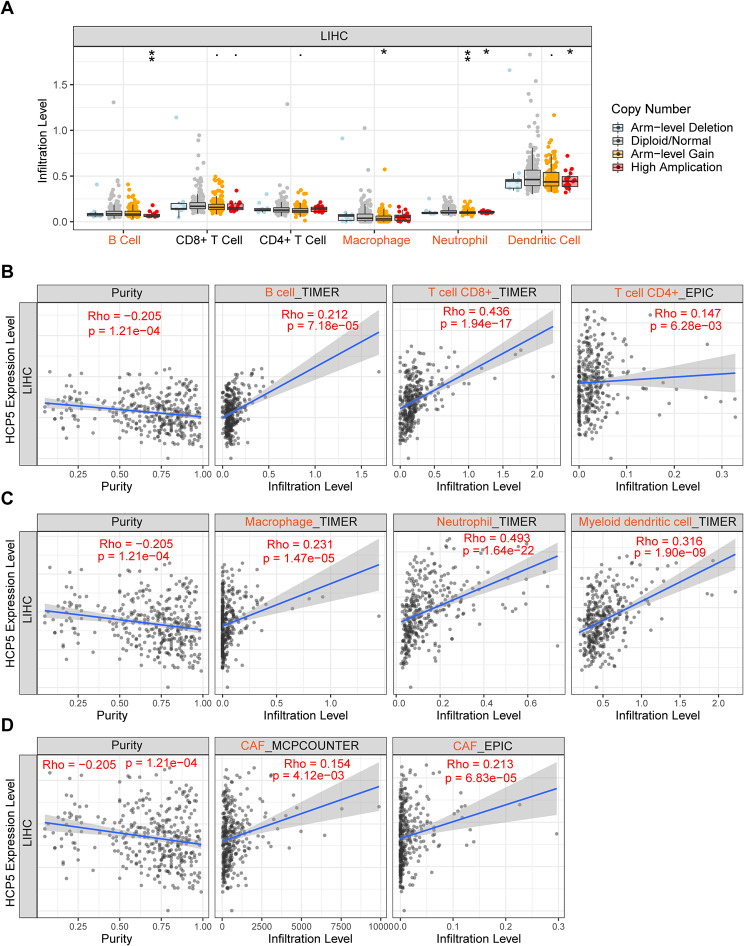
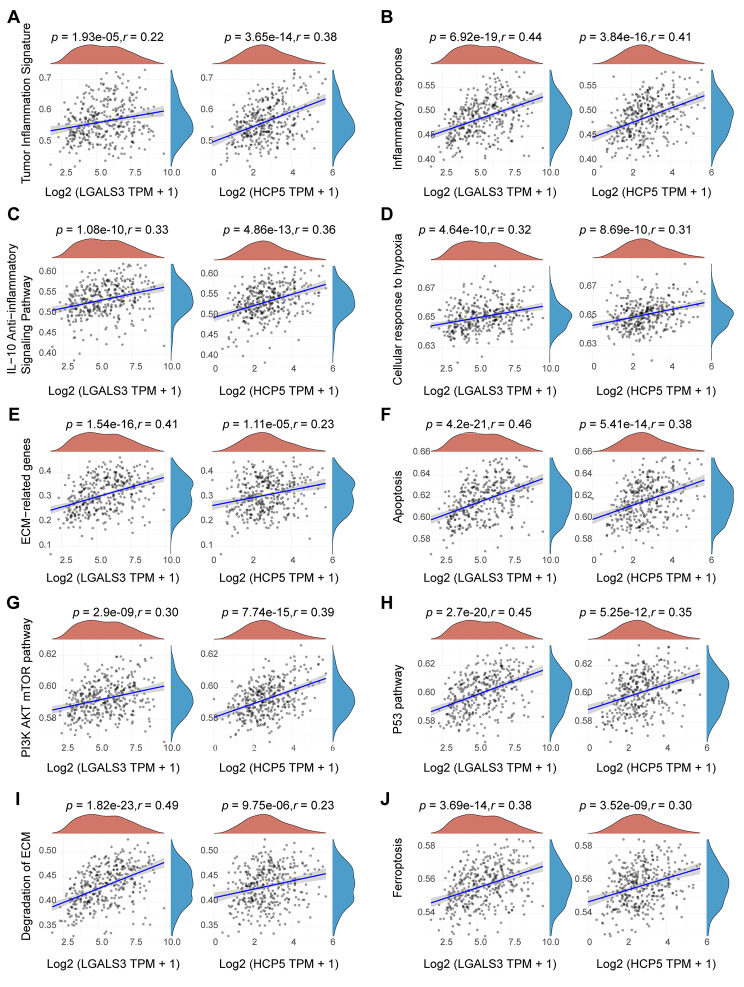
Results: First, we conducted pan-cancer analysis for LGALS3 expression level through an in-depth analysis of public databases and found that HCC has a high LGALS3 gene and protein expression level, which were then verified in clinical HCC specimens. Meanwhile, high LGALS3 gene expression is related to malignant progression and poor prognosis of HCC. Univariate and multivariate analyses confirmed that LGALS3 could serve as an independent prognostic marker for HCC. Next, by combining comprehensive analysis and validation on HCC clinical tissue samples, we hypothesize that the HCP5/hsa-miR-27b-3p axis could serve as the most promising LGALS3 regulation mechanism in HCC. KEGG and GO analyses highlighted that the LGALS3-related genes were involved in tumor immunity. Furthermore, we detected a significant positive association between LGALS3 and HCP5 with immunological checkpoints, cell chemotaxis, and immune infiltration. In addition, high LGALS3 expression groups had significantly higher immune cell scores and immune checkpoint expression levels. Finally, GSVA analysis was performed to predict potential signaling pathways linked to LGALS3 and HCP5 in immune evasion and metabolic reprogramming of HCC.

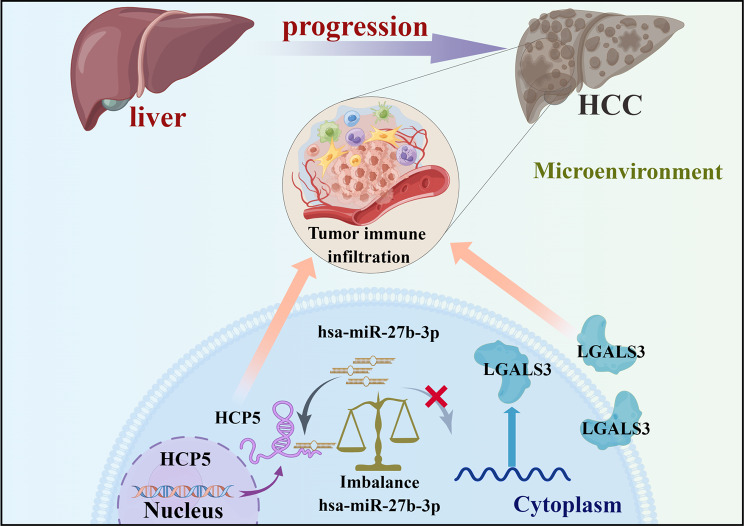
Conclusions: Our findings indicated that the upregulation of LGALS3 via the HCP5/hsa-miR-27b-3p axis is associated with unfavorable prognosis and increased tumor immune infiltration in HCC.

Keywords: HCP5; Hepatocellular carcinoma; Immune cell infiltration; LGALS3; Prognosis; Tumor microenvironment.


Conflict of interest statement

The authors state no competing interests.

Figures

Fig. 1
Fig. 1
Expression level of LGALS3 gene in different tumors. (A) The expression of the LGALS3 gene in different cancers or specific cancer subtypes was assessed by TIMER2 (data from TCGA). (B) For the type of LAML, DLBC, THYM, and UCS in the TCGA database, the normal control samples of the GTEx database were included as controls. (C) The expression level of LGALS3 protein between normal tissue and primary tissue of clear cell RCC, GBM, LIHC, breast cancer, colon cancer, HNSC, LUAD, LUSC, and UCEC analyzed by CPTAC dataset. *p value < 0.05; **p value < 0.01; ***p value < 0.001
Fig. 2
Fig. 2
Correlation between LGALS3 gene expression and survival prognosis of various human cancers. (A) We used GEPIA2 to obtain the OS analyses of LGALS3 across the 23 types of cancer. The survival map and Kaplan-Meier curves with positive results are offered. (B) The prognostic value of LGALS3 in HCC was assessed according to DSS by Kaplan–Meier plotter. (C) Representative immunofluorescence images of LGALS3 protein in HCC tissues and adjacent normal tissues. Scale bar, 50 μm. Immunofluorescence image quantification results (right). (D) qRT-PCR analysis of LGALS3 expression in tumor and adjacent normal tissues from 5 HCC patients. (E) The differential expression of LGALS3 in HCC with main pathological stages (stage I, stage II, stage III, and stage IV) assessed by GEPIA2. (F) The expression distribution of LGALS3 in normal tissues and HCC with various tumor grades. (G) ROC curve for LGALS3 in predicting 1-, 3-, and 5-year OS. (H) ROC curve for LGALS3 in predicting 1-, 3-, and 5-year DSS. The higher values of AUC corresponding to higher predictive power. *p value < 0.05; ***p value < 0.001
Fig. 3
Fig. 3
Identification of hsa-miR-27b-3p as a potential upstream miRNA of LGALS3 in HCC. (A) Candidate miRNAs interacting with LGALS3 mRNA established by Cytoscape software. (B) Correlation analysis between LGALS3 expression and predicted miRNAs in HCC based on the ENCORI database. (C) The expression of hsa-miR-27b-3p and hsa-miR-128-3p in HCC and corresponding normal tissues analyzed by ENCORI database. (D) qRT-PCR analysis of hsa-miR-27b-3p expression in tumor and adjacent normal tissues from 5 HCC patients. The differential expression of hsa-miR-27b in HCC with various tumor stages (E) and tumor grades (F) assessed by UALCAN. (G) Schematic representation of the hsa-miR-27b-3p target sequence within the 3′UTR of LGALS3. **p value < 0.01; ***p value < 0.001
Fig. 4
Fig. 4
Prediction and identification of the upstream lncRNAs interacting with hsa-miR-27b-3p in HCC. (A) Candidate lncRNAs interacting with hsa-miR-27b-3p established by Cytoscape software. (BC) The expression of TUG1, STAG3L5P-PVRIG2P-PILRB, PVT1, LINC01089, HCP5, GUSBP11, and AL450992.2 in TCGA HCC compared to “TCGA normal” data. Correlation analysis between HCP5 and hsa-miR-27b-3p (D) or HCP5 and LGALS3 (E) in HCC analyzed by ENCORI database. (F) qRT-PCR analysis of HCP5 expression in tumor and adjacent normal tissues from 5 HCC patients. (G) The differential expression of HCP5 in HCC with various tumor grades assessed by UALCAN. (H) Schematic representation of the 3′UTR of HCP5 with the predicted target site for hsa-miR-27b-3p. *p value< 0.05 ; **p value < 0.01; ***p value < 0.001
Fig. 5
Fig. 5
The relationship of LGALS3 expression with immune cell infiltration in HCC. (A) The enriched KEGG signaling pathways were selected to demonstrate the biological actions of major potential mRNA. The abscissa indicates gene ratio and the enriched pathways were presented the ordinate. GO analysis of potential targets of mRNAs. Colors represent the significance of differential enrichment, the size of the circles represents the number of genes, the larger the circle, the greater the number of genes. In the enrichment result, p < 0.05 is considered to be a meaningful pathway. (B) Association of copy number alteration of LGALS3 with the infiltration level of various immune cells in HCC assessed by TIMER. (CE) Correlation analysis between LGALS3 expression level and B cell, CD4+ T cell, CD8+ T cell, neutrophil, macrophage, dendritic cell, or CAFs infiltration level in HCC assessed by TIMER2. (F) The expression distribution of immune score in HCC patients with high and low LGALS3 expression. The abscissa represents immune cell types, and the ordinate represents the expression distribution of immune score in low LGALS3 expression groups or high LGALS3 expression groups. **p value < 0.01; ***p value < 0.001
Fig. 6
Fig. 6
The relationship between LGALS3 expression and immune checkpoint genes in HCC. (AB) The correlation of LGALS3 with expression of CTLA4, PDCD1, CD274, LAG3, PDCD1LG2, HAVCR2 or TIGIT in HCC analyzed by TIMER2. (CD) The expression correlation of LGALS3 with the expression of CTLA4, PDCD1, CD274, LAG3, PDCD1LG2, HAVCR2, or TIGIT in HCC assessed by GEPIA database. (E) The expression distribution of CTLA4, PDCD1, CD274, LAG3, PDCD1LG2, HAVCR2, or TIGIT gene in HCC patients with high and low LGALS3 expression. The abscissa represents different groups of samples, and the ordinate represents the expression distribution of gene, different colors represent different groups. **p value < 0.01; ***p value < 0.001
Fig. 7
Fig. 7
The relationship of HCP5 expression with immune cell infiltration in HCC. (A) Association of copy number alteration of HCP5 with the infiltration level of various immune cells in HCC assessed by TIMER. *p value <0.05; **p value < 0.01.  (BD) Correlation analysis between HCP5 expression level and B cell, CD4+ T cell, CD8+ T cell, neutrophil, macrophage, dendritic cell, or CAF infiltration level in HCC assessed by TIMER2
Fig. 8
Fig. 8
The correlation between LGALS3 or HCP5 and pathway score in HCC analyzed by Spearman method. The abscissa represents the expression of LGALS3 or HCP5 gene, and the ordinate represents the pathway score of this gene in HCC. The red curve represents the density distribution of LGALS3 or HCP5 gene, and the blue curve represents the distribution of pathway score. The positive correlation between LGALS3 or HCP5 and pathway score are given (|r| >0.2, p value < 0.05, n = 371). Ten pathways are included: (A) tumor inflammation signature; (B) inflammatory response; (C) IL-10 anti-inflammatory signaling pathway; (D) cellular response to hypoxia; (E) ECM-related genes; (F) apoptosis; (G) PI3K/AKT/mTOR pathway; (H) P53 pathway; (I) degradation of ECM; (J) ferroptosis
Fig. 9
Fig. 9
The model of HCP5/hsa-miR-27b-3p/LGALS3 axis in carcinogenesis of HCC (By Figdraw)

Similar articles

Cited by

References

    1. Sung H, Ferlay J, Siegel RL, Laversanne M, Soerjomataram I, Jemal A, et al. Global Cancer statistics 2020: GLOBOCAN estimates of incidence and Mortality Worldwide for 36 cancers in 185 countries. CA Cancer J Clin. 2021;71:209–49. doi: 10.3322/caac.21660. - DOI - PubMed
    1. Chen Y, Tian Z. HBV-Induced Immune Imbalance in the development of HCC. Front Immunol. 2019;10:2048. doi: 10.3389/fimmu.2019.02048. - DOI - PMC - PubMed
    1. Llovet JM, Kelley RK, Villanueva A, Singal AG, Pikarsky E, Roayaie S, et al. Hepatocellular carcinoma. Nat Rev Dis Primers. 2021;7:6. doi: 10.1038/s41572-020-00240-3. - DOI - PubMed
    1. Perera MPJ, Thomas PB, Risbridger GP, Taylor R, Azad A, Hofman MS et al. (2022). Chimeric Antigen Receptor T-Cell Therapy in Metastatic Castrate-Resistant Prostate Cancer. Cancers 14. - PMC - PubMed
    1. Khan TH, Muhammad N, Tarique M, Usmani D, Naz H, Sarode A. The role of Cancer-Specific Target antigens in CAR T Cell Therapy in Hematological Malignancies. Current Tissue Microenvironment Reports; 2024.

LinkOut - more resources