. 2024 Apr 20;15(1):3379.
doi: 10.1038/s41467-024-46265-0.

Diet changes due to urbanization in South Africa are linked to microbiome and metabolome signatures of Westernization and colorectal cancer

Affiliations

Diet changes due to urbanization in South Africa are linked to microbiome and metabolome signatures of Westernization and colorectal cancer

M C Ramaboli et al. Nat Commun. .

Abstract

Transition from traditional high-fiber to Western diets in urbanizing communities of Sub-Saharan Africa is associated with increased risk of non-communicable diseases (NCD), exemplified by colorectal cancer (CRC) risk. To investigate how urbanization gives rise to microbial patterns that may be amenable by dietary intervention, we analyzed diet intake, fecal 16 S bacteriome, virome, and metabolome in a cross-sectional study in healthy rural and urban Xhosa people (South Africa). Urban Xhosa individuals had higher intakes of energy (urban: 3,578 ± 455; rural: 2,185 ± 179 kcal/d), fat and animal protein. This was associated with lower fecal bacteriome diversity and a shift from genera favoring degradation of complex carbohydrates (e.g., Prevotella) to taxa previously shown to be associated with bile acid metabolism and CRC. Urban Xhosa individuals had higher fecal levels of deoxycholic acid, shown to be associated with higher CRC risk, but similar short-chain fatty acid concentrations compared with rural individuals. Fecal virome composition was associated with distinct gut bacterial communities across urbanization, characterized by different dominant host bacteria (urban: Bacteriodota; rural: unassigned taxa) and variable correlation with fecal metabolites and dietary nutrients. Food and skin microbiota samples showed compositional differences along the urbanization gradient. Rural-urban dietary transition in South Africa is linked to major changes in the gut microbiome and metabolome. Further studies are needed to prove cause and identify whether restoration of specific components of the traditional diet will arrest the accelerating rise in NCDs in Sub-Saharan Africa.


Conflict of interest statement

The authors declare no competing interests.

Figures
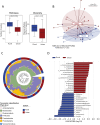
Fig. 1
Fig. 1. The fecal microbiota of urban Xhosa individuals is less diverse and shows a distinct clustering and composition.
Analysis of fecal microbiota by 16 S rRNA gene sequencing from healthy rural and urban Xhosa individuals showing A bacterial community richness or Shannon Effective as indices for α-diversity, B compositional clustering at the multi-dimensional scaling (MDS) plot (PERMANOVA test p = 0.001), C cumulative relative abundance at phylum level in a phylogenetic tree and circular plot, where the outer ring indicates cohort distribution with urban (red) and rural (blue) individuals and the inner ring indicates taxonomic classification covering 100% relative abundance at phylum level for the respective sample, D significantly differential bacterial genera identified by linear discriminant analysis (LDA) effect size (LEfSe). Box-and-whisker plots with center as median, box from 25th to 75th percentile, and whiskers showing minima and maxima according to Tukey, Statistical analysis using two-sided Mann–Whitney-U-test or multivariate comparison corrected for multiple testing by the Benjamini–Hochberg method with rural n = 21, urban n = 20 samples, respectively. A value of p < 0.05 was considered to be statistically significant.
Fig. 2
Fig. 2. Urban Xhosa individuals have similar SCFA but higher DCA levels compared with rural individuals, correlating with distinct microbial genera.
A Levels of main short-chain fatty acids detected in feces of rural and urban Xhosa individuals. Levels of B primary and C secondary bile acids detected in feces of rural and urban Xhosa individuals (CA cholic acid, CDCA chenodeoxycholic acid, DCA deoxycholic acid, LCA lithocholic acid, UDCA = ursodeoxycholic acid). Statistical analysis was performed by two-sided unpaired t-test (data normally distributed) or non-parametric Mann–Whitney-U-test (data not normally distributed) with rural n = 24 and urban n = 19 samples. A value of p < 0.05 was considered to be statistically significant. Box-and-whisker plots with whiskers minima and maxima according to Tukey, center as median, box from 25th to 75th percentile. Source data are provided in Supplementary Data file 1. D Heatmap of Pearson’s correlations between dietary information, fecal metabolites and microbial genera detected to be significantly different between rural and urban Xhosa cohorts using 16 S rRNA gene sequencing data. Correlations were adjusted for multiple testing using the Benjamini-Hochberg FDR. The color of the circles indicates the type of correlation (positive/negative), and the radius of the circles is proportional to the correlation. Statistical analysis was performed with sample numbers as listed for previous analyses in Table 2, Figs. 1 and 2.
Fig. 3
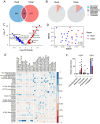
Fig. 3. The fecal virome of urban Xhosa individuals shows distinct composition and correlation with fecal metabolites and dietary nutrients.
A Shared and unique viral contigs (VCs) between rural (n = 19) and urban (n = 9) Xhosa individuals. B Proportion of VCs based on predictions of their taxa. C Differentially abundant VCs in rural (n = 19) compared to urban (n = 9) Xhosa fecal samples. D NMDS plot of Bray–Curtis dissimilarity of VCs between rural (n = 19) and urban (n = 8) Xhosa fecal samples. E Pearson’s correlation of VCs differentially abundant in rural (n = 19) or urban (n = 9) Xhosa fecal samples and dietary nutrients or fecal metabolites, respectively. F Proportion of relative abundance of VCs based on predicted bacterial hosts from rural (n = 19) and urban (n = 9) Xhosa fecal samples. Statistical analysis was performed by two-way ANOVA corrected for multiple comparisons with Sidak’s test. A value of p < 0.05 was considered to be statistically significant. When present, error bars correspond to the standard deviation of host abundances.
Fig. 4
Fig. 4. Differences in food microbiota reflect food ingredients of rural and urban Xhosa people.
Analysis of microbiota in frozen food samples by 16S rRNA gene sequencing obtained from rural and urban Xhosa individuals showing A richness as an index for α-diversity, B Bray–Curtis dissimilarity at the multi-dimensional scaling (MDS) plot (PERMANOVA test p = 0.004), C cumulative absolute abundance at the order level, D significantly different relative abundance at the genus level. Statistical analysis using a two-sided Wilcoxon test corrected for multiple testing by the Benjamini–Hochberg method using normalized samples (rural n = 7 and urban n = 6). A value of p < 0.05 was considered to be statistically significant. Box-and-whisker plots with whiskers showing minima to maxima, center as median, box from 25th to 75th percentile.
Fig. 5
Fig. 5. Different bacteria detected on skin swabs of rural and urban Xhosa people.
Analysis of microbiota in skin swab samples (hands) by 16S rRNA gene sequencing obtained from rural and urban Xhosa individuals showing A richness as an index for α-diversity, B Bray–Curtis dissimilarity at the multi-dimensional scaling (MDS) plot (PERMANOVA test p = 0.003), C cumulative absolute abundance at the phylum level, D significantly different relative abundance at the genus level. Statistical analysis using a two-sided Wilcoxon test corrected for multiple testing by the Benjamini–Hochberg method using normalized samples (rural n = 7 and urban n = 6). A value of p < 0.05 was considered to be statistically significant. Box-and-whisker plots with whiskers showing minima to maxima, center as median, box from 25th to 75th percentile.

References

    1. Sung H, et al. Global Cancer Statistics 2020: GLOBOCAN estimates of incidence and mortality worldwide for 36 cancers in 185 countries. CA Cancer J. Clin. 2021;71:209–249. - PubMed
    1. O'Keefe SJ. The association between dietary fibre deficiency and high-income lifestyle-associated diseases: Burkitt’s hypothesis revisited. Lancet Gastroenterol. Hepatol. 2019;4:984–996. - PMC - PubMed
    1. Aune D, et al. Dietary fibre, whole grains, and risk of colorectal cancer: systematic review and dose-response meta-analysis of prospective studies. Br. Med. J. 2011;343:d6617. - PMC - PubMed
    1. Reynolds A, et al. Carbohydrate quality and human health: a series of systematic reviews and meta-analyses. Lancet. 2019;393:434–445. - PubMed
    1. Wang L, et al. Association of ultra-processed food consumption with colorectal cancer risk among men and women: results from three prospective US cohort studies. Br. Med. J. 2022;378:e068921. - PMC - PubMed

Supplementary concepts